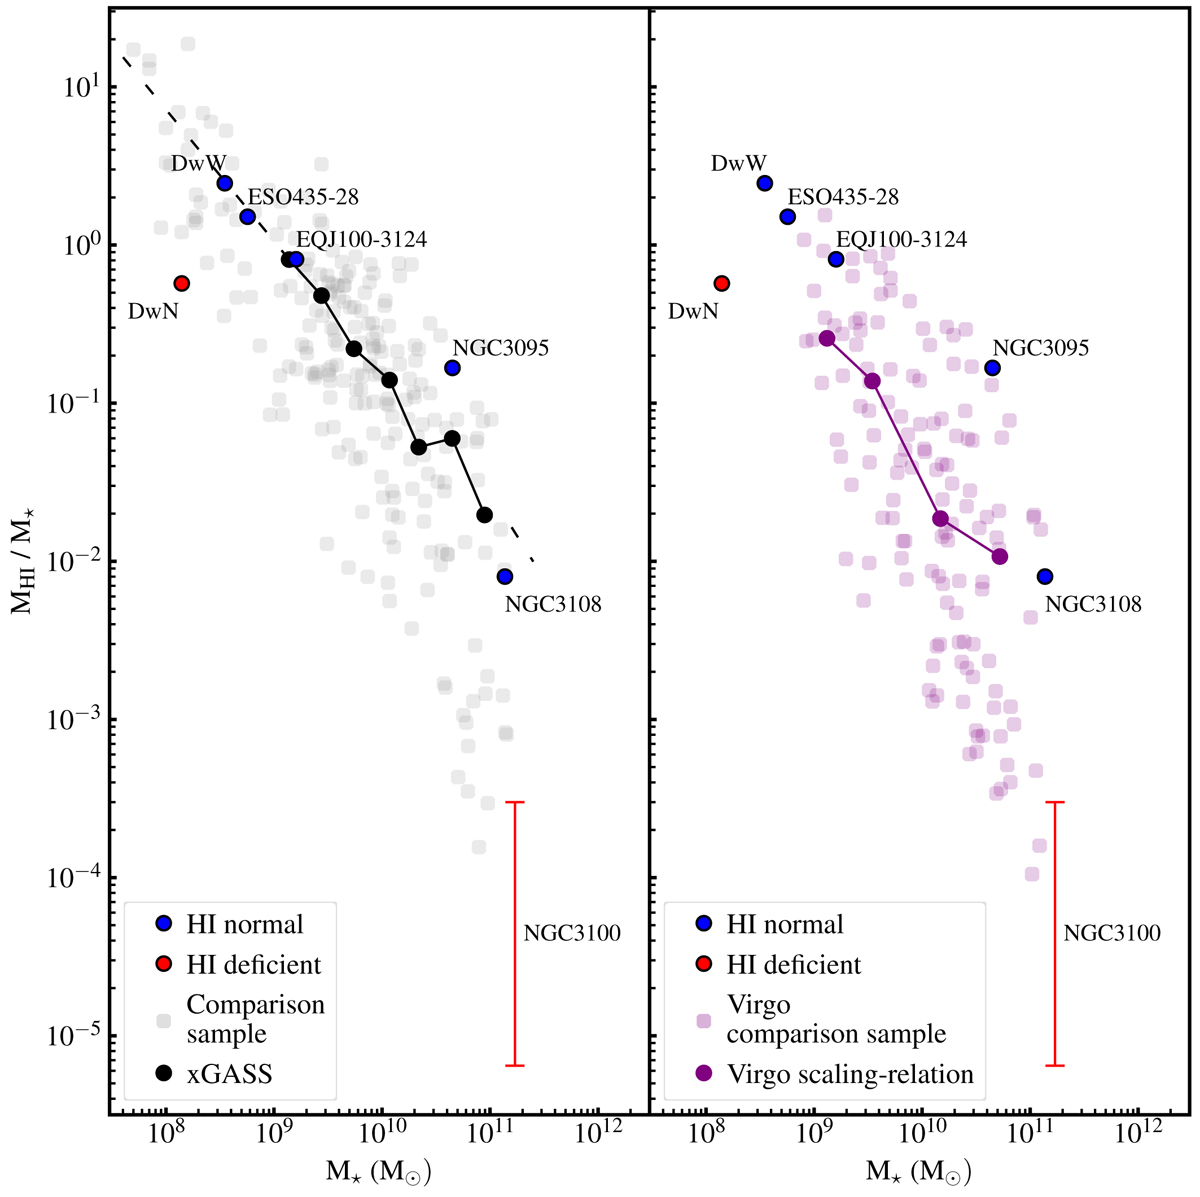
Fig. 6.
Download original image
H I vs. stellar mass content of the sources in the NGC 3100 group and of galaxies in different comparison samples. Left panel: H I fraction vs. the stellar mass of the galaxies in the NGC 3100 group (red + blue markers) compared with non-cluster galaxies from VSG+HRS (grey circles, Kreckel et al. 2012; Boselli et al. 2014). Red and blue colours show H I-deficient and normal galaxies, respectively. We show the xGASS scaling relation with a black solid line (Catinella et al. 2018). The black dashed line is the linear extrapolation of this trend for M⋆ < 1.4 × 10⁹ M⊙. Right panel: Similar to the left panel. Here we show the comparison between the H I mass fraction of the galaxies in the NGC 3100 group with that of Virgo cluster galaxies from HRS (light purple circles). Dark purple circles show the average scaling relation obtained from Virgo cluster galaxies (Cortese et al. 2016).
Current usage metrics show cumulative count of Article Views (full-text article views including HTML views, PDF and ePub downloads, according to the available data) and Abstracts Views on Vision4Press platform.
Data correspond to usage on the plateform after 2015. The current usage metrics is available 48-96 hours after online publication and is updated daily on week days.
Initial download of the metrics may take a while.