Fig. 8.
Download original image
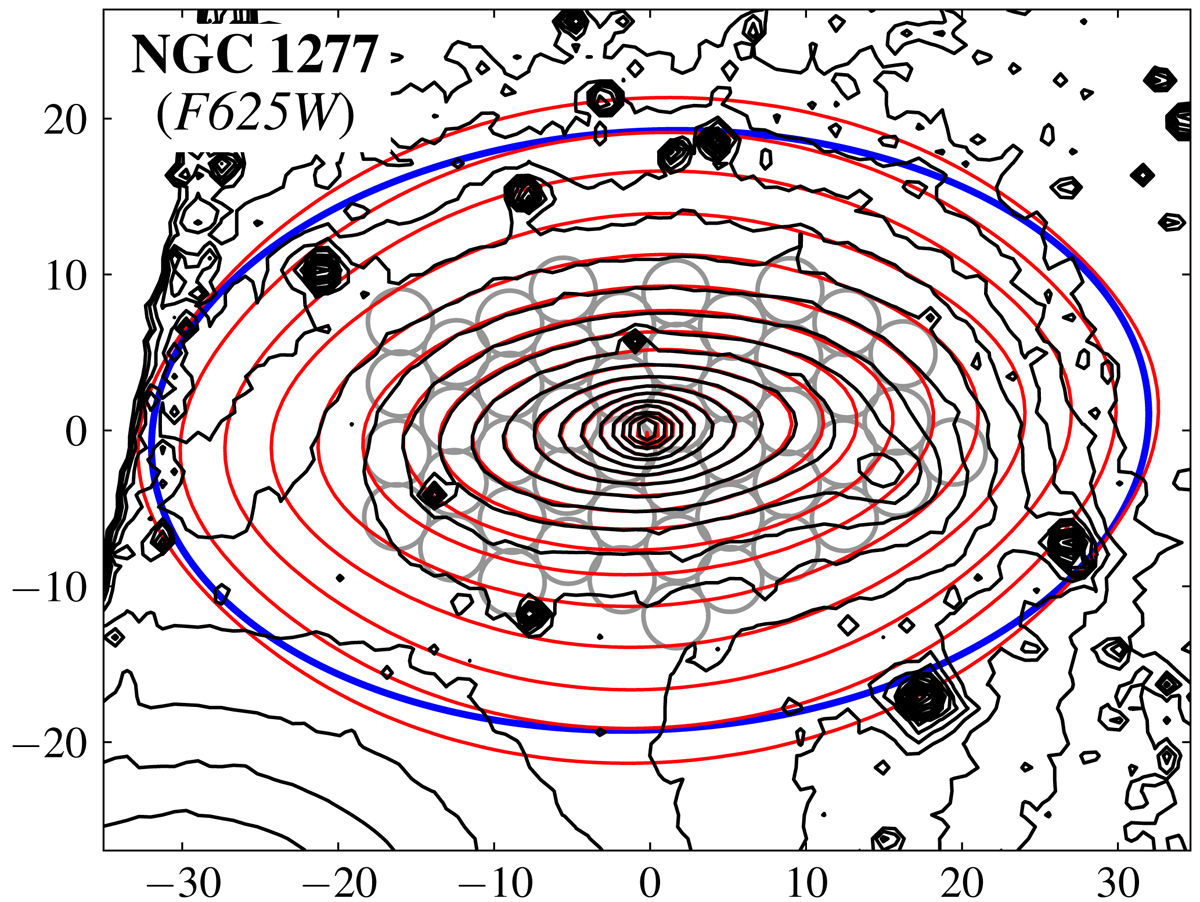
Isophote plot derived from the HST F625W image of NGC 1277 with 0.5 mag arcsec−2 intervals (black contours). The corresponding MGE model isophotes are indicated in red. The blue ellipse denotes the extent of the region that was used to produce the MGE models (an ellipse with a semi-major axis of 32″, an ellipticity of 0.6, and a ![]() ). The grey circles indicate the position of the fibres that were used for the dynamical analysis.
). The grey circles indicate the position of the fibres that were used for the dynamical analysis.
Current usage metrics show cumulative count of Article Views (full-text article views including HTML views, PDF and ePub downloads, according to the available data) and Abstracts Views on Vision4Press platform.
Data correspond to usage on the plateform after 2015. The current usage metrics is available 48-96 hours after online publication and is updated daily on week days.
Initial download of the metrics may take a while.