| Issue |
A&A
Volume 692, December 2024
|
|
|---|---|---|
| Article Number | A21 | |
| Number of page(s) | 11 | |
| Section | Extragalactic astronomy | |
| DOI | https://doi.org/10.1051/0004-6361/202450908 | |
| Published online | 29 November 2024 | |
Binary neutron star merger offsets from their host galaxies
GW 170817 as a case study
1
Department of Astrophysics/IMAPP, Radboud University, PO Box 9010 6500 GL Nijmegen, The Netherlands
2
Astrophysics sub-Department, Department of Physics, University of Oxford, Keble Road, Oxford OX1 3RH, UK
3
Astrophysics Research Centre, School of Mathematics and Physics, Queen’s University Belfast, Belfast BT7 1NN, UK
4
Department of Physics, University of Warwick, Coventry CV4 7AL, UK
5
European Space Agency (ESA), European Space Research and Technology Centre (ESTEC), Keplerlaan 1, 2201 AZ Noordwijk, The Netherlands
⋆ Corresponding author; This email address is being protected from spambots. You need JavaScript enabled to view it.
Received:
29
May
2024
Accepted:
21
October
2024
Abstract
Aims. The locations of binary neutron star (BNS) mergers within their host galaxies encode the systemic kicks that these systems received in the supernova aftermath. We investigate how the galactic potential and the systemic kicks shape the offset distribution of BNS mergers with a case study of GW 170817 and its host NGC 4993.
Methods. We derived dynamical constraints on the host potential from integral field spectroscopy with Jeans anisotropic modelling. We evolved the trajectories of synthetic BNSs from the BPASS code in the galactic potential, using two different kick prescriptions to investigate how the observed offsets might differentiate between these two possibilities. The simulation was repeated after swapping the host potential with that of a dwarf galaxy, to test the effect of the potential on the offsets.
Results. The location of GW 170817 is entirely consistent with our predictions, regardless of large or small kicks, because the strong potential of NGC 4993 is only diagnostic of very large kicks. In galaxies of similar or greater mass, large offsets can constrain large kicks, while small offsets do not provide much information. In an old dwarf galaxy, on the other hand, small offsets can constrain small kicks, while large offsets would prevent host association.
Key words: gravitational waves / stars: kinematics and dynamics / stars: neutron / galaxies: individual: NGC 4993
© The Authors 2024
 Open Access article, published by EDP Sciences, under the terms of the Creative Commons Attribution License (https://creativecommons.org/licenses/by/4.0), which permits unrestricted use, distribution, and reproduction in any medium, provided the original work is properly cited.
This article is published in open access under the Subscribe to Open model. This email address is being protected from spambots. You need JavaScript enabled to view it. to support open access publication.
1. Introduction
Mergers of binary neutron stars (BNSs) were proposed to be the origin of short-duration gamma-ray bursts (SGRBs, Eichler et al. 1989; Narayan et al. 1992; Kouveliotou et al. 1993) not long after the first BNS was discovered (Hulse & Taylor 1975). As of today, we have almost three decades of literature supporting BNS mergers being the main source of SGRBs through either direct or indirect evidence (see for a review Lee & Ramirez-Ruiz 2007; Nakar 2007; Berger 2014; Abbott et al. 2017a), although we also have evidence that SGRBs are not an unbiased sample, since it is unlikely that all BNS mergers produce an SGRB (Rastinejad et al. 2022; Troja et al. 2022; Sarin et al. 2022; Salafia et al. 2022; Levan et al. 2024; Yang et al. 2024) and that all SGRBs are produced by a BNS merger (Thompson & Duncan 1995; Qin et al. 1998; Levan et al. 2006; Metzger et al. 2008; Troja et al. 2008; Gompertz et al. 2020).
One key piece of evidence that links the two phenomena is the locations of SGRBs within their host galaxies. Indeed, the distributions of SGRB offsets from the centres of their hosts do not trace the stellar light, which is both consistent with the merger times and systemic kicks expected for BNSs, and effective in restricting alternative progenitors (Portegies Zwart & Yungelson 1998; Bloom et al. 1999; Fryer et al. 1999; Bloom et al. 2002; Perna & Belczynski 2002; Voss & Tauris 2003; Belczynski et al. 2006; Fong et al. 2010; Berger 2011; Fong & Berger 2013; Mandhai et al. 2022; Fong et al. 2022; Nugent et al. 2022; Gaspari et al. 2024). The study and modelling of observed SGRBs offsets has therefore been used to inform several aspects of BNS mergers and their stellar progenitors (Zemp et al. 2009; Berger 2010; Kelley et al. 2010; Church et al. 2011; Behroozi et al. 2014; Tunnicliffe et al. 2014; Abbott et al. 2017b; Zevin et al. 2020; Perna et al. 2022; O’Connor et al. 2022).
To date, GW 170817/GRB 170817A represents the most robust and well-studied case of a BNS merger (Abbott et al. 2017a; Margutti & Chornock 2021, and references therein), and its location together with the properties of the host galaxy NGC 4993 have been discussed in detail in several works (Blanchard et al. 2017; Abbott et al. 2017b; Im et al. 2017; Levan et al. 2017; Pan et al. 2017; Palmese et al. 2017; Artale et al. 2019; Ebrová et al. 2020; Perna et al. 2022; Kilpatrick et al. 2022; Stevance et al. 2023). In this work, we expand and improve the characterisation of both the location of GW 170817, and its host galaxy NGC 4993. We derive dynamical constraints on the potential of the host directly from integral field spectroscopy (IFS) with Jeans anisotropic modelling (JAM, Cappellari 2008, 2020), which allows for a better estimate of the potential than from scaling relations alone (c.f. Church et al. 2011; Abbott et al. 2017b; Zevin et al. 2020). We combine the galactic potential with a synthetic population of BNSs to model their trajectories within NGC 4993, and then compare the predicted merger locations with that of GW 170817. Our kinematic model is meant to complement the IFS-based analysis of host galaxies and BNS progenitors of Stevance et al. (2023), by providing further constraints on the BNS merger progenitors.
The paper is structured as follows. In Sect. 2, we briefly describe the data we use. In Sect. 3, we describe the JAM method to model the galactic kinematics, and the simulations of BNS trajectories within NGC 4993. In Sect. 4, we present and analyse the results, including a comparison with a dwarf galaxy, before we summarise and conclude in Sect. 5. Throughout the paper, magnitudes are reported in the AB system (Oke & Gunn 1982). We adopt a ΛCDM cosmology with H0 = 67.66 km s−1 Mpc−1, ΩΛ = 0.69, and Ωm = 0.31 (Planck Collaboration VI 2020).
2. Data
The main subject of this work is NGC 4993, the host galaxy of the BNS merger GW 170817 (Abbott et al. 2017a; Blanchard et al. 2017; Levan et al. 2017). NGC 4993 is a nearby S0 galaxy (de Vaucouleurs et al. 1991; Capaccioli et al. 2015) with a type-II shell system (Malin & Carter 1983; Blanchard et al. 2017; Levan et al. 2017; Palmese et al. 2017; Ebrová et al. 2020; Kilpatrick et al. 2022). Hjorth et al. (2017) place the galaxy at a luminosity distance of DL = 41.0 ± 3.1 Mpc by averaging the estimate from its Hubble-flow velocity with the estimate from the fundamental plane relation. This distance is consistent with the measures obtained from the GW signal by Abbott et al. (2017a), from the fundamental plane relation by Im et al. (2017), and from surface brightness fluctuations by Cantiello et al. (2018), and it implies a redshift corrected for proper motions of z = 0.0092 ± 0.0007. The optical counterpart of GW 170817 was localised at an angular offset of 10.315 ± 0.007″ from the galaxy centroid (Blanchard et al. 2017; Levan et al. 2017), which at this redshift is equal to a proper distance of 2.01 ± 0.15 kpc.
To model NGC 4993, we made use of both imaging and spectroscopy. For the photometry, we used observations obtained in the F606W filter with the camera WFC3/UVIS on board the Hubble Space Telescope (HST) by Program GO-14771 (PI Tanvir), reduced by Tanvir et al. (2017). For the spectroscopy, we used the observations obtained with the integral-field spectograph MUSE on the Very Large Telescope (VLT) by Program 099.D-0668 (PI Levan), reduced by Levan et al. (2017).
For comparison, we also modelled NGC 1396, a dwarf elliptical galaxy (Ferguson 1989; de Vaucouleurs et al. 1991) at a distance of 20.0 ± 1.4 Mpc in the Fornax cluster (Blakeslee et al. 2009). For the photometry, we used the observations in F606W obtained with the camera ACS/WFC on board HST by Program GO-10129 (PI Puzia), reduced by Puzia et al. (2014). For the spectroscopy, we used the observation obtained with MUSE at the VLT by Program 094.B-0895 (PI Lisker), reduced by Mentz et al. (2016).
3. Methods
3.1. Host galaxy modelling
3.1.1. Surface brightness
To model the surface brightness, Σ(x′,y′), we used the multi-Gaussian expansion (MGE) formalism (Emsellem et al. 1994; Cappellari 2002), in which Σ is expressed as a sum of N Gaussian functions,
![Mathematical equation: $$ \begin{aligned} \Sigma (x\prime ,{ y}\prime ) = \sum ^{N}_{n = 1}\frac{L_n}{2\pi \sigma _n^2q\prime _n}\exp \left[ -\frac{1}{2\sigma _n^2} \left( {x\prime }^2 +\frac{{{ y}\prime }^2}{{q_n\prime }^2} \right) \right] ,\end{aligned} $$](/articles/aa/full_html/2024/12/aa50908-24/aa50908-24-eq1.gif) (1)
(1)
with Ln being the total luminosity of the n-th component, σn its dispersion along the x′ axis, and q′n its observed axial ratio. The sky co-ordinates (x′,y′,z′) were defined such that the x′ axis is aligned with the galaxy photometric major axis and the z′ axis coincides with the line of sight (LoS).
We fitted the MGE model to the HST photometry in F606W using the algorithm by Cappellari (2002) and implemented in MgeFit1. In particular, we used the routine mge_fit_sectors_regularized, which also implements the prescription from Scott et al. (2013) to avoid fitting bars and non-axisymmetric features. We used the routine find_galaxy to get an initial guess for the semi-major axis position angle (PA), galaxy centroid, and ellipticity. The fit accounts for the point spread function of the image, which for the HST observations we assume to be a Gaussian with a deviation equal to 1 px, or equivalently a full width at half maximum of ∼2.4 px. The fitted MGE coefficients are reported in Table 1. The peak surface intensities, In, in units of [L⊙ pc−2] were obtained using the appropriate zero points for each observation2 and adopting an absolute magnitude for the Sun of M⊙ = 4.73 mag (Willmer 2018). The intensities were corrected for Galactic extinction, and for the surface brightness dimming due to the cosmological redshift. For the Galactic extinction, we adopted AF606W = 0.307 mag for NGC 4993 and AF606W = 0.035 mag for NGC 1396, both computed from the Galactic dust reddening measured by Schlafly & Finkbeiner (2011) assuming a visual extinction to reddening ratio of RV = 3.1 and the extinction law of Fitzpatrick (1999). To correct for the redshift dimming, we multiplied the intensities by (1 + z)3, which takes into account the (1 + z)4 factor from the bolometric dimming and the (1 + z)−1 factor, since the intensities are per unit frequency and not bolometric.
Coefficients of the MGE models fitted to NGC 4993 and NGC 1396.
The choice of co-ordinates made in Eq. (1) implicitly assumes that all Gaussians have the same axes. The MGE formalism can be recast in a more general form in which the Gaussians have all different PAs with respect to each other (Monnet et al. 1992; Cappellari 2002), but we do not find this necessary as our model already provides an acceptable fit. Under the assumption that the intrinsic shape is axisymmetric (which would not be allowed if different PAs were required for a good fit), the MGE model can be deprojected into the 3D stellar luminosity density with the simple analytical expression
![Mathematical equation: $$ \begin{aligned} \upsilon _\star (R,z) = \sum ^{N}_{n = 1}\frac{L_n}{\left(2\pi \sigma ^2_n\right)^{3/2}q_n}\exp \left[ -\frac{1}{2\sigma _n^2} \left( R^2 +\frac{z^2}{q_n^2} \right) \right] ,\end{aligned} $$](/articles/aa/full_html/2024/12/aa50908-24/aa50908-24-eq2.gif) (2)
(2)
where qn are the intrinsic axial ratios,
 (3)
(3)
and i is the galaxy inclination (i = 90° being edge-on). The sky co-ordinates (x′,y′,z′) are related to the cylindrical co-ordinates (R, z) by
 (4)
(4)
with R2 = x2 + y2 and the z axis being the symmetry axis of the galaxy. Although the axisymmetric MGE model provides a unique deprojection for a given inclination, one should bear in mind that the surface brightness deprojection is in general not unique (Rybicki 1987; Franx 1988), and thus a specific choice of deprojection can introduce systematic errors in the inferred dynamical properties (e.g. Lablanche et al. 2012).
3.1.2. Stellar kinematics and galactic potential
To model the stellar kinematics, we used the Jeans equations for the velocity distribution moments of a stellar system in steady state (Jeans 1922) through the JAM formalism (Cappellari 2008, 2020). We employed in particular the axisymmetric anisotropic Jeans equations derived by Cappellari (2008) that describe the second-order moments of the velocities in cylindrical co-ordinates under the assumptions that the stellar system is axisymmetric, the velocity ellipsoid is aligned with the cylindrical frame, and the velocity anisotropy is constant.
Under these assumptions, the Jeans equations read
 (5)
(5)
 (6)
(6)
where Φ is the galactic gravitational potential, υ is the density distribution of the kinematic tracer, and b parametrise the classical anisotropy parameter,
 (7)
(7)
so that  . Here, the second-order velocity moments are defined by
 (8)
(8)
with f being the distribution function such that f(x, v) d3x d3v is the probability that a star is found in a given infinitesimal phase-space volume. With the boundary condition  for z → ∞, Eqs. (5) and (6) have solutions
 (9)
(9)
![Mathematical equation: $$ \begin{aligned} \upsilon \overline{v^2_\phi }&= b\left[ R\frac{\partial (\upsilon \overline{v^2_z})}{\partial R} +\upsilon \overline{v^2_z} \right] +R\upsilon \frac{\partial \Phi }{\partial R}\end{aligned} $$](/articles/aa/full_html/2024/12/aa50908-24/aa50908-24-eq12.gif) (10)
(10)
 (11)
(11)
which can be integrated along the LoS to get the projected second velocity moment, 
 (12)
(12)
where cos ϕ = x/R. The second moment,  , approximates the observed root-mean-square (rms) velocity,
  , where V and σ are the observed mean stellar velocity and velocity dispersion, respectively, and thus it can be compared to the observed galactic kinematics to infer the free parameters of the JAM model.
To parametrise the tracer density, υ, and the galactic potential, Φ, we employed the MGE formalism, under the assumption that the kinematic and photometric axes coincide. As the tracer density, υ, we used the stellar luminosity density, υ⋆, which was deprojected from the MGE model of the stellar surface brightness (Eq. (2)) and had the inclination, i, as a free parameter. For the galactic potential, Φ, we first parametrised the total density, ρ, as the sum of two sets of Gaussians,
 (13)
(13)
and then computed Φ from ρ using the analytical formula for a density distribution constant on concentric homothetic ellipsoids (Binney & Tremaine 2008, Sect. 2.5.3) given by Emsellem et al. (1994, see also Eqs. (16) and (17) of Cappellari 2008). In the first term of Eq. (13), we again have the stellar luminosity density, υ⋆, this time multiplied by the stellar mass-to-light ratio, M⋆/L, to give the stellar mass density. The second term, on the other hand, is the mass density of a spherical dark matter (DM) halo, obtained by fitting a MGE model to the Navarro–Frenk–White (NFW) profile (Navarro et al. 1997),
 (14)
(14)
with the routine mge_fit_1d from MgeFit, and deprojecting it as we did for the surface brightness with Eq. (2). The NFW profile has two parameters – namely, the normalisation factor, ρ0, and the scale radius, rs – however, only ρ0 can be constrained with the stellar kinematics as the typical rs sits well outside the stellar light (see Sect. 4.1). Therefore, we fixed rs using scaling relations and used JAM to infer ρ0, which we parametrised with the fraction of DM within the half-light radius,  . The scale radius, rs, was estimated by combining the stellar-to-halo mass relation of Moster et al. (2013) with the mass-concentration relation of Dutton & Macciò (2014). As an initial estimate, we used 31.0 kpc for NGC 4993 and 7.8 kpc for NGC 1396, computed assuming that the stellar mass of NGC 4993 is
  (Blanchard et al. 2017) and that of NGC 1396 is
  (Mentz et al. 2016).
The JAM model described above was implemented by Cappellari (2008) in JamPy3. We used the routine jam_axi_proj to model  , which was then fitted to the Vrms inferred from the MUSE observations. The posterior distributions of
  , and M⋆/L were inferred using the adaptive Metropolis et al. (1953) algorithm of Haario et al. (2001), as it is implemented by Cappellari et al. (2013) in AdaMet4. The observed kinematics were computed from the MUSE IFS with Starlight (Cid Fernandes et al. 2005), following the method detailed in Lyman et al. (2018). As per the Starlight manual, we computed the velocity dispersion, σ, with σ2 = vd2 − σinst2 + σbase2, where vd is the dispersion value inferred by Starlight, σinst is the spectral resolution of the observations, and σbase is the resolution of the synthetic spectra. We assume that σinst = 45 km s−1 as MUSE has a resolving power of R ≈ 2800 at 7000 Å (corresponding to a resolution of 2.5 Å), and σbase = 55 km s−1 as we fitted the spectra from Bruzual & Charlot (2003) that have a resolution of 3 Å.
3.2. Stellar population synthesis and supernova kicks
The stellar populations that we have used in this work are from the Binary Population And Spectral Synthesis code (BPASSv2.2; Eldridge et al. 2017; Stanway & Eldridge 2018; Stevance et al. 2020), which uses a custom version of the Cambridge STARS code to perform the stellar evolution. We specifically employed the models of Stevance et al. (2023), characterised by a Kroupa initial mass function (Kroupa 2001) and initial binary parameter distributions (mass ratios and periods) from Moe & Di Stefano (2017). We refer the reader to Eldridge et al. (2019) for an in-depth discussion on delay times and merger rates, and to Stevance et al. (2023) for the properties of GW 170817 progenitors implied by the BPASS models.
As is described in Stevance et al. (2023), we can include the effects of supernova (SN) kicks a posteriori without recalculating a new grid of stellar models, using the BPASS-TUI code. The post-SN eccentricity, semi-major axis, and systemic velocity were computed using the formalism of Tauris & Takens (1998), which takes into account the pre-SN orbital parameters, the mass ejected in the SN, and the natal kick. We assumed the natal kick directions to be isotropically distributed. The merger time was computed using the approximation of Mandel (2021).
A number of kick prescriptions have been used when modelling the effects of SN explosions, either based on observations of pulsar velocities (e.g. Hobbs et al. 2005; Verbunt et al. 2017; Igoshev 2020) or theoretically motivated by the physics of the explosion (e.g. Bray & Eldridge 2016, 2018; Giacobbo & Mapelli 2020; Mandel & Müller 2020). In the case of the present work, it would be computationally prohibitive to attempt to perform our analysis using all the kick prescriptions that have been proposed in the literature. Indeed, our synthetic population counts 446 444 BNS merger precursors that must then each be evolved through galactic potentials with randomised initial positions to recover final offsets.
Consequently, we have limited our choice of kick prescription to two ‘extreme’ cases that allow us to explore the effects of kicks on our final offsets. Firstly, we used the single-peaked Maxwellian from Hobbs et al. (2005), which is known to be an overestimate. In follow-up models, we then set all the kicks after the second SN to have  , which is about the kick velocity typically used when considering electron-capture or ultra-stripped SNe (e.g. Podsiadlowski et al. 2004; Kruckow et al. 2018; Vigna-Gómez et al. 2018; Giacobbo & Mapelli 2018). Although these small kicks are consistent with the properties of observed Galactic BNSs (e.g. Beniamini & Piran 2016; Tauris et al. 2017, and references therein), this is not a physical solution as the vast majority of SNe in these models do not fit electron-capture or ultra-stripped conditions, but it serves as a deliberate underestimate to see how this affects the final offsets.
In Fig. 3, we show a comparison between the systemic kicks from the second SN, and the escape velocities at the location of the second SN. For reference, the circular velocity at these locations is on average ∼4 − 5 times lower than the escape velocity.
3.3. Galactic trajectories and merger locations of binary neutron stars
To model the BNS merger locations, we seeded the BPASS population in the galactic potential inferred with JAM, and simulated the BNS trajectories with galpy5 (Bovy 2015). The potential was built summing the NFW potential with the stellar potential, the former obtained using the routine potential.NFWPotential and the latter obtained approximating the MGE model (i.e. the first term in Eq. (13)) with the self-consistent field method of Hernquist & Ostriker (1992) using the routine potential.SCFPotential. We assume that the potential remains constant over time, which is a reasonable assumption at least for the stellar component of NGC 4993, since its star formation ceased around 9 Gyr ago (Blanchard et al. 2017; Levan et al. 2017; Stevance et al. 2023).
To seed the binaries, we computed the stellar mass enclosed in spherical shells by integrating radially Eq. (2) times M⋆/L, and then seeded the binaries at random locations using the enclosed mass as a proxy. The binaries were initialised on circular orbits and immediately kicked with the systemic kicks from the first SN (hereafter SN1) given by BPASS-TUI. The galactic trajectories were integrated up to the time of the second SN (hereafter SN2) when the binaries were kicked again, and finally integrated up to the GW-driven merger to get the merger locations. We simulated one trajectory per BNS model for a total of 446 444 trajectories, randomly sampling for each binary a different initial location and a different orientation for each systemic kick.
4. Results
4.1. NGC 4993 properties inferred from stellar kinematics
The MGE fit to the surface brightness of NGC 4993 is reported in Table 1. The fit has an rms error of ∼3 percent, and has been corrected for Galactic extinction and redshift dimming. The MGE total luminosity is  , equivalent to an absolute magnitude of M606 = −20.69, while the half-light radius, rhalf, is 13.51 arcsec, or 2.64 kpc at the galaxy redshift.
The JAM model is shown in Fig. 1, while the posterior distributions of its parameters are shown in Fig. 2. From the kinematics, we infer an inclination,  deg, an anisotropy parameter, βz = −0.07 ± 0.02, a fraction of DM,
  , and a stellar mass-to-light ratio of
  . From the total luminosity and the mass-to-light ratio, we infer that NGC 4993 has a stellar mass of
  .
.
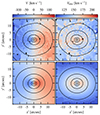 |
Fig. 1. Projected kinematics of NGC 4993, inferred from MUSE data (top row) and predicted by JAM (bottom row). The left column shows the mean stellar velocity, V, along the LoS, while the right column shows the rms velocity, Vrms, along the LoS. The solid black lines represent the observed isophotes (top row) and the MGE fit (bottom row). The x′ axis is aligned with the galaxy photometric major axis. |
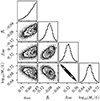 |
Fig. 2. Posterior probability distributions of the JAM parameters inferred for NGC 4993 with AdaMet; namely, the minimum intrinsic axial ratio, qmin, the anisotropy parameter, βz, the fraction of DM within a half-light radius, fDM, and the logarithm of the stellar mass-to-light ratio, log10(M⋆/L). The first parameter is defined as qmin = min({qn}n = 1, 2, …, N) and it parametrises the inclination, i, through Eq. (3). The distributions are represented marginalised over one and two dimensions (histograms and contours, respectively). The contours levels enclose the 12, 40, 68, and 86 percentiles (equivalent to the 0.5, 1, 1.5, and 2σ envelopes in 2D). |
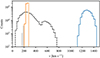 |
Fig. 3. Systemic kicks from SN2 and escape velocities in our models. The dashed black line is the systemic kicks distribution predicted by BPASS-TUI. The shaded grey areas are the systems that received a natal kick vk of 30 km s−1. The solid coloured lines are the escape velocities at the locations of SN2, for both galaxies. |
For the NFW profile, we inferred the scale radius,  kpc, from the stellar mass, and the normalisation factor,
  , from Mhalf and fDM. With these parameters, the DM halo has a mass of
  . All the errors quoted above were obtained propagating the uncertainties on the JAM parameters and the MGE rms error. We have not propagated the uncertainty on the redshift, since its contribution is negligible.
We compared these dynamical estimates to the literature values. Abbott et al. (2017b) uses  and
and  , both of which were obtained from scaling relations. Im et al. (2017) uses
  , Palmese et al. (2017) uses
  , Blanchard et al. (2017) uses
  , and Levan et al. (2017) uses
  , all of which were obtained from fitting the spectra or the spectral energy distribution. Ebrová et al. (2020) uses
  , from scaling relations. Palmese et al. (2017) also gives M⋆/L = 5.23 ± 0.15 in the r band. Overall, our stellar mass estimate sits well within the spread of mass estimates from the literature, while our DM halo mass is more than 1σ greater than the estimates of Abbott et al. (2017b) and Ebrová et al. (2020). We note that a difference in the dynamical mass of a factor, f, implies a change in the galaxy circular and escape velocities by a factor of
  .
.
Since we have integral-field kinematics, we also computed the luminosity-weighted estimate for the projected specific angular momentum of Emsellem et al. (2007)
 (15)
(15)
and the luminosity-weighted projected ellipticity,
 (16)
(16)
where Fn, Rn, Vn, σn, xn, yn are, respectively, the bolometric flux, projected radius, mean stellar velocity, velocity dispersion, and Cartesian co-ordinates along the photometric axes of the n-th Voronoi bin. The values within a 1Rhalf aperture for NGC 4993 are λR(Rhalf) = 0.35 and ε(Rhalf) = 0.07; thus, the galaxy is a relatively round fast rotator, which is consistent with it being an S0 seen almost face-on (Emsellem et al. 2011; Cappellari 2016; Graham et al. 2018). This value of λR, however, is relatively high compared to that of other early-type galaxies (ETGs) with shell systems. Yoon et al. (2024) analysed a sample of nearby ETGs from the MaNGA survey, finding that half of ETGs with shells are classified as slow rotators (i.e. have λR ≲ 0.1 − 0.15). This fraction is three times the fraction of slow rotators in ETGs with no tidal features, and twice the fraction in ETGs with other tidal features, such as tails and streams. We also note that ETGs with dust lanes have higher λR than ETGs without dust lanes (Yoon et al. 2022), and that NGC 4993 shows clear although not prominent dust lanes in its very inner regions.
4.2. Locations of supernovae and binary neutron star mergers in NGC 4993
To report and analyse the location of transients in and around their host galaxies, we made use of two observables: the projected offset and the host-normalised offset. Defining the spherical offsets as the spherical radius of the transient location in the galactocentric frame, the projected offset is then the spherical offset projected on the sky plane, while the normalised offset is the projected offset normalised by the projected half-light radius of the host galaxy.
In Fig. 4, we show the projected and normalised offsets of all the SNe in NGC 4993 predicted by our model. Since in our models SN1 occurs while the binary is still on the initial circular orbit, the locations of SN1 coincide with the light radial profile except for projection effects. The offset distributions of SN1 and SN2 almost overlap each other, indicating that the systemic kicks from SN1 are not strong enough to dislodge the binary from the SN1 location by the time SN2 happens. In Fig. 4, we also show the locations of observed core-collapse SNe for comparison, using the projected offsets from the ATLAS survey (volumetrically complete to 100 Mpc, Srivastav et al., in prep.) and the normalised offsets of Kelly & Kirshner (2012). We emphasise that here we are not looking for a perfect match to observations: first of all, our simulations only look at a sub-sample of SN progenitors; secondly, we are looking at the effects of a specific galactic potential rather than a range of galaxies like in the observations. We indeed find a good match between models and observations for projected offsets, although the match is not as good for normalised offsets where we account for the size and light distribution of the host galaxy.
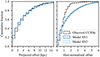 |
Fig. 4. Comparison between observed and modelled locations of core-collapse supernovae (CCSNe). Left: CCSN offsets from the ATLAS volumetric survey (Srivastav et al. 2022; Srivastav et al., in prep.) compared to those seen in our models (note that these are exclusively binary systems that can lead to BNS mergers, not an exhaustive theoretical population of CCSNe). Right: same as in the left panel, with the observed normalised offsets of CCSNe from Kelly & Kirshner (2012). |
In the left panel of Fig. 5, we show the projected offsets of BNS merger in NGC 4993 predicted by our model. The fraction of BNS mergers predicted within the observed offset of GW 170817 is 24.4 percent. The mergers with a delay time compatible with that of GW 170817, namely between 6 and 13 Gyr (Levan et al. 2017; Blanchard et al. 2017; Stevance et al. 2023), have a median projected offset of 4.8
 kpc (here we are reporting the 16th–84th percentiles as uncertainties), which is compatible within 1σ with the observed offset. This is only twice the offset at which they formed, as the median projected offset of SN1 is 2.7
 kpc and the median normalised offset of BNS merger is indeed 1.9
 (SN1 traces stellar light in our models).
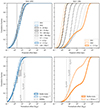 |
Fig. 5. Location of BNS mergers predicted by our models. Top: projected offsets of BNS mergers in physical units. The dashed and dotted lines indicate the locations of SN1 and SN2, respectively, while the remaining lines represent the BNS merger offsets divided in log-spaced time bins. The shaded vertical band indicates the observed projected offset of GW 170817. Bottom: host-normalised offsets of BNS mergers with delay times between 5 and 13 Gyr (thick solid lines). This time bin matches the age of possible GW 170817 progenitors. The thin lines show the distribution of merger offsets produced by BNSs where the neutron stars received a small natal kick, vk, of 30 km s−1 at SN2. The dashed line represents the distribution of normalised offsets for the SGRBs in the BRIGHT catalogue (Fong et al. 2022; Nugent et al. 2022) with a host galaxy more massive than NGC 4993 (the shaded region indicates the offsets’ uncertainties). The vertical lines labelled with Pch identify the normalised offsets at which the probability of chance alignment, Pch (Bloom et al. 2002), with each galaxy is either 1, 5, or 10%. |
We note that the offset distribution does not evolve with respect to the delay times, as was also found by Abbott et al. (2017b) (see the top panels of their Fig. 5). The absence of time evolution together with the small displacement between formation and merger reflects the fact that all BNSs remain bound to the host (see Fig. 3 for a comparison between systemic kicks and escape velocities).
4.3. Comparison to the locations of BNS mergers in the potential of a dwarf galaxy
To understand the impact of the potential on the predicted merger offsets, we repeated the simulation, swapping the potential and light distribution of NGC 4993 with that of the dwarf galaxy NGC 1396. In this simulation, we seeded the BNSs, following the light distribution of NGC 1396 and using its circular velocity. The merger offsets predicted for NGC 1396 are shown in the central panel of Fig. 5.
For the dwarf galaxy, we find that 37% of all BNS remain bound to the galaxy after the kicks, unlike for NGC 4993 where all systems remained bound. When considering only the BNS mergers compatible with the delay time of GW 170817, the bound BNSs account for 42% of the mergers and merge at a median projected offset of 14.9 kpc, or at a median normalised offset of 18.6
 (reporting again the 16th-84th percentiles as uncertainties). The unbound systems instead merge at a median projected offset of 1777.4
 kpc, or at a median normalised offset of 2221.7
 . Both distributions of offsets evolve with time (see Fig. 5), with the bound systems eventually settling on a certain distribution, and the merger offsets of unbound increasing monotonically with time.
In our models, the systemic kick from SN1 is  km s−1 (median value with 16th–84th percentiles as uncertainties), which is negligible compared to the escape velocity of NGC 4993 and only a fraction of the escape velocity of NGC 1396 (see Fig. 3). Therefore, we expect virtually all BNSs progenitors to remain bound to the host after SN1. When multiplying the kicks by the time between SN1 and SN2, we obtain a distance of
  kpc (median value with 16th–84th percentiles as uncertainties). These distances are larger than the offset between SN1 and SN2 in NGC 4993 (see Fig. 5), and comparable but still greater than those in NGC 1396. This again points towards the fact the BNSs do not get unbound upon SN1, and hence that we cannot estimate the offset between SN1 and SN2 by simply multiplying velocity and time of flight, although we notice that in a shallower potential the orbits are much more perturbed.
In the right panel of Fig. 5, we compare the prediction for NGC 4993 to those for the dwarf galaxy. The predicted BNS mergers in NGC 4993 have normalised offsets that are comparable to those of the observed SGRBs with hosts of a stellar mass greater than or equal to NGC 4993 in the BRIGHT catalogue (Fong et al. 2022; Nugent et al. 2022). In the dwarf, on the other hand, bound systems merge at normalised offsets that are ∼1 dex greater than in NGC 4993, and up to ∼3 dex when considering unbound systems. For such high offsets, the probability of chance alignment, Pch (Bloom et al. 2002), of the dwarf is always 1 (see Fig. 5, assuming both the galaxy and the merger electro-magnetic counterpart are detectable), and therefore it poses a bias against identifying the dwarf as the host. This would not be true for bright hosts like NGC 4993, since the association by Pch is more robust even for the upper tail of their offset distribution (Berger 2010; Tunnicliffe et al. 2014, also Fig. 5), whereas the Pch of faint hosts would be small only if both the offset and its error region were small (e.g. Levan et al. 2007; Eftekhari & Berger 2017). In Fig. 5, we show for reference the Pch from Bloom et al. (2002) for both galaxies, computed assuming an apparent magnitude of R = 11.9 for NGC 4993 (Lauberts & Valentijn 1989) and R = 14.2 for NGC 1396 (obtained from the g′r′i′ magnitudes of Venhola et al. 2018 using the photometric transformations of Jester et al. 2005). We also note that the fraction of bound to unbound systems depends on both the systemic kicks and the choice of potential, as is shown in the right panel of Fig. 5.
4.4. Merger offsets versus systemic kicks and delay times
In Fig. 6, we show the distribution of BNS mergers on the offset versus delay time plane, as a function of the potential and the systemic kick from SN2. For NGC 4993 (left panels in Fig. 6), the mergers are distributed on a horizontal strip in the plane, with the 16-50-84 percentiles of offsets being constant across all delay times beyond ∼100 Myr. This reflects the lack of time evolution in the offset distribution (see Sect. 4.2). The offset range, however, shows a dependence on the systemic kick, with the offset distribution shifting toward larger values for increasing kick bins (Fig. 6). Therefore, while the small offset of GW 170817 provided a robust host association via Pch, it also leaves unconstrained both the systemic kick and the delay time, as it sits within the bulk population independently of the range of systemic kicks or delay times. The largest offsets instead can only be reached with the highest kicks (see Fig. 6) and can therefore be used to probe the upper tail of the kick distribution, for instance through the energy argument of Bloom et al. (2002), since these merging systems are bound. Previous works have already noted that the small offset of GW 170817 does not provide a strong constraint on the systemic kick (Blanchard et al. 2017; Levan et al. 2017; Pan et al. 2017; Andreoni et al. 2017). This is clearly shown in Fig. 5 of Abbott et al. (2017b), where we see that the inferred posteriors are similar to the priors from the synthetic population given the observed offset (middle panels), and that they would start to probe higher natal kicks and progenitor masses only if the offset gets close to 100 kpc (bottom panels). A similar result is found by Zevin et al. (2020) when modelling the large offsets of GRB 070809 and 090515, namely that large merger offsets can indeed push the constraint on the systemic kick towards higher values, and thus probe specific progenitors (see their Figs. 5 and 6).
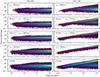 |
Fig. 6. Histograms of the BNS mergers in the projected offset vs delay time plane. The systemic kicks from SN2 have approximately 200, 270, and 360 km s−1 as 1st, 2nd, and 3rd quartiles; thus, each panel in the first four rows contains around 25% of the mergers. The last row shows the whole sample. The two columns separate the results for NGC 4993 and for NGC 1396. The histograms are not normalised; hence, they show counts and not densities. The solid red lines represent the median offset, while the dotted red lines indicate the 16th–84th percentiles, both as a function of the delay time. |
In the case of the dwarf galaxy (right panels in Fig. 6), the BNS mergers split into two branches: one made by bound systems and another by unbound systems. The mergers of bound systems behave like those in NGC 4993; namely, forming a horizontal strip in the plane with little to no time evolution beyond a few 100 million years. The mergers of unbound systems instead form a diagonal strip, with a slope around unity for the highest kicks that suggests a linear relation between offsets and delay times. In Fig. 6, we see that the horizontal branch dominates for systemic kicks below 200 km−1, while it gradually gives way to the diagonal sequence as the kick magnitude increases.
In the dwarf galaxy, the merger offsets of unbound systems quickly become too large to secure a host association by Pch (see right panel of Fig. 5), while those of bound systems can remain small enough to secure an association (see e.g. Nugent et al. 2024 for a sample of dwarf hosts associated with Pch). For these smaller offsets, we can distinguish two extreme situations. If the delay time is short, we find BNSs merging at small offsets regardless of the systemic kick, and thus the offset alone is not effective at constraining the kick (see Fig. 6, e.g. at delay times below a few 100 million years). This might be the case in a young or star-forming host, where we expect to observe mergers with the shortest delay times, and therefore where it might be difficult to distinguish whether a small merger offset is due to a systemic kick below the escape velocity, or a short delay time. However, if the delay time is large then a small merger offset is only compatible with a bound system, since mergers of unbound systems would be too far out for association. This is shown in Fig. 6, where at delay times above, for example, a few 100 million years, we find BNSs merging at small offsets only if the systemic kicks are about or below the escape velocity. Therefore, if the host is an old or quiescent galaxy, where we expect to be probing the upper tail of the delay time distribution, then a small merger offset could provide a systemic kick estimate given the typical escape velocity (that should account also for the progenitors’ locations and velocities within the potential).
A caveat of our method is that we evolve BNS trajectories in a static galactic potential. Galaxies are known to experience mass and size growth over cosmic time (e.g. van der Wel et al. 2014), and although the role of galaxy mergers in the growth of the stellar components seems dominant only for the most massive galaxies (e.g. Rodriguez-Gomez et al. 2015, 2016), the effects of galaxy evolution on the galaxy structure and kinematics is still an open topic of research (Conselice 2014; Cappellari 2016). A few works have already investigated the effects on the merger distribution of compact object binaries. Zemp et al. (2009) found that in an environment with a higher galaxy density such as a cluster, compact binaries do not reach offsets as high as in an isolated field galaxy due to the deeper potential, although the mixing between neighboring populations leads to a greater chance of misidentifying the true host. This effect is enhanced by large kicks (Kelley et al. 2010) and is pronounced for compact objects mergers happening in the local Universe (Wiggins et al. 2018), while mergers at z = 2 − 3.5 still trace the progenitor population.
5. Conclusions
We have discussed in detail the offset of GW 170817 with respect to its host galaxy NGC 4993, and the constraints this puts on the kinematics of merging BNSs. The stellar kinematics of NGC 4993 was modelled from IFS with JAM (JAM, Cappellari 2008) in order to constrain the galactic potential. A synthetic population of BNSs was simulated with BPASS-TUI (Stevance et al. 2023) and seeded within NGC 4993’s potential. The BNS galactic trajectories were computed with galpy (Bovy 2015) and their merger offsets were studied. We repeated the orbit simulation after switching the potential of NGC 4993 with that of a dwarf galaxy, to understand the different impacts of galactic potentials and systemic kicks in shaping the distribution of BNS merger offsets. We summarise our conclusions:
-
We infer that NGC 4993 has a dynamical stellar mass of
 , a stellar mass-to-light ratio of
  , and a DM halo mass of
  , which is consistent with previous estimates obtained from the galaxy spectrum and magnitudes (e.g. Abbott et al. 2017b; Palmese et al. 2017; Ebrová et al. 2020, and references therein). From the kinematics, we also determined that the galaxy is a quite round fast rotator, likely seen face-on. We provide a model for the surface brightness and the galactic potential in Sect. 4.1.
 -
Virtually all of the BNSs in our model remain bound to NGC 4993 after receiving two systemics kicks, even assuming that all natal kicks are drawn from the Hobbs et al. (2005) distribution. The offset distribution of BNS mergers in NGC 4993 shows no time evolution and only a modest displacement between the first SN and the merger (see Fig. 5, left panel). The merger offset distribution is consistent with the locations of SGRBs in hosts with a stellar mass equal to or greater than NGC 4993 (see Fig. 5, right panel).
-
The observed offset of GW 170817 is consistent with our predictions regardless of large or small kicks, because the strong potential is only diagnostic of very large kicks (see Figs. 5 and 6). Small offsets are not very constraining, whereas the largest can only be reached with the highest kicks, restricting the range of progenitors (as seen by Abbott et al. 2017b; Zevin et al. 2020).
-
For comparison, we evolved the BNS trajectories in the dwarf galaxy NCG 1396. Only around half of the systems remain bound to this host, merging at offsets ∼1 dex larger than those in NGC 4993. Of the bound systems, fewer than half of mergers result in a probability of chance alignment of Pch < 0.05. The remaining unbound systems merge at offsets that correlate with the delay time and have Pch ∼ 1 (Fig. 5, right panel). We find that for delay times above ∼1 Gyr, the small merger offsets of bound BNSs can still lead to association by Pch, and would effectively constrain the second kick to be below the escape velocity at the time of the SN. We find the fraction of bound systems to be determined by the kick distribution.
The method presented in this paper is complementary to the end-to-end analysis of Stevance et al. (2023), which gives priors for the progenitor BNS based on the IFS of the host. A possible follow-up work is its application to a sample of SGRBs.
Acknowledgments
We are grateful to the ATLAS team for early access of the Transient Volumetric Survey. We thank Michele Cappellari for the assistance given in the use of jampy. NG acknowledges studentship support from the Dutch Research Council (NWO) under the project number 680.92.18.02. HFS is supported by the Eric and Wendy Schmidt AI in Science Fellowship. AJL was supported by the European Research Council (ERC) under the European Union’s Horizon 2020 research and innovation programme (grant agreement No. 725246). AAC acknowledges support from the European Space Agency (ESA) as an ESA Research Fellow. JDL acknowledges support from a UK Research and Innovation Fellowship (MR/T020784/1).
References
- Abbott, B. P., Abbott, R., Abbott, T. D., et al. 2017a, ApJ, 848, L12 [Google Scholar]
- Abbott, B. P., Abbott, R., Abbott, T. D., et al. 2017b, ApJ, 850, L40 [NASA ADS] [CrossRef] [Google Scholar]
- Andreoni, I., Ackley, K., Cooke, J., et al. 2017, PASA, 34, e069 [NASA ADS] [CrossRef] [Google Scholar]
- Artale, M. C., Mapelli, M., Giacobbo, N., et al. 2019, MNRAS, 487, 1675 [NASA ADS] [CrossRef] [Google Scholar]
- Behroozi, P. S., Ramirez-Ruiz, E., & Fryer, C. L. 2014, ApJ, 792, 123 [NASA ADS] [CrossRef] [Google Scholar]
- Belczynski, K., Perna, R., Bulik, T., et al. 2006, ApJ, 648, 1110 [NASA ADS] [CrossRef] [Google Scholar]
- Beniamini, P., & Piran, T. 2016, MNRAS, 456, 4089 [NASA ADS] [CrossRef] [Google Scholar]
- Berger, E. 2010, ApJ, 722, 1946 [NASA ADS] [CrossRef] [Google Scholar]
- Berger, E. 2011, New Astron. Rev., 55, 1 [CrossRef] [Google Scholar]
- Berger, E. 2014, ARA&A, 52, 43 [CrossRef] [Google Scholar]
- Binney, J., & Tremaine, S. 2008, Galactic Dynamics, 2nd edn. (Princeton: Princeton University Press) [Google Scholar]
- Blakeslee, J. P., Jordán, A., Mei, S., et al. 2009, ApJ, 694, 556 [Google Scholar]
- Blanchard, P. K., Berger, E., Fong, W., et al. 2017, ApJ, 848, L22 [NASA ADS] [CrossRef] [Google Scholar]
- Bloom, J. S., Sigurdsson, S., & Pols, O. R. 1999, MNRAS, 305, 763 [NASA ADS] [CrossRef] [Google Scholar]
- Bloom, J. S., Kulkarni, S. R., & Djorgovski, S. G. 2002, AJ, 123, 1111 [NASA ADS] [CrossRef] [Google Scholar]
- Bovy, J. 2015, ApJS, 216, 29 [NASA ADS] [CrossRef] [Google Scholar]
- Bray, J. C., & Eldridge, J. J. 2016, MNRAS, 461, 3747 [NASA ADS] [CrossRef] [Google Scholar]
- Bray, J. C., & Eldridge, J. J. 2018, MNRAS, 480, 5657 [NASA ADS] [CrossRef] [Google Scholar]
- Bruzual, G., & Charlot, S. 2003, MNRAS, 344, 1000 [NASA ADS] [CrossRef] [Google Scholar]
- Cantiello, M., Jensen, J. B., Blakeslee, J. P., et al. 2018, ApJ, 854, L31 [Google Scholar]
- Capaccioli, M., Spavone, M., Grado, A., et al. 2015, A&A, 581, A10 [NASA ADS] [CrossRef] [EDP Sciences] [Google Scholar]
- Cappellari, M. 2002, MNRAS, 333, 400 [NASA ADS] [CrossRef] [Google Scholar]
- Cappellari, M. 2008, MNRAS, 390, 71 [NASA ADS] [CrossRef] [Google Scholar]
- Cappellari, M. 2016, ARA&A, 54, 597 [Google Scholar]
- Cappellari, M. 2020, MNRAS, 494, 4819 [NASA ADS] [CrossRef] [Google Scholar]
- Cappellari, M., Scott, N., Alatalo, K., et al. 2013, MNRAS, 432, 1709 [Google Scholar]
- Church, R. P., Levan, A. J., Davies, M. B., & Tanvir, N. 2011, MNRAS, 413, 2004 [NASA ADS] [CrossRef] [Google Scholar]
- Cid Fernandes, R., Mateus, A., Sodré, L., Stasińska, G., & Gomes, J. M. 2005, MNRAS, 358, 363 [Google Scholar]
- Conselice, C. J. 2014, ARA&A, 52, 291 [CrossRef] [Google Scholar]
- de Vaucouleurs, G., de Vaucouleurs, A., Corwin, Jr., H. G., et al. 1991, Third Reference Catalogue of Bright Galaxies (New York, NY, USA: Springer) [Google Scholar]
- Dutton, A. A., & Macciò, A. V. 2014, MNRAS, 441, 3359 [Google Scholar]
- Ebrová, I., Bílek, M., Yıldız, M. K., & Eliášek, J. 2020, A&A, 634, A73 [NASA ADS] [CrossRef] [EDP Sciences] [Google Scholar]
- Eftekhari, T., & Berger, E. 2017, ApJ, 849, 162 [NASA ADS] [CrossRef] [Google Scholar]
- Eichler, D., Livio, M., Piran, T., & Schramm, D. N. 1989, Nature, 340, 126 [NASA ADS] [CrossRef] [Google Scholar]
- Eldridge, J. J., Stanway, E. R., Xiao, L., et al. 2017, PASA, 34, e058 [Google Scholar]
- Eldridge, J. J., Stanway, E. R., & Tang, P. N. 2019, MNRAS, 482, 870 [NASA ADS] [CrossRef] [Google Scholar]
- Emsellem, E., Monnet, G., & Bacon, R. 1994, A&A, 285, 723 [NASA ADS] [Google Scholar]
- Emsellem, E., Cappellari, M., Krajnović, D., et al. 2007, MNRAS, 379, 401 [Google Scholar]
- Emsellem, E., Cappellari, M., Krajnović, D., et al. 2011, MNRAS, 414, 888 [Google Scholar]
- Ferguson, H. C. 1989, AJ, 98, 367 [Google Scholar]
- Fitzpatrick, E. L. 1999, PASP, 111, 63 [Google Scholar]
- Fong, W., & Berger, E. 2013, ApJ, 776, 18 [NASA ADS] [CrossRef] [Google Scholar]
- Fong, W., Berger, E., & Fox, D. B. 2010, ApJ, 708, 9 [NASA ADS] [CrossRef] [Google Scholar]
- Fong, W.-F., Nugent, A. E., Dong, Y., et al. 2022, ApJ, 940, 56 [NASA ADS] [CrossRef] [Google Scholar]
- Franx, M. 1988, MNRAS, 231, 285 [NASA ADS] [CrossRef] [Google Scholar]
- Fryer, C. L., Woosley, S. E., & Hartmann, D. H. 1999, ApJ, 526, 152 [NASA ADS] [CrossRef] [Google Scholar]
- Gaspari, N., Levan, A. J., Chrimes, A. A., & Nelemans, G. 2024, MNRAS, 527, 1101 [Google Scholar]
- Giacobbo, N., & Mapelli, M. 2018, MNRAS, 480, 2011 [Google Scholar]
- Giacobbo, N., & Mapelli, M. 2020, ApJ, 891, 141 [NASA ADS] [CrossRef] [Google Scholar]
- Gompertz, B. P., Levan, A. J., & Tanvir, N. R. 2020, ApJ, 895, 58 [NASA ADS] [CrossRef] [Google Scholar]
- Graham, M. T., Cappellari, M., Li, H., et al. 2018, MNRAS, 477, 4711 [Google Scholar]
- Haario, H., Saksman, E., & Tamminen, J. 2001, Bernoulli, 7, 223 [CrossRef] [Google Scholar]
- Hernquist, L., & Ostriker, J. P. 1992, ApJ, 386, 375 [Google Scholar]
- Hjorth, J., Levan, A. J., Tanvir, N. R., et al. 2017, ApJ, 848, L31 [NASA ADS] [CrossRef] [Google Scholar]
- Hobbs, G., Lorimer, D. R., Lyne, A. G., & Kramer, M. 2005, MNRAS, 360, 974 [Google Scholar]
- Hulse, R. A., & Taylor, J. H. 1975, ApJ, 195, L51 [NASA ADS] [CrossRef] [Google Scholar]
- Igoshev, A. P. 2020, MNRAS, 494, 3663 [NASA ADS] [CrossRef] [Google Scholar]
- Im, M., Yoon, Y., Lee, S.-K. J., et al. 2017, ApJ, 849, L16 [NASA ADS] [CrossRef] [Google Scholar]
- Jeans, J. H. 1922, MNRAS, 82, 122 [NASA ADS] [CrossRef] [Google Scholar]
- Jester, S., Schneider, D. P., Richards, G. T., et al. 2005, AJ, 130, 873 [Google Scholar]
- Kelley, L. Z., Ramirez-Ruiz, E., Zemp, M., Diemand, J., & Mandel, I. 2010, ApJ, 725, L91 [NASA ADS] [CrossRef] [Google Scholar]
- Kelly, P. L., & Kirshner, R. P. 2012, ApJ, 759, 107 [NASA ADS] [CrossRef] [Google Scholar]
- Kilpatrick, C. D., Fong, W.-F., Blanchard, P. K., et al. 2022, ApJ, 926, 49 [NASA ADS] [CrossRef] [Google Scholar]
- Kouveliotou, C., Meegan, C. A., Fishman, G. J., et al. 1993, ApJ, 413, L101 [NASA ADS] [CrossRef] [Google Scholar]
- Kroupa, P. 2001, MNRAS, 322, 231 [NASA ADS] [CrossRef] [Google Scholar]
- Kruckow, M. U., Tauris, T. M., Langer, N., Kramer, M., & Izzard, R. G. 2018, MNRAS, 481, 1908 [CrossRef] [Google Scholar]
- Lablanche, P.-Y., Cappellari, M., Emsellem, E., et al. 2012, MNRAS, 424, 1495 [NASA ADS] [CrossRef] [Google Scholar]
- Lauberts, A., & Valentijn, E. A. 1989, The Surface Photometry Catalogue of the ESO-Uppsala Galaxies (Garching: European Southern Observatory) [Google Scholar]
- Lee, W. H., & Ramirez-Ruiz, E. 2007, New J. Phys., 9, 17 [NASA ADS] [CrossRef] [Google Scholar]
- Levan, A. J., Wynn, G. A., Chapman, R., et al. 2006, MNRAS, 368, L1 [NASA ADS] [CrossRef] [Google Scholar]
- Levan, A. J., Jakobsson, P., Hurkett, C., et al. 2007, MNRAS, 378, 1439 [CrossRef] [Google Scholar]
- Levan, A. J., Lyman, J. D., Tanvir, N. R., et al. 2017, ApJ, 848, L28 [Google Scholar]
- Levan, A. J., Gompertz, B. P., Salafia, O. S., et al. 2024, Nature, 626, 737 [NASA ADS] [CrossRef] [Google Scholar]
- Lyman, J. D., Taddia, F., Stritzinger, M. D., et al. 2018, MNRAS, 473, 1359 [NASA ADS] [CrossRef] [Google Scholar]
- Malin, D. F., & Carter, D. 1983, ApJ, 274, 534 [Google Scholar]
- Mandel, I. 2021, Res. Notes Am. Astron. Soc., 5, 223 [Google Scholar]
- Mandel, I., & Müller, B. 2020, MNRAS, 499, 3214 [NASA ADS] [CrossRef] [Google Scholar]
- Mandhai, S., Lamb, G. P., Tanvir, N. R., et al. 2022, MNRAS, 514, 2716 [NASA ADS] [CrossRef] [Google Scholar]
- Margutti, R., & Chornock, R. 2021, ARA&A, 59, 155 [NASA ADS] [CrossRef] [Google Scholar]
- Mentz, J. J., La Barbera, F., Peletier, R. F., et al. 2016, MNRAS, 463, 2819 [Google Scholar]
- Metropolis, N., Rosenbluth, A. W., Rosenbluth, M. N., Teller, A. H., & Teller, E. 1953, J. Chem. Phys., 21, 1087 [Google Scholar]
- Metzger, B. D., Quataert, E., & Thompson, T. A. 2008, MNRAS, 385, 1455 [CrossRef] [Google Scholar]
- Moe, M., & Di Stefano, R. 2017, ApJS, 230, 15 [Google Scholar]
- Monnet, G., Bacon, R., & Emsellem, E. 1992, A&A, 253, 366 [NASA ADS] [Google Scholar]
- Moster, B. P., Naab, T., & White, S. D. M. 2013, MNRAS, 428, 3121 [Google Scholar]
- Nakar, E. 2007, Phys. Rep., 442, 166 [NASA ADS] [CrossRef] [Google Scholar]
- Narayan, R., Paczynski, B., & Piran, T. 1992, ApJ, 395, L83 [NASA ADS] [CrossRef] [Google Scholar]
- Navarro, J. F., Frenk, C. S., & White, S. D. M. 1997, ApJ, 490, 493 [Google Scholar]
- Nugent, A. E., Fong, W.-F., Dong, Y., et al. 2022, ApJ, 940, 57 [NASA ADS] [CrossRef] [Google Scholar]
- Nugent, A. E., Fong, W.-F., Castrejon, C., et al. 2024, ApJ, 962, 5 [NASA ADS] [CrossRef] [Google Scholar]
- O’Connor, B., Troja, E., Dichiara, S., et al. 2022, MNRAS, 515, 4890 [CrossRef] [Google Scholar]
- Oke, J. B., & Gunn, J. E. 1982, PASP, 94, 586 [Google Scholar]
- Palmese, A., Hartley, W., Tarsitano, F., et al. 2017, ApJ, 849, L34 [NASA ADS] [CrossRef] [Google Scholar]
- Pan, Y. C., Kilpatrick, C. D., Simon, J. D., et al. 2017, ApJ, 848, L30 [Google Scholar]
- Perna, R., & Belczynski, K. 2002, ApJ, 570, 252 [NASA ADS] [CrossRef] [Google Scholar]
- Perna, R., Artale, M. C., Wang, Y.-H., et al. 2022, MNRAS, 512, 2654 [NASA ADS] [CrossRef] [Google Scholar]
- Planck Collaboration VI 2020, A&A, 641, A6 [NASA ADS] [CrossRef] [EDP Sciences] [Google Scholar]
- Podsiadlowski, P., Langer, N., Poelarends, A. J. T., et al. 2004, ApJ, 612, 1044 [NASA ADS] [CrossRef] [Google Scholar]
- Portegies Zwart, S. F., & Yungelson, L. R. 1998, A&A, 332, 173 [NASA ADS] [Google Scholar]
- Puzia, T. H., Paolillo, M., Goudfrooij, P., et al. 2014, ApJ, 786, 78 [Google Scholar]
- Qin, B., Wu, X.-P., Chu, M.-C., Fang, L.-Z., & Hu, J.-Y. 1998, ApJ, 494, L57 [NASA ADS] [CrossRef] [Google Scholar]
- Rastinejad, J. C., Gompertz, B. P., Levan, A. J., et al. 2022, Nature, 612, 223 [NASA ADS] [CrossRef] [Google Scholar]
- Rodriguez-Gomez, V., Genel, S., Vogelsberger, M., et al. 2015, MNRAS, 449, 49 [Google Scholar]
- Rodriguez-Gomez, V., Pillepich, A., Sales, L. V., et al. 2016, MNRAS, 458, 2371 [Google Scholar]
- Rybicki, G. B. 1987, in Structure and Dynamics of Elliptical Galaxies, ed. P. T. de Zeeuw, 127, 397 [Google Scholar]
- Salafia, O. S., Colombo, A., Gabrielli, F., & Mandel, I. 2022, A&A, 666, A174 [NASA ADS] [CrossRef] [EDP Sciences] [Google Scholar]
- Sarin, N., Lasky, P. D., Vivanco, F. H., et al. 2022, Phys. Rev. D, 105, 083004 [NASA ADS] [CrossRef] [Google Scholar]
- Schlafly, E. F., & Finkbeiner, D. P. 2011, ApJ, 737, 103 [Google Scholar]
- Scott, N., Cappellari, M., Davies, R. L., et al. 2013, MNRAS, 432, 1894 [NASA ADS] [CrossRef] [Google Scholar]
- Srivastav, S., Smartt, S. J., Huber, M. E., et al. 2022, MNRAS, 511, 2708 [NASA ADS] [CrossRef] [Google Scholar]
- Stanway, E. R., & Eldridge, J. J. 2018, MNRAS, 479, 75 [NASA ADS] [CrossRef] [Google Scholar]
- Stevance, H., Eldridge, J., & Stanway, E. 2020, J. Open Source Softw., 5, 1987 [NASA ADS] [CrossRef] [Google Scholar]
- Stevance, H. F., Eldridge, J. J., Stanway, E. R., et al. 2023, Nat. Astron., 7, 444 [NASA ADS] [CrossRef] [Google Scholar]
- Tanvir, N. R., Levan, A. J., González-Fernández, C., et al. 2017, ApJ, 848, L27 [CrossRef] [Google Scholar]
- Tauris, T. M., & Takens, R. J. 1998, A&A, 330, 1047 [NASA ADS] [Google Scholar]
- Tauris, T. M., Kramer, M., Freire, P. C. C., et al. 2017, ApJ, 846, 170 [Google Scholar]
- Thompson, C., & Duncan, R. C. 1995, MNRAS, 275, 255 [Google Scholar]
- Troja, E., King, A. R., O’Brien, P. T., Lyons, N., & Cusumano, G. 2008, MNRAS, 385, L10 [NASA ADS] [CrossRef] [Google Scholar]
- Troja, E., Fryer, C. L., O’Connor, B., et al. 2022, Nature, 612, 228 [NASA ADS] [CrossRef] [Google Scholar]
- Tunnicliffe, R. L., Levan, A. J., Tanvir, N. R., et al. 2014, MNRAS, 437, 1495 [NASA ADS] [CrossRef] [Google Scholar]
- van der Wel, A., Franx, M., van Dokkum, P. G., et al. 2014, ApJ, 788, 28 [Google Scholar]
- Venhola, A., Peletier, R., Laurikainen, E., et al. 2018, A&A, 620, A165 [NASA ADS] [CrossRef] [EDP Sciences] [Google Scholar]
- Verbunt, F., Igoshev, A., & Cator, E. 2017, A&A, 608, A57 [NASA ADS] [CrossRef] [EDP Sciences] [Google Scholar]
- Vigna-Gómez, A., Neijssel, C. J., Stevenson, S., et al. 2018, MNRAS, 481, 4009 [Google Scholar]
- Voss, R., & Tauris, T. M. 2003, MNRAS, 342, 1169 [Google Scholar]
- Wiggins, B. K., Fryer, C. L., Smidt, J. M., et al. 2018, ApJ, 865, 27 [NASA ADS] [CrossRef] [Google Scholar]
- Willmer, C. N. A. 2018, ApJS, 236, 47 [Google Scholar]
- Yang, Y.-H., Troja, E., O’Connor, B., et al. 2024, Nature, 626, 742 [NASA ADS] [CrossRef] [Google Scholar]
- Yoon, Y., Park, C., Chung, H., & Lane, R. R. 2022, ApJ, 925, 168 [NASA ADS] [CrossRef] [Google Scholar]
- Yoon, Y., Ko, J., Chung, H., Byun, W., & Chun, K. 2024, ApJ, 965, 158 [NASA ADS] [CrossRef] [Google Scholar]
- Zemp, M., Ramirez-Ruiz, E., & Diemand, J. 2009, ApJ, 705, L186 [NASA ADS] [CrossRef] [Google Scholar]
- Zevin, M., Kelley, L. Z., Nugent, A., et al. 2020, ApJ, 904, 190 [NASA ADS] [CrossRef] [Google Scholar]
Appendix A: NGC 1396 properties inferred from stellar kinematics
The MGE fit to the surface brightness of NGC 1396 is reported in Table 1. The fit has a rms error of ∼11 percent, and is corrected for Galactic extinction and redshift dimming. The MGE total luminosity is  , equivalent to an absolute magnitude M606 = −16.90, while the half-light radius rhalf is 8.37 arcsec, or 0.80 kpc at the galaxy redshift.
The posterior distributions of the JAM parameters are shown in Fig. A.1. From the kinematics we infer an inclination  deg, an anisotropy parameter βz = 0.52 ± 0.05, a fraction of DM
  , and a stellar mass-to-light ratio
  . From the total luminosity and the mass-to-light ratio we infer that NGC 1396 has a dynamical mass
  .
.
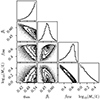 |
Fig. A.1. Posterior probability distributions of the JAM parameters inferred for NGC 1396 with AdaMet, namely the minimum intrinsic axial ratio qmin, the anisotropy parameter βz, the fraction of DM within a half-light radius fDM, and the logarithm of the stellar mass-to-light ratio log10(M⋆/L). The contours levels enclose the 12, 40, 68 and 86 percentiles (equivalent to the 0.5, 1, 1.5, and 2σ envelopes in 2D). |
For the NFW profile, we infer the scale radius  kpc from the dynamical mass, and the normalisation factor
  from Mhalf and fDM. With these parameters, the DM halo has a mass
  . All the errors quoted above are obtained propagating the uncertainties on the JAM parameters and the MGE rms error. We do not propagate the uncertainty on the redshift since its contribution is negligible.
All Tables
All Figures
|
Fig. 1. Projected kinematics of NGC 4993, inferred from MUSE data (top row) and predicted by JAM (bottom row). The left column shows the mean stellar velocity, V, along the LoS, while the right column shows the rms velocity, Vrms, along the LoS. The solid black lines represent the observed isophotes (top row) and the MGE fit (bottom row). The x′ axis is aligned with the galaxy photometric major axis. |
| In the text | |
|
Fig. 2. Posterior probability distributions of the JAM parameters inferred for NGC 4993 with AdaMet; namely, the minimum intrinsic axial ratio, qmin, the anisotropy parameter, βz, the fraction of DM within a half-light radius, fDM, and the logarithm of the stellar mass-to-light ratio, log10(M⋆/L). The first parameter is defined as qmin = min({qn}n = 1, 2, …, N) and it parametrises the inclination, i, through Eq. (3). The distributions are represented marginalised over one and two dimensions (histograms and contours, respectively). The contours levels enclose the 12, 40, 68, and 86 percentiles (equivalent to the 0.5, 1, 1.5, and 2σ envelopes in 2D). |
| In the text | |
|
Fig. 3. Systemic kicks from SN2 and escape velocities in our models. The dashed black line is the systemic kicks distribution predicted by BPASS-TUI. The shaded grey areas are the systems that received a natal kick vk of 30 km s−1. The solid coloured lines are the escape velocities at the locations of SN2, for both galaxies. |
| In the text | |
|
Fig. 4. Comparison between observed and modelled locations of core-collapse supernovae (CCSNe). Left: CCSN offsets from the ATLAS volumetric survey (Srivastav et al. 2022; Srivastav et al., in prep.) compared to those seen in our models (note that these are exclusively binary systems that can lead to BNS mergers, not an exhaustive theoretical population of CCSNe). Right: same as in the left panel, with the observed normalised offsets of CCSNe from Kelly & Kirshner (2012). |
| In the text | |
|
Fig. 5. Location of BNS mergers predicted by our models. Top: projected offsets of BNS mergers in physical units. The dashed and dotted lines indicate the locations of SN1 and SN2, respectively, while the remaining lines represent the BNS merger offsets divided in log-spaced time bins. The shaded vertical band indicates the observed projected offset of GW 170817. Bottom: host-normalised offsets of BNS mergers with delay times between 5 and 13 Gyr (thick solid lines). This time bin matches the age of possible GW 170817 progenitors. The thin lines show the distribution of merger offsets produced by BNSs where the neutron stars received a small natal kick, vk, of 30 km s−1 at SN2. The dashed line represents the distribution of normalised offsets for the SGRBs in the BRIGHT catalogue (Fong et al. 2022; Nugent et al. 2022) with a host galaxy more massive than NGC 4993 (the shaded region indicates the offsets’ uncertainties). The vertical lines labelled with Pch identify the normalised offsets at which the probability of chance alignment, Pch (Bloom et al. 2002), with each galaxy is either 1, 5, or 10%. |
| In the text | |
|
Fig. 6. Histograms of the BNS mergers in the projected offset vs delay time plane. The systemic kicks from SN2 have approximately 200, 270, and 360 km s−1 as 1st, 2nd, and 3rd quartiles; thus, each panel in the first four rows contains around 25% of the mergers. The last row shows the whole sample. The two columns separate the results for NGC 4993 and for NGC 1396. The histograms are not normalised; hence, they show counts and not densities. The solid red lines represent the median offset, while the dotted red lines indicate the 16th–84th percentiles, both as a function of the delay time. |
| In the text | |
|
Fig. A.1. Posterior probability distributions of the JAM parameters inferred for NGC 1396 with AdaMet, namely the minimum intrinsic axial ratio qmin, the anisotropy parameter βz, the fraction of DM within a half-light radius fDM, and the logarithm of the stellar mass-to-light ratio log10(M⋆/L). The contours levels enclose the 12, 40, 68 and 86 percentiles (equivalent to the 0.5, 1, 1.5, and 2σ envelopes in 2D). |
| In the text | |
Current usage metrics show cumulative count of Article Views (full-text article views including HTML views, PDF and ePub downloads, according to the available data) and Abstracts Views on Vision4Press platform.
Data correspond to usage on the plateform after 2015. The current usage metrics is available 48-96 hours after online publication and is updated daily on week days.
Initial download of the metrics may take a while.