Fig. 1.
Download original image
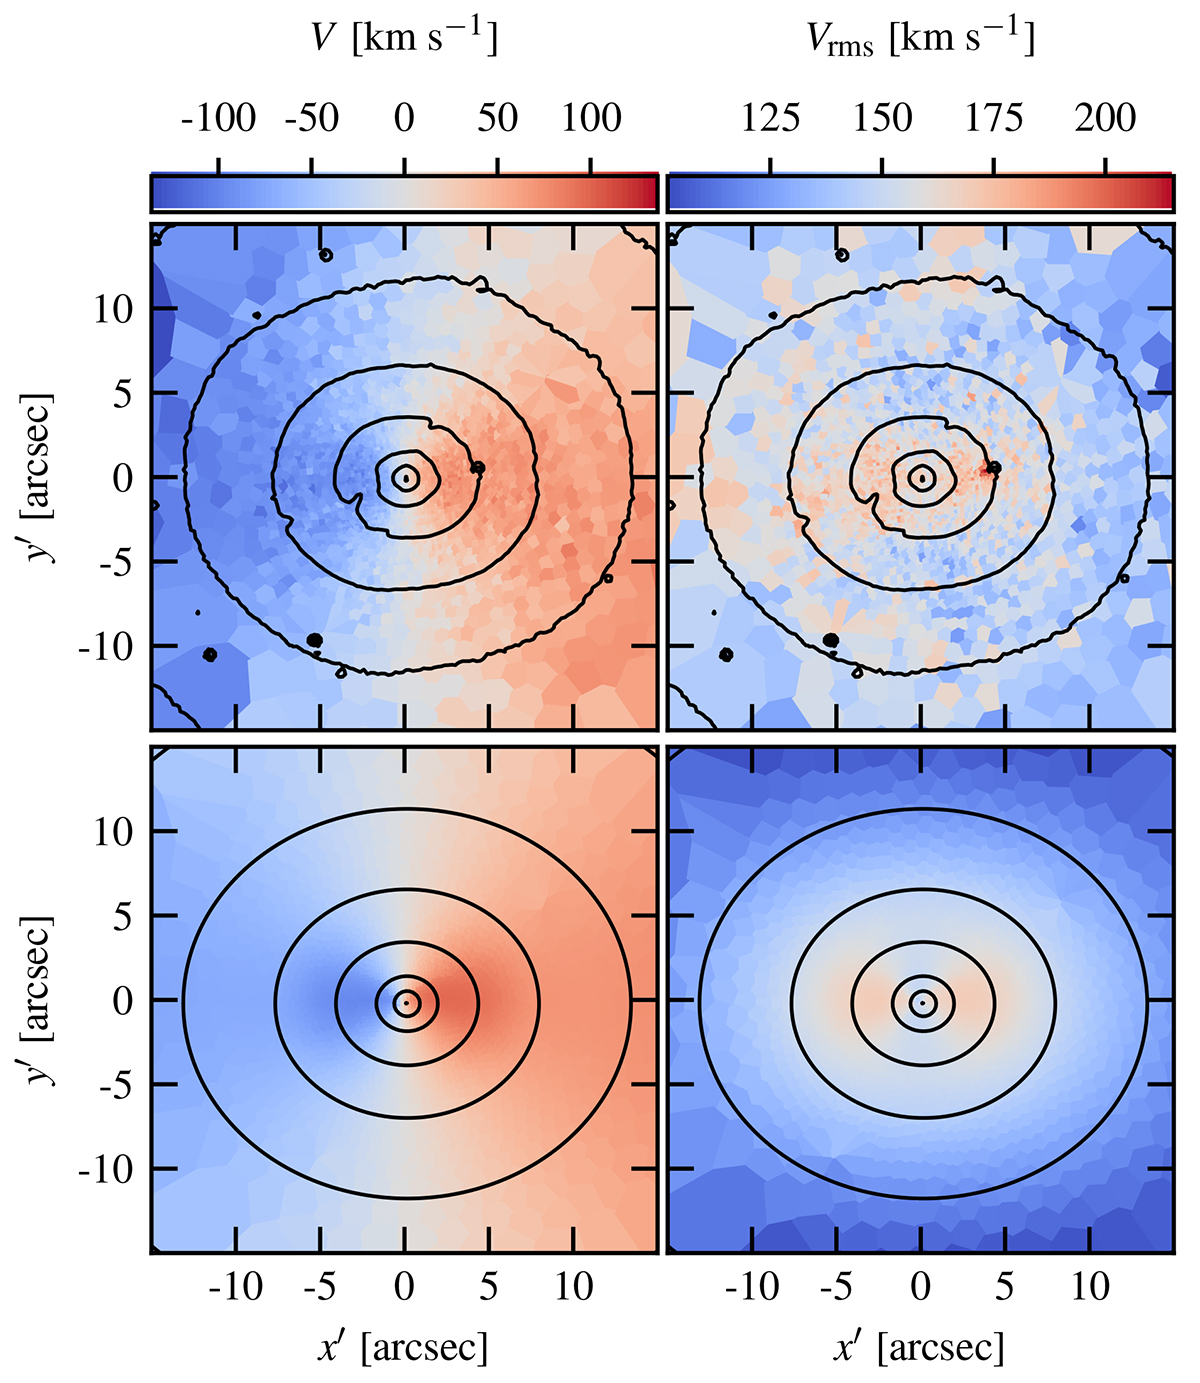
Projected kinematics of NGC 4993, inferred from MUSE data (top row) and predicted by JAM (bottom row). The left column shows the mean stellar velocity, V, along the LoS, while the right column shows the rms velocity, Vrms, along the LoS. The solid black lines represent the observed isophotes (top row) and the MGE fit (bottom row). The x′ axis is aligned with the galaxy photometric major axis.
Current usage metrics show cumulative count of Article Views (full-text article views including HTML views, PDF and ePub downloads, according to the available data) and Abstracts Views on Vision4Press platform.
Data correspond to usage on the plateform after 2015. The current usage metrics is available 48-96 hours after online publication and is updated daily on week days.
Initial download of the metrics may take a while.