| Issue |
A&A
Volume 699, July 2025
|
|
|---|---|---|
| Article Number | A113 | |
| Number of page(s) | 13 | |
| Section | Extragalactic astronomy | |
| DOI | https://doi.org/10.1051/0004-6361/202555058 | |
| Published online | 02 July 2025 | |
Binary neutron star merger offsets from their host galaxies
II. Short-duration gamma-ray bursts
1
Department of Astrophysics/IMAPP, Radboud University, P.O. Box 9010 6500 GL Nijmegen, The Netherlands
2
Department of Physics, University of Warwick, Coventry CV4 7AL, UK
3
European Space Agency (ESA), European Space Research and Technology Centre (ESTEC), Keplerlaan 1, 2201 AZ Noordwijk, The Netherlands
4
Center for Astrophysics | Harvard & Smithsonian, 60 Garden St., Cambridge, MA 02138, USA
5
Center for Interdisciplinary Exploration and Research in Astrophysics (CIERA) and Department of Physics and Astronomy, Northwestern University, Evanston, IL 60208, USA
⋆ Corresponding author: This email address is being protected from spambots. You need JavaScript enabled to view it.
Received:
7
April
2025
Accepted:
26
May
2025
Abstract
Context. The mergers of binary neutron stars (BNSs) and neutron star–black hole (NSBH) binaries have long been linked to short-duration gamma-ray bursts (SGRBs). However, despite their stellar progenitors, SGRBs are often found outside the stellar light of the host galaxy. This is commonly attributed to supernova kicks, which displace the SGRB progenitors from the original stellar population.
Aims. Our goal is to use stellar population synthesis models to reproduce and interpret the observed offsets of a statistical sample of SGRBs, using realistic galactic models based on the observed host properties.
Methods. We derived the host galaxy potentials from the observed properties on a case-by-case basis and simulated the galactic trajectories of synthetic BNSs and NSBHs from the BPASS code using three different kick prescriptions. We compared predicted and observed offsets to investigate the impact of velocity kicks, host galaxy types, and host association criteria.
Results. The locations of the SGRB population are consistent with the expectations of kicked BNS or BHNS progenitors, implying that such mergers are the dominant (and perhaps the only) progenitor system. Predictions for NSBHs provide a significantly worse fit compared to BNSs, while we find no significant difference when comparing different kick prescriptions. For late-type hosts, we find the best agreement when including hosts with a probability of chance alignment, Pch, of up to 20%, while lower Pch thresholds lead us to overestimate SGRB offsets. We argue that Pch is biased against viable hosts at the largest offsets and suggest the use of less conservative Pch thresholds for late-type hosts. For early-type hosts, the predictions underestimate SGRB offsets in a few cases regardless of the Pch threshold applied. We argue that this is likely due to the models missing galaxy evolution or spurious host associations.
Key words: gravitational waves / binaries: close / gamma-ray burst: general / stars: neutron
© The Authors 2025
 Open Access article, published by EDP Sciences, under the terms of the Creative Commons Attribution License (https://creativecommons.org/licenses/by/4.0), which permits unrestricted use, distribution, and reproduction in any medium, provided the original work is properly cited.
This article is published in open access under the Subscribe to Open model. This email address is being protected from spambots. You need JavaScript enabled to view it. to support open access publication.
1. Introduction
Short-duration gamma-ray bursts (SGRBs; Kouveliotou et al. 1993) are one of the manifestations of binary neutron star (BNS) mergers, along with kilonovae and afterglows in several bands. This connection has been established through several different SGRB observables, including their redshift distribution, the lack of coinciding supernovae (SNe), the demographics of their host galaxies, and, most recently, the coincident detection of GRB 170817 and the BNS merger GW 170817 (for a review, see Nakar 2007; Lee & Ramirez-Ruiz 2007; Berger 2014; Abbott et al. 2017a). Despite BNSs being considered the main progenitor, it remains unclear whether SGRBs are representative of BNS mergers, since it is possible that not all BNS mergers produce a SGRB (Rastinejad et al. 2022; Troja et al. 2022; Sarin et al. 2022; Salafia et al. 2022; Levan et al. 2024; Yang et al. 2024) and that not all SGRBs are produced by a BNS merger (Qin et al. 1998; Levan et al. 2006; Metzger et al. 2008; Troja et al. 2008; Gompertz et al. 2020). Furthermore, SGRBs are oftentimes found near a galaxy but outside its stellar light (e.g. Fig. 2 of Fong et al. 2022), suggesting that SGRB locations do not trace stellar light despite having stellar progenitors.
Since SGRBs do not always spatially coincide with a galaxy, identifying their host galaxies is a non-trivial task. A common approach to solving this problem is to compute the probability of chance alignment, Pch, of each galaxy around the SGRB location, and to identify the one with the lowest probability as the host (Bloom et al. 2002). Lower Pch values correspond to higher likelihoods of correctly assigning the host. However, in ∼20 − 30% of cases, no host can be confidently associated or multiple galaxies have the same non-negligible Pch, and as such the event is deemed to be host-less (Berger 2010; Fong et al. 2013; Tunnicliffe et al. 2013; O’Connor et al. 2022). For the hosts with a strong association, SGRBs are located at offsets that extend well beyond the host stellar light, and hence they do not trace the host stellar light (Fong & Berger 2013; O’Connor et al. 2022; Fong et al. 2022). Despite this apparent discrepancy, the offset distribution is consistent with the predictions for BNS mergers (Narayan et al. 1992; Portegies Zwart & Yungelson 1998; Bloom et al. 1999, 2002; Fryer et al. 1999; Bulik et al. 1999; Perna & Belczynski 2002; Voss & Tauris 2003; Belczynski et al. 2006; Church et al. 2011; Mandhai et al. 2022; Gaspari et al. 2024a) since BNS systems can travel with high systemic velocities given the two velocity kicks the system receives at each neutron star formation from the SN explosion (e.g. Andrews & Zezas 2019, and references therein). There are, however, competing explanations for the highest offsets and the host-less bursts, even within the BNS formation scenario. For instance, large merger offsets can be achieved by BNSs that formed within the stellar light but received a kick strong enough to escape the host (e.g. Zemp et al. 2009; Kelley et al. 2010; Behroozi et al. 2014; Beniamini et al. 2016; Wiggins et al. 2018; Zevin et al. 2020), as well as by BNSs that formed in the host outskirts (either in a globular cluster or in a faint and extended stellar halo; e.g. Salvaterra et al. 2010; Church et al. 2011; Bae et al. 2014; Perets & Beniamini 2021). Host-less bursts instead could be produced by BNSs that escaped the host, or by BNSs merging at a redshift high enough for the host galaxy to be faint and hence undetected (Berger 2010; Tunnicliffe et al. 2013; Mandhai et al. 2022; O’Connor et al. 2022).
Understanding the offset distribution of SGRBs is therefore crucial to identifying the host galaxies, discriminating between formation scenarios, and constraining the physical models for compact object mergers. In the literature, several works have synthesised populations of BNSs and neutron star–black hole (NSBH) binaries and simulated their galactic trajectories in order to study the merger locations. However, most analysed only a few extreme cases of galactic models (e.g. potentials with very different masses), analysed different star formation histories (SFHs; Bloom et al. 1999, 2002; Fryer et al. 1999; Bulik et al. 1999; Perna & Belczynski 2002; Voss & Tauris 2003; Belczynski et al. 2006; Salvaterra et al. 2010), or used potentials and SFHs from cosmological simulations (Zemp et al. 2009; Kelley et al. 2010; Behroozi et al. 2014; Wiggins et al. 2018; Perna et al. 2022; Mandhai et al. 2022). Only a few works have used galactic models that are based on the observed properties of real SGRB hosts (Abbott et al. 2017b; Zevin et al. 2020; Gaspari et al. 2024b), and to date only Church et al. (2011) used this approach with a statistical population of hosts. As the number of observed SGRB hosts has grown significantly in the last decade, this work aims to expand that of Church et al. (2011) by modelling and analysing in a systematic way the locations of an entire SGRB population, using galactic models that reproduce, case by case, the observed hostproperties.
The paper is structured as follows. In Sect. 2 we describe the sample of SGRB host galaxies, the method for modelling the galactic potentials, and the simulations of BNS trajectories within the potentials. In Sect. 3 we present the predicted BNS merger locations and compare them to the observed SGRB locations, before we summarise and conclude in Sect. 4. Throughout the paper, magnitudes are corrected for Galactic extinction along the line of sight (Schlegel et al. 1998; Schlafly & Finkbeiner 2011) and reported in the AB system (Oke & Gunn 1982). We adopt a ΛCDM cosmology with H0 = 67.66 km s−1 Mpc−1, ΩΛ = 0.69, and Ωm = 0.31 (Planck Collaboration VI 2020).
2. Methods
2.1. Host galaxy sample
In this work we used the sample of SGRBs and respective host galaxies assembled and characterised by Fong et al. (2022) and Nugent et al. (2022), which we define as the BRIGHT1 sample. The sample consists of 90 SGRBs observed mostly by NASA’s Neil Gehrels Swift Observatory (Gehrels et al. 2004), and characterised by a localisation with ≤5″ uncertainty, a clear sight line outside of crowded fields or high Galactic extinction regions, and a probability of chance alignment Pch ≤ 20% (Bloom et al. 2002). The sample contains ∼60% of the Swift population. Our analysis is limited to the subsample of 70 hosts that have a spectral energy distribution (SED) model, all of which are characterised by having a detection in at least three photometric bands. The subsample contains ∼77% of the BRIGHT sample, and ∼46% of the Swift population. We discuss the possible bias introduced by the Pch association criterium in Sect. 3.3, while the effects of other selection criteria are discussed in detail in Fong et al. (2022) and Nugent et al. (2022). The subsample properties are listed in Table A.1.
The host galaxies are classified by Nugent et al. (2022) as star-forming, transitioning, and quiescent, following the specific star-formation rate (SFR) prescription of Tacchella et al. (2022). In the following, we refer to the star-forming galaxies as late type, and to the transitioning and quiescent galaxies as early type. The hosts are also divided into three classes based on Pch, with the gold sample containing hosts with Pch ≤ 0.02, the silver sample containing those with 0.02 < Pch ≤ 0.10, and the bronze sample containing those with 0.10 < Pch ≤ 0.20. For 50 out of 70 hosts we have spectroscopic redshifts, while for the remaining 20 we used the photometric redshifts obtained by Nugent et al. (2022) from the SED fitting. For 19 hosts we also have an inferred Sérsic profile for the surface brightness, collected from different works in the literature. The projected offsets between bursts and host galaxies are taken from Fong et al. (2022), and the respective uncertainties combine the gamma-ray burst localisation uncertainty, the galaxy centroid uncertainty, and the astrometric tie uncertainty.
2.2. Galactic potentials
The first step in modelling the trajectories of SGRB progenitors is to model the gravitational potential of the host galaxies. As the host sample is heterogeneous in terms of galaxy properties, our goal is to build a model that is general enough to be suitable for all hosts, and yet detailed enough to reproduce the potentials to a good approximation. To this end, we started with the method from Church et al. (2011), who modelled the dark halo potentials for a similar galaxy sample, and we built on it mainly by including the stellar potential and the SFH. We assumed the potentials remain constant with time, and discuss the implications of this assumption in Sect. 3.2.
2.2.1. Dark matter potential
Following Church et al. (2011), we modelled the dark matter halo with a logarithmic potential
 (1)
(1)
where rh is the core radius of the halo and vh is the circular velocity at infinity. These two parameters are derivedhost-by-host from the B-band absolute magnitude, MB, using scaling relations. For early-type hosts, we used the relations of Thomas et al. (2009), while for late-type hosts, we used the relations of Kormendy & Freeman (2016). We obtained the MB from the SED models fitted by Nugent et al. (2022), by integrating them over the B-band filter in the rest-frame wavelengths.
2.2.2. Stellar light distribution
To model the stellar light distribution, we started from the Sérsic models (Sérsic 1963, 1968, see Graham & Driver 2005 for a concise overview) for the surface brightness, Σ, of the host galaxies, which are in the form
![Mathematical equation: $$ \begin{aligned} \Sigma (R) = \Sigma _0\, \exp \left[-b_n \left(\frac{R}{R_{\rm half}}\right)^{1/n}\right], \end{aligned} $$](/articles/aa/full_html/2025/07/aa55058-25/aa55058-25-eq2.gif) (2)
(2)
where R is the projected radius from the galaxy centre, Σ0 is the central surface brightness, n is the Sérsic index, Rhalf is the half-light radius, and bn is a function of n approximated as
 (3)
(3)
following Ciotti & Bertin (1999). We collected the values of Rhalf and n from the literature and list them in Table A.1. In a few cases the surface brightness is fitted with a combination of two Sérsic profiles. For these galaxies we only report the dominant component in Table A.1, but we do include both components weighted by Σ0 in our modelling.
We de-projected the surface brightness into the light density distribution according to one of two assumptions, which are meant to reproduce the two extremes. We assumed either that all the light is concentrated in an infinitely thin disc, in which case its radial distribution coincides with the Sérsic profile, or that light has a spherically symmetric density distribution, in which case we need to actually de-project the Sérsic profile. Hereafter, we refer to the distributions from these two models as ‘discs’ and ‘spheroids’, respectively.
For the spheroids, we de-projected the Sérsic profiles into the light density, 𝜚, using the approximation of Vitral & Mamon (2020),
![Mathematical equation: $$ \begin{aligned} \varrho (r,n) = \varrho _{\rm PS}(r,n)\ \mathrm{dex} \left[\sum ^{10}_{i = 0}\sum ^{10}_{i = 0} a_{ij} \log ^i r \log ^j n\right], \end{aligned} $$](/articles/aa/full_html/2025/07/aa55058-25/aa55058-25-eq4.gif) (4)
(4)
which improves that of Prugniel & Simien (1997)
![Mathematical equation: $$ \begin{aligned} \varrho _{\rm PS}(r) = \varrho _0\, \left(\frac{r}{R_{\rm half}}\right)^{-p_n} \exp \left[-b_{\rm n} \left(\frac{r}{R_{\rm half}}\right)^{1/n}\right]. \end{aligned} $$](/articles/aa/full_html/2025/07/aa55058-25/aa55058-25-eq5.gif) (5)
(5)
Here, pn is a function of n, for which we used the improved approximation of Lima Neto et al. (1999),
 (6)
(6)
instead of the original one from Prugniel & Simien (1997), while for the coefficients aij we used the values listed in Table B.2 of Vitral & Mamon (2020).
Since we have Sérsic profiles for only 20 out of 70 hosts, we also employed a second method for estimating the stellar light distribution that can be applied to the whole sample. For Rhalf, we estimated its value from the mass-size distribution of van der Wel et al. (2014) using the stellar mass, M⋆, given by the SED fits. We employed their mass-size distributions rather than parametric fits because they better reproduce Rhalf when extrapolated at M⋆ ≲ 109 M⊙ (c.f. Nedkova et al. 2021). For n instead, we simply assumed n = 1 for the discs (which gives an exponential disc profile; Freeman 1970) and n = 4 for the spheroids (de Vaucouleurs 1948, which gives a de Vaucouleurs profile typical of spheroids and elliptical galaxies).
2.2.3. Stellar potential
For discs, we modelled the stellar potential with a double-exponential disc of density
 (7)
(7)
where the scale length is hR = Rhalf/b1 and the scale height is assumed to be hz = γ hR. We adopted a fixed ratio of γ = 0.2 given that the observed value for local galaxies ranges between 0.1 and 0.3 (Padilla & Strauss 2008; Unterborn & Ryden 2008; Rodríguez & Padilla 2013). The disc potential is implemented using the approximation with three Miyamoto-Nagai discs of Smith et al. (2015, originally introduced by Flynn et al. 1996).
For spheroids, we assumed that mass follows light and model the stellar potential from the de-projected light distribution we get with Eq. (4) using the self-consistent field method of Hernquist & Ostriker (1992). For both spheroids and discs, we computed the normalisation factor, ρ⋆, 0, such that the total mass is equal to the stellar mass, M⋆, given by the SED fits.
2.3. Stellar population models
We made use of the Binary Population and Spectral Synthesis (BPASS; v2.2.1; Eldridge et al. 2017; Stanway & Eldridge 2018) binary stellar evolution models. These are a suite of models across binary parameter space that implement detailed modelling of binary interactions. The binary parameter space (including primary mass, mass ratio and orbital period) is sampled on a grid and a single model is evolved for each individual set of initial conditions. Each model is associated with a weight that corresponds to the relative frequency of the initial binary conditions according to Moe & Di Stefano (2017). A Kroupa (2001) initial mass function with slope −1.30 below 0.5 M⊙ and −2.35 above (up to 300 M⊙) is adopted. The final weightings correspond to the number of each binary system expected, at zero-age main sequence (ZAMS), in a stellar population of 106 M⊙. Models at ∼half solar metallicity (Z = 0.010) are adopted for this work.
We determined the systemic velocities and delay times of BNS and NSBH binaries as follows. Core-collapse was deemed to occur when a star, at the end of the evolutionary track, has a total mass > 1.5 M⊙, a carbon-oxygen core mass > 1.38 M⊙, and a non-zero oxygen-neon core mass. Remnant masses were pre-calculated as a BPASS output following Eldridge & Tout (2004). If the remnant has a mass in the range 1.38 < M/M⊙ < 3.0, we declare the object to be a neutron star, more massive remnants are black holes. The ejected mass is simply the difference between the pre-SN and remnant masses (for a detailed study of alternative remnant mass prescriptions in BPASS, see Briel et al. 2023). We determined if the binary stays bound – and if so, what the properties of the new orbit are – using the model from Tauris & Takens (1998, see also Tauris et al. 1999). This also determines the systemic velocities of the binaries that remain bound. For neutron star natal kicks we adopted three distributions: the single-peaked Hobbs distribution (Hobbs et al. 2005), the double-peaked Verbunt distribution (Verbunt et al. 2017), and the Bray model (Bray & Eldridge 2016; Richards et al. 2023, which ties the natal kick magnitude to the remnant and ejecta mass). Remnant natal kick magnitudes are drawn from these distributions, and the directions are sampled isotropically. For black holes, the kick magnitude is reduced by a factor of 1.4 M⊙/M (Eldridge et al. 2017) to account for lower black hole natal kick velocities (e.g. Mandel 2016; Atri et al. 2019).
All orbits that survive the first SN are circularised to reflect tidal dissipation (e.g. Hurley et al. 2002; Vigna-Gómez et al. 2018; Iorio et al. 2023) and the radius is set equal to the semi-latus rectum a(1 − e2), where a and e are the semi-major axis and eccentricity output by the Tauris & Takens (1998) model. Orbits that survive the second SN are left eccentric instead. For models that end with a bound compact binary, we computed the gravitational wave in-spiral time following Mandel (2021).
We therefore have, for each model that ultimately ends with a compact binary, the times between the ZAMS, the first SN, the second SN, and the merger, and the systemic kicks after each SN. From this, we can determine for any given model – when seeded in a galactic potential – when and where the final BNS or NSBH binary will merge, with respect to the birth time and place. In Fig. 1 we show the time between the second SN and merger, Tinspiral, and the systemic kick, vsys, from the second SN for all the models we employed.
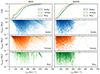 |
Fig. 1. Merger times, Tinspiral, and systemic kicks from the second SN, vsys, for BNSs and NSBH binaries from our population synthesis models. The populations were obtained using three different models for the SN natal kicks, namely the Hobbs model (Hobbs et al. 2005), the Verbunt model (Verbunt et al. 2017), and the Bray model (Bray & Eldridge 2016). Distributions from the Bray model present discrete features because the natal kicks from this prescription are weighted by the compact remnant mass output by BPASS, which in turn reflects the discrete grid of input parameters (e.g. initial masses and orbital periods). |
2.4. Galactic trajectories
The BNS and NSBH merger locations are modelled by seeding the BPASS populations within the host potential and simulating their galactic trajectories with galpy2 (Bovy 2015). The potentials are built by summing the dark halo potential and the stellar potential, the first of which is modelled using the routine potential.LogarithmicHaloPotential, and the second using either potential.MN3ExponentialDiskPotential (for discs) or potential.SCFPotential (for spheroids).
The binaries were seeded in space following the stellar light as expected for core-collapse SNe (Fruchter et al. 2006), specifically by sampling their initial galactocentric radii from the light density distribution with the inverse transform method. We then computed the circular velocities at the binary location in each specific potential, and initialised the binaries on circular orbits. The orbital planes are oriented in random isotropic directions, in order for the models to be agnostic with respect to the galaxy viewing angle. To model the SFH instead, we weighted each binary model a posteriori with the normalised SFR at the lookback time, tlookback, that coincides with their delay time (namely, the time between ZAMS and merger). Following Nugent et al. (2022), the SFR was modelled with a delayed exponentially declining model (delayed-τ model), where
 (8)
(8)
with τ being the e-folding time, t = tage − tlookback, and tlookback ∈ [0, tage]. Note that for this model the mass-weighted age is
 (9)
(9)
which connects τ, tage, and tm.
After seeding, we applied the systemic kick predicted for the first SN by BPASS, simulated the galactic trajectory up to the second SN, applied the second systemic kick, and then simulated the trajectory up to the merger. Both kicks were imparted with a direction that is randomly sampled from the isotropic distribution. The resulting offsets were then projected on a random isotropic orientation for comparison with the observed ones.
3. Results
3.1. Comparing predicted offsets to observations
From our models, we can predict the distribution of merger offsets for each host galaxy and for a range of assumptions, the first of which is whether the stellar component is a disc or a spheroid. Hereafter, we assume that the fiducial models are discs for late-type hosts and spheroids for early-type hosts. In Fig. 2 we show the predicted offsets for the subsample that has a Sérsic fit, with both disc and spheroid models. Second, we have three different models for the SN natal kick. We assumed the Verbunt model as fiducial and provide a comparison to the other two in Sect. 3.2.
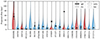 |
Fig. 2. Predicted and observed merger offsets of BNSs for the subsample of SGRBs in the BRIGHT catalogue (Fong et al. 2022; Nugent et al. 2022) that have a Sérsic fit. The violins show the distributions of predicted offsets assuming either discs (dsc) or spheroids (sph) for the stellar light distribution. The dots show the observed SGRB offsets with their respective errors. We also indicate whether the host galaxy is an early or late type. |
A third assumption is whether to model the stellar light distribution with the Sérsic fit or with the mass-size relation of van der Wel et al. (2014, see also our Sect. 2.2.2). Sérsic fits would provide more realistic models but they are only available for about 1/4 of the hosts, while the mass-size relation might provide less realistic models but can be applied homogeneously to the whole host sample, significantly increasing the sample size. Therefore, we chose to take neither as fiducial and compared them on an equal footing.
To compare predictions to observations, we relied on the fraction, F, of predicted mergers that have a projected offset smaller than the observed one. We have therefore one realisation of F for each host with a value between 0 and 1, with 0 meaning that all predicted offsets are larger than the observed one, and 1 meaning that all predicted mergers happen within the observed offset. If we were to sample one value of F for each host according to the predicted offset distributions, F would then be uniformly distributed between 0 and 1. We can therefore compare predictions to observations by testing the F distribution against the uniform distribution with a Kolmogorov-Smirnov (KS) test.
In Fig. 3 we show the F distribution for a range of assumptions, with the fiducial models highlighted. In particular, we show the distributions obtained using the Sérsic fit, the mass-size relation, and the mass-size relation applied only to the subsample with a Sérsic fit. The latter (shown in the middle column in Fig. 3) allows us to check whether using the mass-size relation changes the F distribution significantly compared to the more accurate Sérsic models. We notice that the fiducial distribution for late types do not change significantly, while for early types we have two out of six SGRBs that move to slightly higher F values. In the same figure we also show the uncertainties due to errors on the observed offsets (which combine astrometric errors from the merger locations and the galaxy centroids) and the uncertainties due to the mass-size relation spread. We notice that for early types the offset errors dominate over the mass-size relation spread, while for early types they have comparable magnitudes.
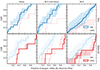 |
Fig. 3. CDFs of the fraction of BNS mergers within the observed offset F for the fiducial model. Top row: Models where the stellar component is a disc. Bottom row: Models with a spheroid. Left column: Hosts with a Sérsic fit. Central column: Hosts with a Sérsic fit but modelled with the mass-size relation. Right column: All the hosts modelled with the mass-size relation. The shaded areas indicate the uncertainty due to the astrometric error on the observed offset, while the dotted lines indicate the uncertainty due to the spread of the mass-size relation. The host types are shown in the legends. |
3.2. Impact of the natal kick model
When comparing F distributions to the uniform distribution in Fig. 4, we note that a cumulative distribution function (CDF) above the bisector (which is the CDF of the uniform distribution) indicates that our model is underestimating the observed distribution of merger offsets, while a CDF below the bisector indicates that we are overestimating the offsets. From Fig. 4 we find that the overall trend is for the CDFs from late-type hosts to be systematically above those from early-type hosts. This can be the result of several effects, either alone or in combination, such as the scaling relations predicting systematically lighter dark halos for late-type hosts, intrinsically larger offsets in early-type hosts, or a bias against large offsets for late-type from the host association criterium (see Sect. 3.3 for the latter).
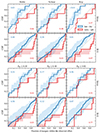 |
Fig. 4. CDFs of the fraction of BNS mergers within the observed offset F. Upper panels: Comparison of models with different natal kick prescriptions, namely the Hobbs model (left column), the Verbunt model (central column), and the Bray model (right column). Distributions in the first row are modelled with Sérsic profiles, while those in the second row are modelled with the mass-size relation. The KS p-value for each CDF with respect to a uniform distributions is shown in each panel. Host types and stellar distribution models are shown in the legend. Lower panels: Comparison of host subsamples at different Pch thresholds, namely ≤20% (left column), ≤10% (central column), and ≤2% (right column). All the remaining assumptions are fiducial; in particular, we are using the Verbunt model for natal kicks. |
Looking at the subsample with Sérsic fits (first row in Fig. 4), we see that the null hypothesis can be rejected at a significance level below 5% for Hobbs and Bray kicks, since they overestimate the offset distributions of late-type hosts, while no kick model can be rejected based on the offsets of early-type hosts. This is consistent with our previous work (Gaspari et al. 2024b) showing that shallower potentials such as those of spiral or dwarf galaxies can discriminate between kick models, whereas deeper potentials like those of massive ellipticals cannot. Furthermore, we find indications that our analysis is most sensitive to the upper part of the kick distribution (namely the largest kicks) as predicted by Gaspari et al. (2024b). Indeed, the kick distribution from the Bray model resembles that of the Verbunt model for the most part, except for a subpopulation of kicks with values comparable or larger than those from the Hobbs model (see Fig. 1). We suggest that these large kicks are responsible for the large merger offsets from early-type hosts of the Bray model (and hence its low p-value), since Bray kicks would otherwise be similar to the Verbunt ones. The merger offsets overestimate in late-type galaxies could also be explained by the sample being contaminated with collapsar-driven gamma-ray bursts (e.g. traditional long gamma-ray bursts), which are concentrated on the host light in contrast to SGRBs (Fong & Berger 2013; Blanchard et al. 2016; Fong et al. 2022). However, Fong et al. (2022) find that the possible contaminants (which they identify using the Bromberg et al. 2013 criterium) and the remaining population have undistinguishable offset distributions, making this explanation unlikely. Overall, when comparing the results for late-type offsets from the subsample modelled with Sérsic to those from the full sample modelled with the mass-size relation, we see that a larger sample is warranted in order to do model selection.
Looking at the sample modelled with the mass-size relation (second row in Fig. 4), we see that only Bray kicks are rejected by late-type hosts, while all models but Bray are rejected by early-type hosts (though p-value for Bray is 7%). The early-type F distributions also show a remarkable bimodality that is independent of kicks and is inconsistent with a uniform distribution, having around half of the sample at F < 0.5 and the remaining half at F > 0.8. This excess of high F values can be the result of (i) galaxy evolution, (ii) the progenitor population being more extended than we estimated, or (iii) spurious host associations (see Sect. 3.3), or any combination of them. By comparing the observed SGRB offsets to the BNS merger offsets of Wiggins et al. (2018), Fong et al. (2022) show that the fraction of population missing at large offsets (≥30 − 50 kpc) from the BRIGHT catalogue should not be substantial, and it is consistent with the fraction of inconclusive host associations (∼7%). If this were the case, the excess at high F could be even more pronounced.
Starting from the first explanation, namely galaxy evolution, we note that our models assume the galactic potentials to be static, in contrast to real galaxies, which grow in mass and size over cosmic time (e.g. van der Wel et al. 2014) and especially the most massive ones whose evolution can be dominated by galaxy mergers (e.g. Rodriguez-Gomez et al. 2015, 2016). To this regard, Kelley et al. (2010) and Wiggins et al. (2018) have shown that models accounting for the time evolution of the host potential and its neighbours predict larger BNS merger offsets, except for the BNSs that had the lowest systemic kicks and those merging at high redshifts. The early-type hosts in our sample have indeed an old stellar population and redshifts z ≲ 0.5, supporting the galaxy evolution scenario, whereas late-type hosts tend to be much younger and span a redshift range of 0 ≤ z ≲ 2.5 (see Fig. 8 of Nugent et al. 2022). On top of the evolving potential, in an environment with a high number density of galaxies there is also the mixing of neighbouring populations (at least ∼5 − 13% of SGRBs hosts belong to a galaxy cluster, Nugent et al. 2020). Zemp et al. (2009) showed that in these dense environments, the central galaxy in the most massive halos retains BNSs better than those in the field, but the BNSs escaping from their satellites produce much more diffuse distribution mergers that might still be associated with the central galaxy instead of the one where they originated from. In this case, the association with the massive elliptical galaxy may be spurious, but the association with the larger structure in which it resides may be correct.
For the second explanation, namely that the progenitor population is more extended than we estimate, we identify three possibilities. First, it might be that the mass-size relation predicts smaller half-light radii than the true ones. This would result in the BNSs being seeded deeper in the potential with a higher initial circular velocity, which in turn would dampen the migration outwards. We do not find strong evidence to either support or discard this scenario, although we notice that if this were the case then it would indicate a selection effect in the population of early-type hosts. Second, our sample might include SGRBs produced by the merger of BNS dynamically formed in dense environment such as globular clusters. Church et al. (2011) estimate that ≤10% of SGRBs originate from this channel; however, more recent simulations show that the merger rate of dynamically formed BNSs is negligible compared to that of field binaries (Ye et al. 2020, c.f. Grindlay et al. 2006). Hence, we find this scenario unlikely. A third and last possibility is that a significant fraction of the stellar mass of early-type hosts is located in a highly extended halo that has a surface brightness below the detection limit, and hence it is undetected in conventional observations (compared to stacked images or ultra-deep observations). In this scenario BNSs can be born already with a large normalised offset and merge in situ, though this would require no systemic kicks (Perets & Beniamini 2021). We notice that this is in tension with the observational evidence supporting systemic kicks (Atri et al. 2019; Zhao et al. 2023; O’Doherty et al. 2023; Disberg et al. 2024) and models showing that large merger offsets can also be achieved with modest kicks (vsys ≲ 100 km s−1; Gaspari et al. 2024a; Disberg et al. 2024), and therefore we find this scenario also unlikely.
For comparison, we show the results obtained using NSBH binaries instead of BNSs in Fig. B.1. Here we see that the F distributions from all natal kick models are consistent with the uniform distribution when using the subsample with Sérsic fits, but five out of six fail the KS test when using the whole sample modelled with the mass-size relation. In particular, we see that for the latter sample, the F distributions are always below the bisector in the case of late-type hosts, which is consistent with NSBH binaries having smaller systemic kicks (Fig. 1) and thus predicted merger offsets that are systematically smaller than the observed ones. This again supports our finding that a larger sample is warranted for model selection. We also notice that F distributions for early-type hosts are bimodal, as for BNSs.
3.3. Impact of the host association criterium
To understand the impact of possible misidentified host galaxies, we repeated the analysis separately for each of the three Pch cuts, namely Pch ≤ 20% (gold, silver, and bronze hosts), Pch ≤ 10% (gold and silver hosts), and Pch ≤ 2% (gold hosts only). These three samples contain respectively 70, 62, and 42 host galaxies, and we expect they have respectively ≤4.4, ≤2.8, and ≤0.8 misidentified hosts.
The probability of a chance alignment, Pch, is known to be biased against hosts that are faint and have small apparent sizes because they are either intrinsically faint or at high redshifts (Levan et al. 2007; Berger 2010; Tunnicliffe et al. 2013; O’Connor et al. 2022). The reason for this is twofold. First, Pch takes into account the transient localisation error and the host apparent size in such a way that faint hosts can have a low Pch only if the transient is well localised (e.g. it has sub-arcsecond localisation from an optical/infrared counterpart) and is nearby in projection, in contrast to a bright or extended host, which can maintain a low Pch even with a worse transient localisation or a greater offsets (e.g. Gaspari et al. 2024b). Second, intrinsically faint galaxies have shallower potentials (Kormendy & Freeman 2016), and hence BNSs can more easily escape the potential and merge at greater offsets, where Pch is close to unity (e.g. Gaspari et al. 2024b).
Looking at the subsample with Sérsic fits (third row in Fig. 4), we notice no significant difference in the F distributions when applying different Pch cuts. However, when looking at the sample modelled with the mass-size relation (fourth row in Fig. 4), we do see the F distributions of late-type hosts moving leftwards of the bisector as we cut the sample at lower Pch, while for early-type hosts there is no evident difference and the bimodality is still present at all cuts.
The shift above the bisector in the case of late-type hosts is consistent with the exclusion of the galaxies at the largest offsets from the subsamples with the lower Pch cuts, and the subsequent systematic underestimate of predicted offsets with respect to the observed ones. Fong et al. (2022) shows that the inclusion of silver and bronze hosts capture a substantial number of bursts at z ≳ 1, of hosts with lower luminosities (≤1010 L⊙ in the r band), and hosts at larger offsets (with the median offset increasing by ∼3 kpc), thus diversifying the population of known SGRB hosts and resulting in a more representative sample (see also Nugent et al. 2022). Our result further supports this claim.
Moving to early-type hosts, the bimodality of F at all Pch thresholds suggests that this feature is not the result of spurious host associations. Indeed, as the early-type subsample contains 5 gold (Pch ≤ 2%) and 6 silver (Pch ≤ 10%) hosts, we already expected ≤0.7 misidentified hosts (≤6.4%). This supports the scenario in which bimodality is produced by shortcomings in our models, first and foremost the inability to capture the complex effects of galaxy evolution and structure formation. However, we are not fully confident in ruling out a substantial contribution from misidentified hosts at large offsets given the biased nature of Pch, as explained at the beginning of this section.
4. Conclusions
In this work we predicted the galactocentric offset of 70 observed SGRBs from the BRIGHT catalogue (Fong et al. 2022; Nugent et al. 2022), by modelling the galactic potentials on a host-by-host basis and seeding in them populations of BNSs and NSBH binaries synthesised using the BPASS code (Eldridge et al. 2017; Stanway & Eldridge 2018). The host sample was divided into three subsamples based on the chance alignment probability, Pch (42 gold hosts with Pch ≤ 2%, 20 silver hosts with 2%< Pch ≤ 10%, and 8 bronze hosts with 10%< Pch ≤ 20%); however, we used the whole sample for the fiducial models. We reproduced each galactic potential by summing the potential of a dark halo with that of the stellar component, the first obtained from the galaxy total magnitude in the B band through scaling relations (Thomas et al. 2009; Kormendy & Freeman 2016), and the second obtained by de-projecting the galaxy surface brightness profile normalised to the total stellar mass inferred from SED fitting (Nugent et al. 2022). As fiducial models, we assumed the stellar component of late-type hosts (i.e. star-forming) to be a disc, and that of early-type hosts (i.e. quiescent and transitioning) to be a spheroid. The synthetic binaries were seeded in the potentials using stellar light as a proxy, and in time using the SFH fitted by Nugent et al. (2022). We then simulated the galactic trajectories with galpy (Bovy 2015), accounting for the velocity kicks received at each SN, and recorded the merger location for analysis. In the population synthesis, we employed three different natal kick prescriptions (namely those from Hobbs et al. 2005; Bray & Eldridge 2016; Verbunt et al. 2017) to probe the impact of SN kicks on the offsets, taking the Verbunt model as fiducial. Since we used static galactic potentials, our models cannot reproduce the time evolution of the host potentials and its possible neighbours, unlike what has been done by theoretical models that employ cosmological simulations of structure formation (e.g. Zemp et al. 2009; Kelley et al. 2010; Behroozi et al. 2014; Wiggins et al. 2018). However, the strength of our methodology is that it can be applied to an observed transient population using the observed galaxy properties. We summarise our conclusions:
-
Regarding late-type hosts, we find that our fiducial model for BNS mergers is consistent with observed SGRB offsets (last two rows of Fig. 4). However, our fiducial sample includes hosts with Pch of up to 20%, in contrast to the more common criterium for a strong host association, which is a Pch below a few per cent. When we cut our host sample at lower Pch thresholds, our predictions tend to increasingly overestimate the offsets, which is consistent with the exclusion of hosts at the largest offsets. Therefore, we conclude that a less conservative Pch threshold should be considered when associating late-type hosts, given that our predictions for BNS merger offsets are consistent with SGRB offsets up to Pch ≤ 20%.
-
Regarding early-type hosts, we find that our models significantly underestimate the offsets of around half the subsample (last two rows of Fig. 4). We find this result regardless of the Pch threshold adopted; therefore, the discrepancy may not be caused by misidentified hosts, although we notice that association by Pch might introduce a bias towards bright and extended galaxies. We conclude that there are two plausible explanations (see Sect. 3.3). First, our models lack the temporal evolution of the host potential and its possible neighbours, which would spread out the spatial distribution of mergers. Second, in the presence of satellite galaxies, the distribution of mergers originating from the satellites can overlap that of the associate host and produce a spurious association due to the mixing of neighbouring populations.
-
When comparing the predictions for BNS mergers from different natal kicks models, we do not find strong evidence against any of them, as they all produce similar results (first two rows of Fig. 4). When we turn to NSBH binaries, however, our models systematically underestimate the observed offsets (first two rows of Fig. B.1), likely due to the lower systemic kicks we predict. Also, when comparing results from the subsample of hosts with Sérsic fits to those from the whole sample, we see that a larger and more diverse sample is warranted for model selection.
Our results strongly support the origin of the majority (if not all) of SGRBs in the merger of kicked compact objects, and that there is not significant contamination from, for example, collapsar gamma-ray bursts. Although our results are inconclusive with respect to natal kicks, we point out that systemic kicks also encode the pre-SN orbit and progenitor masses via the mass-loss kick and, therefore, can inform the evolutionary processes of the progenitor binaries, such as mass transfer and common envelope episodes. For this reason, a natural follow-up of this work would be to test the main free parameters and uncertainties in population synthesis modelling, along with the impact of metallicity. Furthermore, we suggest that merger offsets should be used as an observational constraint for population synthesis model selection along with merger rates.
Acknowledgments
We thank the referee, Soheb Mandhai, for the constructive comments that helped us improving this paper. We thank Ross Church, Michela Mapelli, Rosalba Perna, Maria Celeste Artale, Ilya Mandel, and Wen-fai Fong for the useful discussions. NG acknowledges studentship support from the Dutch Research Council (NWO) under the project number 680.92.18.02. AJL was supported by the European Research Council (ERC) under the European Union’s Horizon 2020 research and innovation programme (grant agreement No. 725246). AAC acknowledges support through the European Space Agency (ESA) research fellowship programme.
References
- Abbott, B. P., Abbott, R., Abbott, T. D., et al. 2017a, ApJ, 848, L12 [Google Scholar]
- Abbott, B. P., Abbott, R., Abbott, T. D., et al. 2017b, ApJ, 850, L40 [NASA ADS] [CrossRef] [Google Scholar]
- Andrews, J. J., & Zezas, A. 2019, MNRAS, 486, 3213 [NASA ADS] [CrossRef] [Google Scholar]
- Atri, P., Miller-Jones, J. C. A., Bahramian, A., et al. 2019, MNRAS, 489, 3116 [NASA ADS] [CrossRef] [Google Scholar]
- Bae, Y.-B., Kim, C., & Lee, H. M. 2014, MNRAS, 440, 2714 [Google Scholar]
- Behroozi, P. S., Ramirez-Ruiz, E., & Fryer, C. L. 2014, ApJ, 792, 123 [NASA ADS] [CrossRef] [Google Scholar]
- Belczynski, K., Perna, R., Bulik, T., et al. 2006, ApJ, 648, 1110 [NASA ADS] [CrossRef] [Google Scholar]
- Beniamini, P., Hotokezaka, K., & Piran, T. 2016, ApJ, 829, L13 [Google Scholar]
- Berger, E. 2010, ApJ, 722, 1946 [NASA ADS] [CrossRef] [Google Scholar]
- Berger, E. 2014, ARA&A, 52, 43 [CrossRef] [Google Scholar]
- Berger, E., Fox, D. B., Price, P. A., et al. 2007, ApJ, 664, 1000 [NASA ADS] [CrossRef] [Google Scholar]
- Blanchard, P. K., Berger, E., & Fong, W.-F. 2016, ApJ, 817, 144 [Google Scholar]
- Blanchard, P. K., Berger, E., Fong, W., et al. 2017, ApJ, 848, L22 [NASA ADS] [CrossRef] [Google Scholar]
- Bloom, J. S., Sigurdsson, S., & Pols, O. R. 1999, MNRAS, 305, 763 [NASA ADS] [CrossRef] [Google Scholar]
- Bloom, J. S., Kulkarni, S. R., & Djorgovski, S. G. 2002, AJ, 123, 1111 [NASA ADS] [CrossRef] [Google Scholar]
- Bovy, J. 2015, ApJS, 216, 29 [NASA ADS] [CrossRef] [Google Scholar]
- Bray, J. C., & Eldridge, J. J. 2016, MNRAS, 461, 3747 [NASA ADS] [CrossRef] [Google Scholar]
- Briel, M. M., Stevance, H. F., & Eldridge, J. J. 2023, MNRAS, 520, 5724 [Google Scholar]
- Bromberg, O., Nakar, E., Piran, T., & Sari, R. 2013, ApJ, 764, 179 [NASA ADS] [CrossRef] [Google Scholar]
- Bulik, T., Belczyński, K., & Zbijewski, W. 1999, A&AS, 138, 483 [NASA ADS] [CrossRef] [EDP Sciences] [Google Scholar]
- Church, R. P., Levan, A. J., Davies, M. B., & Tanvir, N. 2011, MNRAS, 413, 2004 [NASA ADS] [CrossRef] [Google Scholar]
- Ciotti, L., & Bertin, G. 1999, A&A, 352, 447 [NASA ADS] [Google Scholar]
- de Vaucouleurs, G. 1948, Ann. Astrophys., 11, 247 [Google Scholar]
- Disberg, P., Gaspari, N., & Levan, A. J. 2024, A&A, 689, A348 [NASA ADS] [CrossRef] [EDP Sciences] [Google Scholar]
- Eldridge, J. J., & Tout, C. A. 2004, MNRAS, 353, 87 [NASA ADS] [CrossRef] [Google Scholar]
- Eldridge, J. J., Stanway, E. R., Xiao, L., et al. 2017, PASA, 34, e058 [Google Scholar]
- Flynn, C., Sommer-Larsen, J., & Christensen, P. R. 1996, MNRAS, 281, 1027 [CrossRef] [Google Scholar]
- Fong, W., & Berger, E. 2013, ApJ, 776, 18 [NASA ADS] [CrossRef] [Google Scholar]
- Fong, W., Berger, E., & Fox, D. B. 2010, ApJ, 708, 9 [NASA ADS] [CrossRef] [Google Scholar]
- Fong, W., Berger, E., Chornock, R., et al. 2013, ApJ, 769, 56 [NASA ADS] [CrossRef] [Google Scholar]
- Fong, W., Margutti, R., Chornock, R., et al. 2016, ApJ, 833, 151 [Google Scholar]
- Fong, W., Laskar, T., Rastinejad, J., et al. 2021, ApJ, 906, 127 [NASA ADS] [CrossRef] [Google Scholar]
- Fong, W.-F., Nugent, A. E., Dong, Y., et al. 2022, ApJ, 940, 56 [NASA ADS] [CrossRef] [Google Scholar]
- Freeman, K. C. 1970, ApJ, 160, 811 [Google Scholar]
- Fruchter, A. S., Levan, A. J., Strolger, L., et al. 2006, Nature, 441, 463 [NASA ADS] [CrossRef] [Google Scholar]
- Fryer, C. L., Woosley, S. E., & Hartmann, D. H. 1999, ApJ, 526, 152 [NASA ADS] [CrossRef] [Google Scholar]
- Gaspari, N., Levan, A. J., Chrimes, A. A., & Nelemans, G. 2024a, MNRAS, 527, 1101 [Google Scholar]
- Gaspari, N., Stevance, H. F., Levan, A. J., Chrimes, A. A., & Lyman, J. D. 2024b, A&A, 692, A21 [NASA ADS] [CrossRef] [EDP Sciences] [Google Scholar]
- Gehrels, N., Chincarini, G., Giommi, P., et al. 2004, ApJ, 611, 1005 [Google Scholar]
- Gompertz, B. P., Levan, A. J., & Tanvir, N. R. 2020, ApJ, 895, 58 [NASA ADS] [CrossRef] [Google Scholar]
- Graham, A. W., & Driver, S. P. 2005, PASA, 22, 118 [NASA ADS] [CrossRef] [Google Scholar]
- Grindlay, J., Portegies Zwart, S., & McMillan, S. 2006, Nat. Phys., 2, 116 [Google Scholar]
- Hernquist, L., & Ostriker, J. P. 1992, ApJ, 386, 375 [Google Scholar]
- Hobbs, G., Lorimer, D. R., Lyne, A. G., & Kramer, M. 2005, MNRAS, 360, 974 [Google Scholar]
- Hurley, J. R., Tout, C. A., & Pols, O. R. 2002, MNRAS, 329, 897 [Google Scholar]
- Iorio, G., Mapelli, M., Costa, G., et al. 2023, MNRAS, 524, 426 [NASA ADS] [CrossRef] [Google Scholar]
- Kelley, L. Z., Ramirez-Ruiz, E., Zemp, M., Diemand, J., & Mandel, I. 2010, ApJ, 725, L91 [NASA ADS] [CrossRef] [Google Scholar]
- Kormendy, J., & Freeman, K. C. 2016, ApJ, 817, 84 [NASA ADS] [CrossRef] [Google Scholar]
- Kouveliotou, C., Meegan, C. A., Fishman, G. J., et al. 1993, ApJ, 413, L101 [NASA ADS] [CrossRef] [Google Scholar]
- Kroupa, P. 2001, MNRAS, 322, 231 [NASA ADS] [CrossRef] [Google Scholar]
- Lee, W. H., & Ramirez-Ruiz, E. 2007, New J. Phys., 9, 17 [NASA ADS] [CrossRef] [Google Scholar]
- Levan, A. J., Wynn, G. A., Chapman, R., et al. 2006, MNRAS, 368, L1 [NASA ADS] [CrossRef] [Google Scholar]
- Levan, A. J., Jakobsson, P., Hurkett, C., et al. 2007, MNRAS, 378, 1439 [CrossRef] [Google Scholar]
- Levan, A. J., Gompertz, B. P., Salafia, O. S., et al. 2024, Nature, 626, 737 [NASA ADS] [CrossRef] [Google Scholar]
- Lima Neto, G. B., Gerbal, D., & Márquez, I. 1999, MNRAS, 309, 481 [Google Scholar]
- Mandel, I. 2016, MNRAS, 456, 578 [Google Scholar]
- Mandel, I. 2021, Res. Notes Am. Astron. Soc., 5, 223 [Google Scholar]
- Mandhai, S., Lamb, G. P., Tanvir, N. R., et al. 2022, MNRAS, 514, 2716 [NASA ADS] [CrossRef] [Google Scholar]
- Metzger, B. D., Quataert, E., & Thompson, T. A. 2008, MNRAS, 385, 1455 [CrossRef] [Google Scholar]
- Moe, M., & Di Stefano, R. 2017, ApJS, 230, 15 [Google Scholar]
- Nakar, E. 2007, Phys. Rep., 442, 166 [NASA ADS] [CrossRef] [Google Scholar]
- Narayan, R., Paczynski, B., & Piran, T. 1992, ApJ, 395, L83 [NASA ADS] [CrossRef] [Google Scholar]
- Nedkova, K. V., Häußler, B., Marchesini, D., et al. 2021, MNRAS, 506, 928 [NASA ADS] [CrossRef] [Google Scholar]
- Nugent, A. E., Fong, W., Dong, Y., et al. 2020, ApJ, 904, 52 [Google Scholar]
- Nugent, A. E., Fong, W.-F., Dong, Y., et al. 2022, ApJ, 940, 57 [NASA ADS] [CrossRef] [Google Scholar]
- O’Connor, B., Troja, E., Dichiara, S., et al. 2021, MNRAS, 502, 1279 [Google Scholar]
- O’Connor, B., Troja, E., Dichiara, S., et al. 2022, MNRAS, 515, 4890 [CrossRef] [Google Scholar]
- O’Doherty, T. N., Bahramian, A., Miller-Jones, J. C. A., et al. 2023, MNRAS, 521, 2504 [CrossRef] [Google Scholar]
- Oke, J. B., & Gunn, J. E. 1982, PASP, 94, 586 [Google Scholar]
- Padilla, N. D., & Strauss, M. A. 2008, MNRAS, 388, 1321 [NASA ADS] [Google Scholar]
- Paterson, K., Fong, W., Nugent, A., et al. 2020, ApJ, 898, L32 [CrossRef] [Google Scholar]
- Perets, H. B., & Beniamini, P. 2021, MNRAS, 503, 5997 [NASA ADS] [CrossRef] [Google Scholar]
- Perna, R., & Belczynski, K. 2002, ApJ, 570, 252 [NASA ADS] [CrossRef] [Google Scholar]
- Perna, R., Artale, M. C., Wang, Y.-H., et al. 2022, MNRAS, 512, 2654 [NASA ADS] [CrossRef] [Google Scholar]
- Planck Collaboration VI. 2020, A&A, 641, A6 [NASA ADS] [CrossRef] [EDP Sciences] [Google Scholar]
- Portegies Zwart, S. F., & Yungelson, L. R. 1998, A&A, 332, 173 [NASA ADS] [Google Scholar]
- Prugniel, P., & Simien, F. 1997, A&A, 321, 111 [NASA ADS] [Google Scholar]
- Qin, B., Wu, X.-P., Chu, M.-C., Fang, L.-Z., & Hu, J.-Y. 1998, ApJ, 494, L57 [NASA ADS] [CrossRef] [Google Scholar]
- Rastinejad, J. C., Gompertz, B. P., Levan, A. J., et al. 2022, Nature, 612, 223 [NASA ADS] [CrossRef] [Google Scholar]
- Richards, S. M., Eldridge, J. J., Briel, M. M., Stevance, H. F., & Willcox, R. 2023, MNRAS, 522, 3972 [Google Scholar]
- Rodríguez, S., & Padilla, N. D. 2013, MNRAS, 434, 2153 [CrossRef] [Google Scholar]
- Rodriguez-Gomez, V., Genel, S., Vogelsberger, M., et al. 2015, MNRAS, 449, 49 [Google Scholar]
- Rodriguez-Gomez, V., Pillepich, A., Sales, L. V., et al. 2016, MNRAS, 458, 2371 [Google Scholar]
- Rouco Escorial, A., Fong, W., Veres, P., et al. 2021, ApJ, 912, 95 [Google Scholar]
- Salafia, O. S., Colombo, A., Gabrielli, F., & Mandel, I. 2022, A&A, 666, A174 [NASA ADS] [CrossRef] [EDP Sciences] [Google Scholar]
- Salvaterra, R., Devecchi, B., Colpi, M., & D’Avanzo, P. 2010, MNRAS, 406, 1248 [Google Scholar]
- Sarin, N., Lasky, P. D., Vivanco, F. H., et al. 2022, Phys. Rev. D, 105, 083004 [NASA ADS] [CrossRef] [Google Scholar]
- Schlafly, E. F., & Finkbeiner, D. P. 2011, ApJ, 737, 103 [Google Scholar]
- Schlegel, D. J., Finkbeiner, D. P., & Davis, M. 1998, ApJ, 500, 525 [Google Scholar]
- Sérsic, J. L. 1963, Boletin de la Asociacion Argentina de Astronomia La Plata Argentina, 6, 41 [Google Scholar]
- Sérsic, J. L. 1968, Atlas de Galaxias Australes (Cordoba: Observatorio Astronomico) [Google Scholar]
- Smith, R., Flynn, C., Candlish, G. N., Fellhauer, M., & Gibson, B. K. 2015, MNRAS, 448, 2934 [Google Scholar]
- Stanway, E. R., & Eldridge, J. J. 2018, MNRAS, 479, 75 [NASA ADS] [CrossRef] [Google Scholar]
- Tacchella, S., Conroy, C., Faber, S. M., et al. 2022, ApJ, 926, 134 [NASA ADS] [CrossRef] [Google Scholar]
- Tauris, T. M., & Takens, R. J. 1998, A&A, 330, 1047 [NASA ADS] [Google Scholar]
- Tauris, T. M., Fender, R. P., van den Heuvel, E. P. J., Johnston, H. M., & Wu, K. 1999, MNRAS, 310, 1165 [NASA ADS] [CrossRef] [Google Scholar]
- Thomas, J., Saglia, R. P., Bender, R., et al. 2009, ApJ, 691, 770 [Google Scholar]
- Troja, E., King, A. R., O’Brien, P. T., Lyons, N., & Cusumano, G. 2008, MNRAS, 385, L10 [NASA ADS] [CrossRef] [Google Scholar]
- Troja, E., Fryer, C. L., O’Connor, B., et al. 2022, Nature, 612, 228 [NASA ADS] [CrossRef] [Google Scholar]
- Tunnicliffe, R. L., Levan, A. J., Tanvir, N. R., et al. 2013, MNRAS, 437, 1495 [Google Scholar]
- Unterborn, C. T., & Ryden, B. S. 2008, ApJ, 687, 976 [Google Scholar]
- van der Wel, A., Franx, M., van Dokkum, P. G., et al. 2014, ApJ, 788, 28 [Google Scholar]
- Verbunt, F., Igoshev, A., & Cator, E. 2017, A&A, 608, A57 [NASA ADS] [CrossRef] [EDP Sciences] [Google Scholar]
- Vigna-Gómez, A., Neijssel, C. J., Stevenson, S., et al. 2018, MNRAS, 481, 4009 [Google Scholar]
- Vitral, E., & Mamon, G. A. 2020, A&A, 635, A20 [EDP Sciences] [Google Scholar]
- Voss, R., & Tauris, T. M. 2003, MNRAS, 342, 1169 [Google Scholar]
- Wiggins, B. K., Fryer, C. L., Smidt, J. M., et al. 2018, ApJ, 865, 27 [NASA ADS] [CrossRef] [Google Scholar]
- Yang, Y.-H., Troja, E., O’Connor, B., et al. 2024, Nature, 626, 742 [NASA ADS] [CrossRef] [Google Scholar]
- Ye, C. S., Fong, W.-F., Kremer, K., et al. 2020, ApJ, 888, L10 [Google Scholar]
- Zemp, M., Ramirez-Ruiz, E., & Diemand, J. 2009, ApJ, 705, L186 [NASA ADS] [CrossRef] [Google Scholar]
- Zevin, M., Kelley, L. Z., Nugent, A., et al. 2020, ApJ, 904, 190 [NASA ADS] [CrossRef] [Google Scholar]
- Zhao, Y., Gandhi, P., Dashwood Brown, C., et al. 2023, MNRAS, 525, 1498 [NASA ADS] [CrossRef] [Google Scholar]
Appendix A: Sample of SGRB host galaxies
Sample of SGRB hosts used in this work.
Appendix B: Merger offsets of NSBH binaries
All Tables
All Figures
|
Fig. 1. Merger times, Tinspiral, and systemic kicks from the second SN, vsys, for BNSs and NSBH binaries from our population synthesis models. The populations were obtained using three different models for the SN natal kicks, namely the Hobbs model (Hobbs et al. 2005), the Verbunt model (Verbunt et al. 2017), and the Bray model (Bray & Eldridge 2016). Distributions from the Bray model present discrete features because the natal kicks from this prescription are weighted by the compact remnant mass output by BPASS, which in turn reflects the discrete grid of input parameters (e.g. initial masses and orbital periods). |
| In the text | |
|
Fig. 2. Predicted and observed merger offsets of BNSs for the subsample of SGRBs in the BRIGHT catalogue (Fong et al. 2022; Nugent et al. 2022) that have a Sérsic fit. The violins show the distributions of predicted offsets assuming either discs (dsc) or spheroids (sph) for the stellar light distribution. The dots show the observed SGRB offsets with their respective errors. We also indicate whether the host galaxy is an early or late type. |
| In the text | |
|
Fig. 3. CDFs of the fraction of BNS mergers within the observed offset F for the fiducial model. Top row: Models where the stellar component is a disc. Bottom row: Models with a spheroid. Left column: Hosts with a Sérsic fit. Central column: Hosts with a Sérsic fit but modelled with the mass-size relation. Right column: All the hosts modelled with the mass-size relation. The shaded areas indicate the uncertainty due to the astrometric error on the observed offset, while the dotted lines indicate the uncertainty due to the spread of the mass-size relation. The host types are shown in the legends. |
| In the text | |
|
Fig. 4. CDFs of the fraction of BNS mergers within the observed offset F. Upper panels: Comparison of models with different natal kick prescriptions, namely the Hobbs model (left column), the Verbunt model (central column), and the Bray model (right column). Distributions in the first row are modelled with Sérsic profiles, while those in the second row are modelled with the mass-size relation. The KS p-value for each CDF with respect to a uniform distributions is shown in each panel. Host types and stellar distribution models are shown in the legend. Lower panels: Comparison of host subsamples at different Pch thresholds, namely ≤20% (left column), ≤10% (central column), and ≤2% (right column). All the remaining assumptions are fiducial; in particular, we are using the Verbunt model for natal kicks. |
| In the text | |
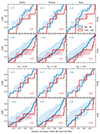 |
Fig. B.1. Same as Fig. 4, but for NSBH mergers. |
| In the text | |
Current usage metrics show cumulative count of Article Views (full-text article views including HTML views, PDF and ePub downloads, according to the available data) and Abstracts Views on Vision4Press platform.
Data correspond to usage on the plateform after 2015. The current usage metrics is available 48-96 hours after online publication and is updated daily on week days.
Initial download of the metrics may take a while.