Open Access
Fig. 3.
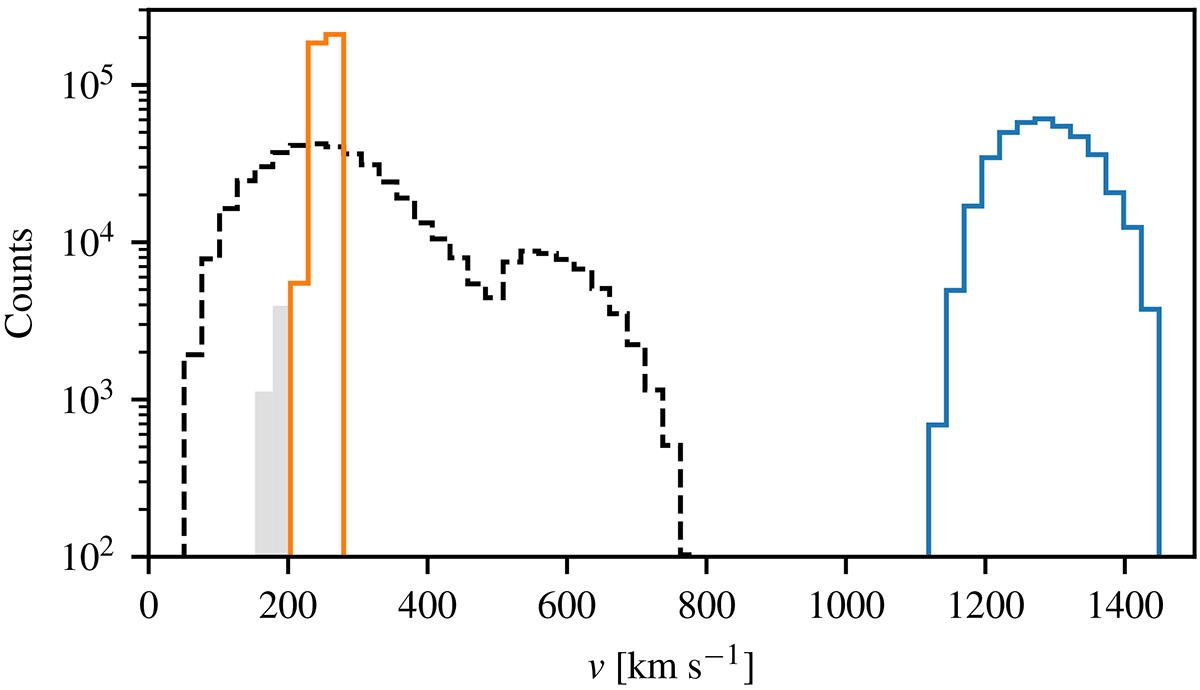
Download original image
Systemic kicks from SN2 and escape velocities in our models. The dashed black line is the systemic kicks distribution predicted by BPASS-TUI. The shaded grey areas are the systems that received a natal kick vk of 30 km s−1. The solid coloured lines are the escape velocities at the locations of SN2, for both galaxies.
Current usage metrics show cumulative count of Article Views (full-text article views including HTML views, PDF and ePub downloads, according to the available data) and Abstracts Views on Vision4Press platform.
Data correspond to usage on the plateform after 2015. The current usage metrics is available 48-96 hours after online publication and is updated daily on week days.
Initial download of the metrics may take a while.