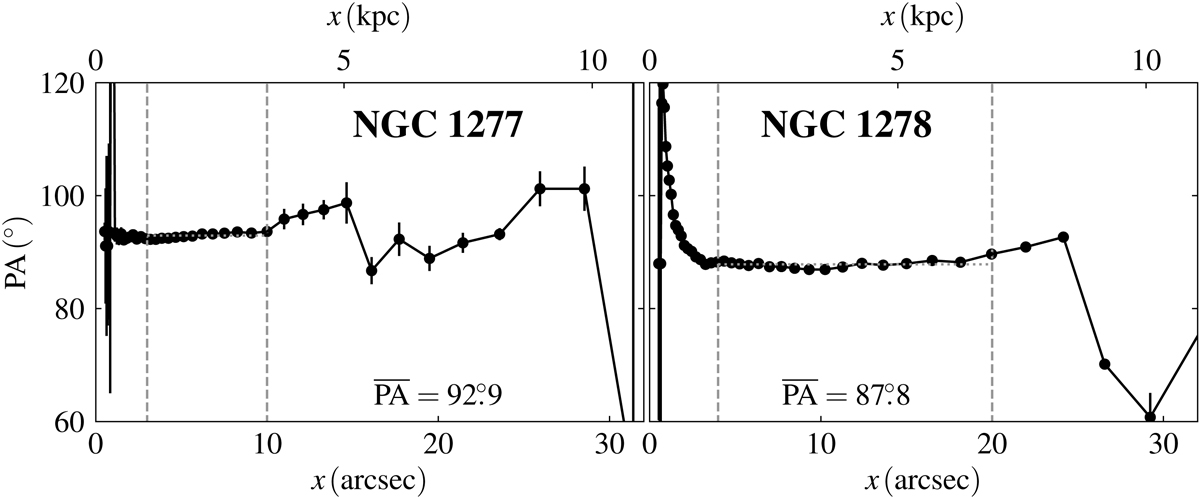
Fig. 6.
Download original image
Position angle as a function of distance along the major axis for the ellipse fit of the HST imaging of NGC 1277 (left) and NGC 1278 (right). The error bars correspond to the one-sigma uncertainties. The vertical dashed lines indicate the radial interval over which the kinematical axis was determined. Its estimated value is indicated by the number in the lower part of the panels and the horizontal dotted lines.
Current usage metrics show cumulative count of Article Views (full-text article views including HTML views, PDF and ePub downloads, according to the available data) and Abstracts Views on Vision4Press platform.
Data correspond to usage on the plateform after 2015. The current usage metrics is available 48-96 hours after online publication and is updated daily on week days.
Initial download of the metrics may take a while.