Fig. 2.

Download original image
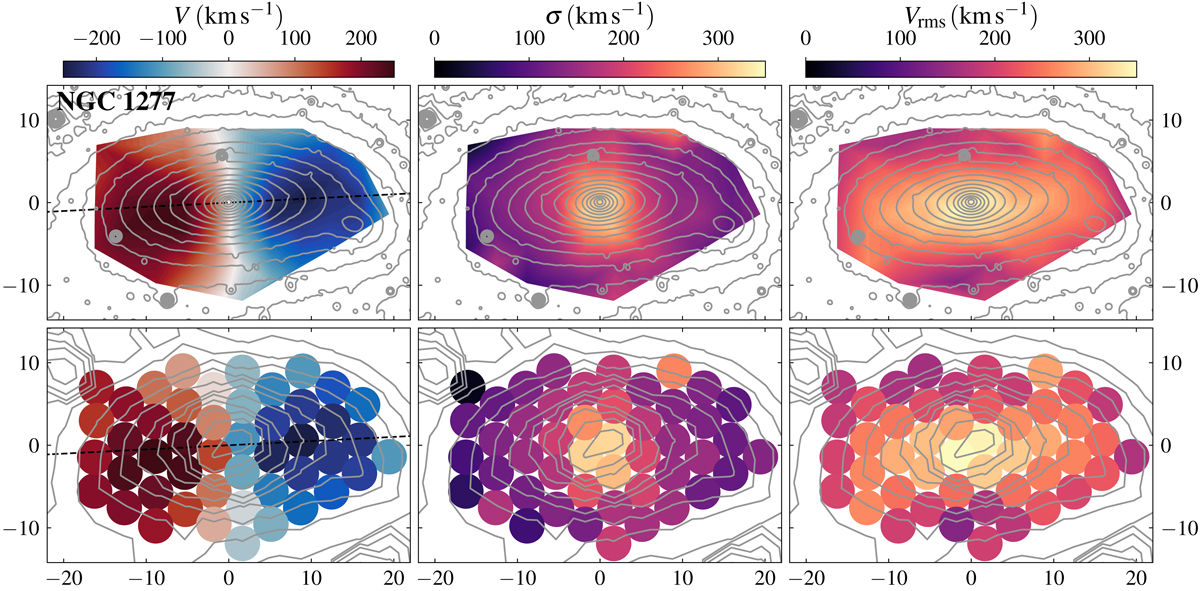
Kinematic maps of NGC 1277. From left to right, V, σ, and Vrms maps of NGC 1277. The dashed line in the left panel indicates the kinematic major axis determined with kinemetry. The top row shows an interpolated version of the maps, whereas the lower one shows the individual fibre values. The grey contours denote isophotes separated by 0.5 mag arcsec−2 intervals obtained from an HST F625W image (top row) and from the integral field data integrated between 6150 Å and 6650 Å (lower row). The axes are in units of arcseconds.
Current usage metrics show cumulative count of Article Views (full-text article views including HTML views, PDF and ePub downloads, according to the available data) and Abstracts Views on Vision4Press platform.
Data correspond to usage on the plateform after 2015. The current usage metrics is available 48-96 hours after online publication and is updated daily on week days.
Initial download of the metrics may take a while.


