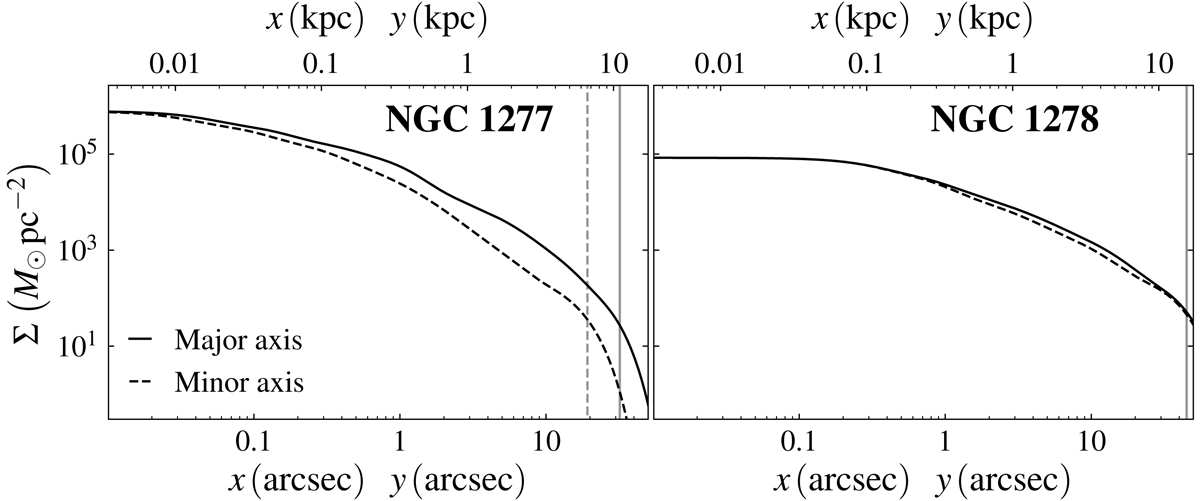
Fig. 11.
Download original image
Major- (continuous line and coordinate x) and minor-axis (dashed line and coordinate y) stellar surface density profiles of NGC 1277 (left panel) and NGC 1278 (right panel). The vertical grey lines are as in Fig. 10. The surface density estimates were calculated by deriving pixel-to-pixel mass-to-light ratios from colours following the prescriptions in Roediger & Courteau (2015), and assuming a Salpeter IMF.
Current usage metrics show cumulative count of Article Views (full-text article views including HTML views, PDF and ePub downloads, according to the available data) and Abstracts Views on Vision4Press platform.
Data correspond to usage on the plateform after 2015. The current usage metrics is available 48-96 hours after online publication and is updated daily on week days.
Initial download of the metrics may take a while.