| Issue |
A&A
Volume 675, July 2023
|
|
|---|---|---|
| Article Number | A48 | |
| Number of page(s) | 11 | |
| Section | Stellar structure and evolution | |
| DOI | https://doi.org/10.1051/0004-6361/202346134 | |
| Published online | 30 June 2023 | |
X-ray pulsar GRO J1008−57 as an orthogonal rotator
1
Department of Physics and Astronomy, University of Turku, 20014 Turku, Finland
e-mail: This email address is being protected from spambots. You need JavaScript enabled to view it.
2
Institut für Astronomie und Astrophysik, Universität Tübingen, Sand 1, 72076 Tübingen, Germany
3
Astrophysics, Department of Physics, University of Oxford, Denys Wilkinson Building, Keble Road, Oxford, OX1 3RH
UK
4
INAF – Istituto di Astrofisica e Planetologia Spaziali, Via del Fosso del Cavaliere 100, 00133 Roma, Italy
5
University of British Columbia, Vancouver, BC V6T 1Z4
Canada
6
International Space Science Institute, Hallerstrasse 6, 3012 Bern, Switzerland
7
MIT Kavli Institute for Astrophysics and Space Research, Massachusetts Institute of Technology, 77 Massachusetts Avenue, Cambridge, MA, 02139
USA
8
Astronomical Institute of the Czech Academy of Sciences, Boční II 1401/1, 14100 Praha 4, Czech Republic
9
Dipartimento di Fisica e Astronomia, Università degli Studi di Padova, Via Marzolo 8, 35131 Padova, Italy
10
Dipartimento di Matematica e Fisica, Università degli Studi Roma Tre, Via della Vasca Navale 84, 00146 Roma, Italy
11
Instituto de Astrofísicade Andalucía – CSIC, Glorieta de la Astronomía s/n, 18008 Granada, Spain
12
INAF – Osservatorio Astronomico di Roma, Via Frascati 33, 00040 Monte Porzio Catone (RM), Italy
13
Space Science Data Center, Agenzia Spaziale Italiana, Via del Politecnico snc, 00133 Roma, Italy
14
INAF – Osservatorio Astronomico di Cagliari, Via della Scienza 5, 09047 Selargius (CA), Italy
15
Istituto Nazionale di Fisica Nucleare, Sezione di Pisa, Largo B. Pontecorvo 3, 56127 Pisa, Italy
16
Dipartimento di Fisica, Università di Pisa, Largo B. Pontecorvo 3, 56127 Pisa, Italy
17
NASA Marshall Space Flight Center, Huntsville, AL, 35812
USA
18
Istituto Nazionale di Fisica Nucleare, Sezione di Torino, Via Pietro Giuria 1, 10125 Torino, Italy
19
Dipartimento di Fisica, Università degli Studi di Torino, Via Pietro Giuria 1, 10125 Torino, Italy
20
INAF – Osservatorio Astrofisico di Arcetri, Largo Enrico Fermi 5, 50125 Firenze, Italy
21
Dipartimento di Fisica e Astronomia, Università degli Studi di Firenze, Via Sansone 1, 50019 Sesto Fiorentino (FI), Italy
22
Istituto Nazionale di Fisica Nucleare, Sezione di Firenze, Via Sansone 1, 50019 Sesto Fiorentino (FI), Italy
23
Agenzia Spaziale Italiana, Via del Politecnico snc, 00133 Roma, Italy
24
Science and Technology Institute, Universities Space Research Association, Huntsville, AL, 35805
USA
25
Istituto Nazionale di Fisica Nucleare, Sezione di Roma “Tor Vergata”, Via della Ricerca Scientifica 1, 00133 Roma, Italy
26
Department of Physics and Kavli Institute for Particle Astrophysics and Cosmology, Stanford University, Stanford, CA, 94305
USA
27
RIKEN Cluster for Pioneering Research, 2-1 Hirosawa, Wako, Saitama, 351-0198
Japan
28
California Institute of Technology, Pasadena, CA, 91125
USA
29
Yamagata University, 1-4-12 Kojirakawa-machi, Yamagata-shi, 990-8560
Japan
30
Osaka University, 1-1 Yamadaoka, Suita, Osaka, 565-0871
Japan
31
International Center for Hadron Astrophysics, Chiba University, Chiba, 263-8522
Japan
32
Institute for Astrophysical Research, Boston University, 725 Commonwealth Avenue, Boston, MA, 02215
USA
33
Department of Astrophysics, St. Petersburg State University, Universitetsky pr. 28, Petrodvoretz, 198504 St. Petersburg, Russia
34
Department of Physics and Astronomy and Space Science Center, University of New Hampshire, Durham, NH, 03824
USA
35
Physics Department and McDonnell Center for the Space Sciences, Washington University in St. Louis, St. Louis, MO, 63130
USA
36
Finnish Centre for Astronomy with ESO, 20014 University of Turku, Finland
37
Istituto Nazionale di Fisica Nucleare, Sezione di Napoli, Strada Comunale Cinthia, 80126 Napoli, Italy
38
Université de Strasbourg, CNRS, Observatoire Astronomique de Strasbourg, UMR 7550, 67000 Strasbourg, France
39
Graduate School of Science, Division of Particle and Astrophysical Science, Nagoya University, Furo-cho, Chikusa-ku, Nagoya, Aichi, 464-8602
Japan
40
Hiroshima Astrophysical Science Center, Hiroshima University, 1-3-1 Kagamiyama, Higashi-Hiroshima, Hiroshima, 739-8526
Japan
41
University of Maryland, Baltimore County, Baltimore, MD, 21250
USA
42
NASA Goddard Space Flight Center, Greenbelt, MD, 20771
USA
43
Center for Research and Exploration in Space Science and Technology, NASA/GSFC, Greenbelt, MD, 20771
USA
44
Department of Physics, University of Hong Kong, Pokfulam, Hong Kong
45
Department of Astronomy and Astrophysics, Pennsylvania State University, University Park, PA, 16801
USA
46
Université Grenoble Alpes, CNRS, IPAG, 38000 Grenoble, France
47
Center for Astrophysics, Harvard & Smithsonian, 60 Garden St, Cambridge, MA, 02138
USA
48
INAF – Osservatorio Astronomico di Brera, Via E. Bianchi 46, 23807 Merate (LC), Italy
49
Dipartimento di Fisica, Università degli Studi di Roma “Tor Vergata”, Via della Ricerca Scientifica 1, 00133 Roma, Italy
50
Department of Astronomy, University of Maryland, College Park, MD, 20742
USA
51
Mullard Space Science Laboratory, University College London, Holmbury St Mary, Dorking, Surrey, RH5 6NT
UK
52
Anton Pannekoek Institute for Astronomy & GRAPPA, University of Amsterdam, Science Park 904, 1098 XH Amsterdam, The Netherlands
53
Guangxi Key Laboratory for Relativistic Astrophysics, School of Physical Science and Technology, Guangxi University, Nanning, 530004
PR China
Received:
13
February
2023
Accepted:
5
May
2023
Abstract
X-ray polarimetry is a unique way to probe the geometrical configuration of highly magnetized accreting neutron stars (X-ray pulsars). GRO J1008−57 is the first transient X-ray pulsar observed at two different flux levels by the Imaging X-ray Polarimetry Explorer (IXPE) during its outburst in November 2022. We find the polarization properties of GRO J1008−57 to be independent of its luminosity, with the polarization degree varying between nondetection and about 15% over the pulse phase. Fitting the phase-resolved spectro-polarimetric data with the rotating vector model allowed us to estimate the pulsar inclination (130°, which is in good agreement with the orbital inclination), the position angle (75°) of the pulsar spin axis, and the magnetic obliquity (∼74°). This makes GRO J1008−57 the first confidently identified nearly orthogonal rotator among X-ray pulsars. We discuss our results in the context of the neutron star atmosphere models and theories of the axis alignment of accreting pulsars.
Key words: accretion / accretion disks / magnetic fields / pulsars: individual: GRO J1008−57 / stars: neutron / X-rays: binaries
Deceased.
© The Authors 2023
 Open Access article, published by EDP Sciences, under the terms of the Creative Commons Attribution License (https://creativecommons.org/licenses/by/4.0), which permits unrestricted use, distribution, and reproduction in any medium, provided the original work is properly cited.
This article is published in open access under the Subscribe to Open model. This email address is being protected from spambots. You need JavaScript enabled to view it. to support open access publication.
1. Introduction
The physics of the interaction of astrophysical plasmas with ultrastrong magnetic and radiation fields in the vicinity of neutron stars (NSs) is reflected in the observed properties of accreting X-ray pulsars (XRPs; see Mushtukov & Tsygankov 2022, for a recent review). Therefore, the analysis of observational data can, in principle, be used to study the complex interplay of several physical processes defining such interactions. However, the sheer complexity of the problem together with the large uncertainty in the basic geometry of pulsar emission regions have so far limited the potential of X-ray pulsars as laboratories for studying physics under extreme conditions. The situation might change with the launch of the first imaging space X-ray polarimeter, the Imaging X-ray Polarimeter Explorer (IXPE, Weisskopf et al. 2022), which has opened a new observational window onto X-ray pulsars and is considered to be a unique tool with which to break several model degeneracies through independent constraints on the geometrical parameters of the system. During the first year of operation in orbit, IXPE observed several XRPs, yielding results that are at surprising variance with pre-launch theoretical predictions (Doroshenko et al. 2022; Tsygankov et al. 2022). In particular, the emission of XRPs was expected to be strongly polarized (up to 80%; see, e.g., Meszaros et al. 1988; Caiazzo & Heyl 2021; Becker & Wolff 2022), and a significantly lower polarization degree (PD) was expected to only be theoretically possible at low accretion rates due to the inverse temperature profile in the atmosphere of an accreting NS (González-Caniulef et al. 2019; Mushtukov et al. 2021). However, it was found that even bright XRPs (with luminosities exceeding 1037 erg s−1) show PDs of well below 20%, even in the phase-resolved data (Doroshenko et al. 2022; Marshall et al. 2022; Tsygankov et al. 2022).
The cause at the basis of this discrepancy is unclear and can be related not only to the physics within the emission region, but also to the potential complexity of the geometry of the emission region itself, and of the accretion flow, which may affect the observed polarization signal. Different sites of the polarized emission in the NS vicinity were discussed by Tsygankov et al. (2022), who proposed, in particular, (i) intrinsic polarization from polar hotspots, (ii) reflection of the emission by the NS surface, (iii) reflection by the accretion curtain, (iv) reflection by the accretion disk, (v) scattering by the stellar wind, and (vi) reflection by the optical companion. Therefore, to exclude the geometrical factor, probing different scenarios of polarization production in the NS atmosphere requires multiple observations of the same source at different mass-accretion rates.
The most obvious candidates for such an observational campaign are transient XRPs with a Be optical companion (Be/XRP; see Reig 2011, for a review) that exhibit regular outbursts every orbital cycle due to enhanced accretion rate at around the time of periastron passage. One of the most predictable and best-studied Be/XRPs is GRO J1008–57 (Kühnel et al. 2013). This object was discovered in 1993 by the BATSE instrument on board the Compton Gamma-Ray Observatory as a transient XRP with a spin period of 93.587 ± 0.005 s (Stollberg et al. 1993). GRO J1008–57 shows giant Type II and Type I (associated with the periastron passage) outbursts, which are related to the Be type of the optical companion (B1-B2 Ve star; Coe et al. 2007). The typical peak luminosity of the source during the Type I outburst is about 1037 erg s−1, with Type II outbursts being several times brighter, reaching ∼5 × 1037 erg s−1. The distance to GRO J1008–57 was recently updated using the Gaia data to 3.6 ± 0.2 kpc (Fortin et al. 2022). The orbital parameters of the binary system are known as well: the orbital period Porb = 249.48 ± 0.04 d, the projected semi-major axis ax sin i = 530 ± 60 lt s, the longitude of periastron ω = −26 ± 8 deg, and the eccentricity e = 0.68 ± 0.02 (Coe et al. 2007; Kühnel et al. 2013).
The broadband energy spectrum of GRO J1008–57 is known to depend on the source luminosity and exhibits a double-hump structure at the lowest fluxes (Lutovinov et al. 2021), which is typical of low-luminosity XRPs (see, e.g., Tsygankov et al. 2019b,a). The cyclotron absorption feature at ∼88 keV in the energy spectrum of the source was first discovered in the CGRO/OSSE data (Shrader et al. 1999) and was later confirmed by Suzaku and NuSTAR as the fundamental at Ecyc = 75 − 78 keV (Yamamoto et al. 2013; Bellm et al. 2014) and by Insight-HXMT at Ecyc = 90.3 keV (Ge et al. 2020). This makes GRO J1008–57 an XRP with one of the strongest confirmed magnetic fields, of around 1013 G. Recently, it was shown that even between periastron passages, the NS continues to steadily accrete matter from the recombined accretion disc, which emits at a level of ∼1034 − 1035 erg s−1 (Tsygankov et al. 2017a,b).
Here, we present the results of the analysis of GRO J1008–57 observations performed by IXPE during the source periastron passage in two different luminosity states. First, we describe the observations and the data-reduction procedures in Sect. 2. The results are presented in Sect. 3. We then discuss possible sources of the observed polarization and the geometry of the pulsar in Sect. 4, and finally summarize our results and present conclusions in Sect. 5.
2. Data
The IXPE is a NASA mission in partnership with the Italian Space Agency, and was launched on 2021 December 9. It consists of three identical grazing incidence telescopes, providing imaging polarimetry over the 2–8 keV energy band with a time resolution of the order of 10 μs. Each telescope comprises an X-ray mirror assembly and a polarization-sensitive detector unit (DU) equipped with a gas-pixel detector (Soffitta et al. 2021; Baldini et al. 2021). A detailed description of the observatory and its performance is given in Weisskopf et al. (2022).
IXPE observed GRO J1008–57 twice during the same Type I outburst over the periods of 2022 Nov. 13–14 and Nov. 18–20 with a total effective exposure of ≃85 ks and ≃102 ks, respectively. Level 2 data were processed with the IXPEOBSSIM package (Baldini et al. 2022) version 30.2.11 using the Calibration database released on 2022 November 17.
Source photons were collected from a circular region with radius Rsrc of 60″ centered on the source position. Following the prescription by Di Marco et al. (2023) for the sources with high count rate (≳2 cnt s−1), the background has not been subtracted from the data, because it is negligible. For the timing analysis, the photon arrival times were corrected to the Solar System barycenter using the standard barycorr tool from the FTOOLS package, with the effects of binary motion also taken into account using the orbital parameters from Kühnel et al. (2013).
For the spectro-polarimetric analysis, the flux (Stokes parameter I) energy spectra have been binned to have at least 30 counts per energy channel. The same energy binning has also been applied to the spectra of the Stokes parameters Q and U. Taking into account the high number of source counts and low background level, the unweighted approach has been applied. All the spectra were fitted using the XSPEC package version 12.12.1 (Arnaud 1996) and version 12 of the instrument response functions, and applying the χ2 statistic. The uncertainties are given at the 68.3% confidence level unless stated otherwise.
3. Results
3.1. Timing analysis
The long-term light curve of GRO J1008–57 obtained with the MAXI all-sky monitor (Matsuoka et al. 2009)2 is shown in Fig. 1 along with source light curves as observed by IXPE during the two observations, which differ by a factor of ∼2 in flux. In the low state, the observed luminosity in the 2–8 keV range was about Llow = 8.6 × 1035 erg s−1, while the bright state had Lhigh = 1.6 × 1036 erg s−1. The source did not exhibit any significant variability within either individual observation, which allowed us to average all the available data. To study the effect of different mass-accretion rates on the polarization properties, the two observations were first analyzed independently.
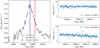 |
Fig. 1. Light curve of GRO J1008–57 during the November 2022 outburst. Left: long-term light curve in the 4–10 keV energy band obtained by the MAXI all-sky monitor (black points). Blue and red shaded stripes show the time periods of the first and second IXPE observations, respectively. Right: light curves of GRO J1008–57 in the 2–8 keV energy band summed over three modules of IXPE during the first (top) and second (bottom) observation. |
The high counting statistics allowed us to measure the spin period of the NS with good accuracy, Pspin-high = 93.133(3) s and Pspin-low = 93.146(4) s, in the first and second IXPE observations, respectively (the reported values and uncertainties are estimated using the phase-connection technique following Deeter et al. 1981). The pulsed fraction – defined as PF = (Fmax − Fmin)/(Fmax + Fmin), where Fmax and Fmin are the maximum and minimum count rates in the pulse profile constructed using 80 phase bins – was found to be around 60% in both flux states. The resulting pulse profiles in four energy bands are shown in Fig. 2. The pulse profile has a double-peaked shape with the first peak gradually disappearing at higher energies, which is peculiar for this source (see, e.g., Naik et al. 2011). We see that the pulse profiles in the two luminosity states agree well, which already indicates a lack of significant changes in the accretion geometry.
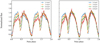 |
Fig. 2. Pulse profile of GRO J1008–57 in different energy bands as seen by IXPE in the bright (left) and low (right) states. Data from the three telescopes were combined. The zero phase was chosen to coincide for both observations using cross-correlation of the profiles. |
3.2. Polarimetric analysis
To understand whether also the polarimetric analysis supports this conclusion, we conducted pulse phase-averaged and phase-resolved analysis of IXPE data for both observations individually. First, we performed the polarimetric analysis of the data using the formalism by Kislat et al. (2015) implemented in the IXPEOBSSIM package (Baldini et al. 2022) under the pcube algorithm in the xpbin tool. Phase-averaged analysis in the 2–8 keV energy band resulted in low PD values of 4.1 ± 0.9% and 3.4 ± 1.1% for the bright and low states, respectively, with corresponding polarization angle (PA, measured from north to east) values of  and
and  ; that is, the results are consistent within uncertainties. However, we note that, because the PA is expected to be strongly variable over the pulsar spin phase, these phase-averaged results do not contain a significant amount of useful information.
Therefore, as the next step, we performed a phase-resolved polarimetric analysis. For that, we used all the available data in each observation in the 2–8 keV band binned into 14 phase bins. The number of phase bins was selected to trace the strongly variable PA from one side and to get sufficiently high statistics from another. The results are shown in Figs. 3 and 4. We see that the normalized Stokes parameters q = Q/I and u = U/I are indeed strongly variable over the pulse phase, resulting in a relatively low phase-averaged PD value.
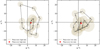 |
Fig. 3. Variations of the normalized Stokes parameters q and u with the pulsar phase, averaged over all DUs in the 2–8 keV energy band (beige circles and arrows) for the bright (left) and low (right) states of GRO J1008–57. Each circle corresponds to a specific phase bin, numbered successively following the binning shown in Fig. 4. The circle radius represents the 1σ uncertainty value. The phase-averaged value is shown with a red cross in the corresponding panel. |
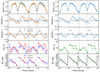 |
Fig. 4. Dependence of the normalized flux in the 2–8 keV energy band, normalized Stokes parameters q and u (based on the formalism by Kislat et al. 2015), PD, and PA (from the spectro-polarimetric analysis) on the pulse phase for two IXPE observations separately (left) and combined (right). Data from the three IXPE telescopes are combined. Vertical dash-dotted lines show the positions of two minima in the profile and are added for illustrative purposes. The black solid line in the bottom right panel shows the best-fit rotating vector model (see Sect. 4.2). |
To properly take the energy dispersion and the spectral shape into account, we also conducted a spectro-polarimetric analysis through a joint fit of the I, Q, and U spectra (prepared with the PHA1, PHA1Q, and PHA1U algorithms in the xpbin tool) using the XSPEC package (see Strohmayer 2017). Although the broadband spectrum of the source depends on the luminosity, below 10 keV its shape can be described with a simple absorbed power law in a very broad range of luminosities (Tsygankov et al. 2017a). To account for the remaining calibration uncertainties in the IXPE data, as well as possible spectral complexity due to variations of the spectral parameters with phase, we used a more flexible model of a power law with the high-energy exponential rolloff (cutoffpl in XSPEC) to model the phase-averaged spectra.
We first applied the model consisting of a rolloff power law modified by the interstellar absorption (tbabs in XSPEC with abundances adopted from Wilms et al. 2000) to the phase-averaged data in the bright and low states, separately. The rolloff power-law component was combined with a constant polarization model (energy-independent PD and PA), polconst in XSPEC. An additional multiplicative constant const was introduced to account for possible discrepancies in absolute effective area calibration of independent DUs; the constant was fixed to unity for DU1, taken as a reference. The final form of the model in XSPEC is const×tbabs×polconst×cutoffpl.
As a result, we obtained polarization parameters fully consistent with values obtained from the energy-binned analysis using the pcube algorithm. The parameters of the best-fit model are presented in Table 1. The quality of the obtained fits for both observations can be seen from Fig. 5, where the energy spectra for I, Q, and U Stokes parameters are shown with the corresponding residuals.
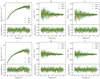 |
Fig. 5. Energy distributions of the Stokes parameters I, Q, and U for the bright (upper plots) and low (lower plots) states of GRO J1008–57 with the best-fit model shown with the black solid line. The residuals between the data and the model normalized for the errors are shown in the bottom panels of the corresponding plots. The different colors represent the three IXPE detectors: DU1 in blue, DU2 in orange, and DU3 in green. |
Spectral parameters for the best-fit model for the two flux states of the source, separately and combined; uncertainties are at 68.3% CL.
To study the energy spectrum and polarization properties of GRO J1008–57 as a function of the spin phase, we performed the phase-resolved spectro-polarimetric analysis using the same 14 phase bins as above. For the spectral fit, we used a simpler continuum model consisting of a power law (const×tbabs×powerlaw×polconst) with the cross-calibration constants fixed at the values derived from the phase-averaged analysis (see Table 1). The fit results (the PD and PA values) are presented in Fig. 4.
We see from Fig. 4 that there is no significant difference in the polarization properties of the source during different observations. Therefore, to increase the counting statistics, we combined the data from both observations after the phase alignment using the broadband pulse profiles. After that, we repeated both phase-averaged and phase-resolved spectro-polarimetric analysis applying the same phase binning and spectral model. To take into account the dependence of the spectral shape on the GRO J1008–57 luminosity in the joint fit, we allowed the absorption value NH, the photon index, and the normalization to vary independently in the two data sets, whereas PD and PA were tied. In the phase-resolved analysis, all these parameters (including NH) were allowed to vary over the spin phase to reflect possible inhomogeneities in the flow of matter around the NS. An energy-binned (pcube) analysis was performed on the combined dataset as well. The obtained results are summarized in Figs. 4 and 6 and Tables 1 and 2.
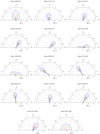 |
Fig. 6. Polarization vectors as a function of the phase of GRO J1008–57 based on the spectral fitting of the combined data from both IXPE observations. In each plot, the PD and PA contours at 68.27%, 95.45%, and 99.73% confidence levels (red, green and blue, respectively) are shown in polar coordinates for 14 different phase intervals (coinciding with the ones defined in Fig. 4). |
Spectral parameters for the phase-resolved spectro-polarimetric analysis of the combined data.
Modification of the polconst polarization component of the best-fit model with pollin and polpow, which correspond to a linear and a power-law dependence of PD and PA on energy, respectively, did not lead to any significant improvement of the fit quality. Namely, for the phase-averaged data combined over both observations, this modification resulted in Δχ2 ∼ 1 for 2 d.o.f. for both pollin and polpow models. For the phase-resolved data, and for each phase independently, the Δχ2 value did not exceed ∼5 for 2 d.o.f. with a corresponding F-test probability of ∼0.1. To increase the counting statistics in order to reveal the energy dependence of PD, we applied the method proposed by Mushtukov et al. (2023). Namely, we simultaneously fitted spectra from all 14 phase bins using the pollin model with the PAs frozen at the predictions of the geometrical model discussed in Sect. 4.2. Photon indices were fixed at the values presented in Table 2 and the PD parameters (i.e., normalization at 1 keV, A1, and the slope of energy dependence, Aslope) were tied for all phases in both observations. As a result, we obtained a phase-averaged PD at 1 keV of A1 = 3.5%±1.8% and a slope of Aslope = 2.1%±0.6% keV−1. The significance of the improvement of the fit with the pollin model compared to polconst based on the F-test is 2 × 10⁻⁴. This can be considered as a strong indication that the PD of GRO J1008–57 depends on energy. A similar conclusion was recently reached by Forsblom et al. (2023) and Mushtukov et al. (2023) for Vela X-1 and X Persei, respectively.
4. Discussion
4.1. Polarization mechanisms
Under the condition of a strong magnetic field, the medium experiences birefringence when the phase velocity of photons depends on their polarization state. In this case, the photons tend to propagate in the form of two orthogonal polarization modes: the ordinary (O-mode) and extraordinary (X-mode) ones (Gnedin & Pavlov 1974). The polarization of both modes is close to linear. The electric field vector of the X-mode photons oscillates perpendicular to the ambient magnetic field direction, while the electric vector of O-mode photons has a component along the field. The cross sections of the major processes of interaction between radiation and matter are strongly dependent on the polarization mode (see, e.g., Pavlov & Gnedin 1984; Harding & Lai 2006). Below the cyclotron resonance, the cross sections for photons of the O-mode tend to be significantly larger in comparison to the cross sections of X-mode photons. Consequently, one can expect the flux leaving the NS atmosphere to be dominated by the X-mode photons, resulting in a high PD value; however, this value is also dependent on the specific structure of the atmosphere.
As already mentioned in Sect. 3.2, we did not find any significant difference in the polarization properties of GRO J1008–57 between the two states, with the luminosity differing by a factor of two. We note that the geometry of the emitting regions at the NS surface in XRPs is known to depend on accretion luminosity, and in particular is expected to change dramatically with the onset of an accretion column. Indeed, if the luminosity is below the critical level (Basko & Sunyaev 1976), the radiative force in the vicinity of the NS surface is small and the accretion process results in the emitting regions having a hotspot geometry. If the luminosity reaches the critical value, the radiative force becomes sufficiently high to stop the accreting material above the NS surface in a radiation-dominated shock, resulting in an extended accretion column above the stellar magnetic poles. Taking into account the cyclotron energy observed in GRO J1008–57 at around 80 keV and the corresponding surface magnetic field strength ∼1013 G, one would expect the critical luminosity Lcrit to be a few times 1037 erg s−1 (Mushtukov et al. 2015). This is an order of magnitude higher than the observed luminosity level in both observations. We therefore expect the radiative force in the vicinity of the NS surface to have no affect on the dynamics of the accretion flow, and expect the X-ray photons to be emitted from hotspots in both IXPE observations. Therefore, the lack of dramatic changes in the emission region geometry is not surprising.
At subcritical mass-accretion rates, the flow is decelerated in the atmosphere of the NS via Coulomb collisions, resulting in an inverse temperature profile with hotter upper layers and a cooler underlying atmosphere (Zel’dovich & Shakura 1969; Suleimanov et al. 2018). The typical braking distance of the accretion flow in the atmosphere depends on the flow velocity (Nelson et al. 1995), which is similar in the two states of GRO J1008–57, and is not affected by the mass-accretion rate. Therefore, the relative distribution of energy release in the atmosphere is expected to be very similar. The absolute value of the local temperature can be different due to different levels of local energy release. On the other hand, considering that the accretion luminosity in the two observations changes by only a factor ∼2, the local temperature is also not expected to change significantly (i.e., by a factor of only 21/4). For this reason, we do not expect significant variations in polarization in the two observed states.
Detailed analysis of the radiative transfer problem in the atmosphere of a NS shows that the polarization composition of X-ray flux leaving the atmosphere is strongly affected by the temperature structure and relative contribution of magnetized vacuum and plasma to the dielectric tensor of the medium. At a certain optical depth in the atmosphere of the NS, the contributions from magnetized vacuum and plasma become comparable, which leads to the mixing of polarization modes, a phenomenon called vacuum resonance. It appears that the optical depth of the vacuum resonance in the atmosphere influences the final contribution of X- and O-modes to the X-ray energy flux leaving the NS atmosphere. In particular, the low PD observed in both states of GRO J1008–57 can be explained if the position of the vacuum resonance and corresponding mode conversion in the atmosphere is located in the transition region where there are strong temperature and mass density gradients, that is, at the border between the overheated upper layer and colder underlying atmosphere (see details in Doroshenko et al. 2022).
The correlation between the PD and the flux observed during the pulsation period (see Fig. 4) agrees with the expected inverse temperature profile when the accretion luminosity is well below the critical value. Under this condition, the beam pattern of the X-ray radiation emitted at the magnetic poles is suppressed along the normal to the stellar surface (because hotter upper layers contribute more to the flux leaving the atmosphere at a larger angle to the normal), while the PD tends to increase with the angle between the normal and the direction along which the photon leaves the atmosphere because of the stronger dependence of cross sections on X-ray polarization at the larger angles (Mushtukov et al. 2021; Sokolova-Lapa et al. 2021). When the mass-accretion rate is close to the critical one, as in the case of Cen X-3, the beam pattern can already be affected by the scattering of X-ray photons by the accretion flow above the NS magnetic poles, leading to the apparent anti-correlation between the PD and the pulsed flux (see discussion section in Tsygankov et al. 2022).
4.2. Geometry of the system
In order to determine the geometrical parameters of the pulsar, we followed the procedures described in Doroshenko et al. (2022) and Tsygankov et al. (2022). Namely, we fitted the spin-phase variations of the PA of GRO J1008–57 with the rotating-vector model (RVM; Radhakrishnan & Cooke 1969; Poutanen 2020). The applicability of this model – which assumes the dipole configuration of the NS magnetic field – to XRPs, where the magnetic field near the star can be more complicated, has been discussed in several papers (e.g., González-Caniulef et al. 2023; Taverna et al. 2022). Specifically, the applicability is justified by the birefringence properties of vacuum (Gnedin et al. 1978) causing the radiation propagation in two normal modes until the polarization-limiting radius (Budden 1952; Heyl & Shaviv 2002; Heyl & Caiazzo 2018). For a typical XRP, this radius is about 20 stellar radii (∼250 km), which is much larger than the star and therefore we expect the field configuration there to be dipolar.
If radiation escapes in the O-mode, the PA can be described by the RVM, following the expression (Poutanen 2020)
 (1)
(1)
where ip is the pulsar inclination (i.e., the angle between the pulsar spin vector and the line-of-sight), χp is the position angle of the pulsar spin axis, θ is the magnetic obliquity (i.e., the angle between the magnetic dipole and the spin axes), ϕ is the pulse phase, and ϕ0 is the phase when the magnetic pole is closest to the observer.
The pulse-phase dependence of the PA obtained from the spectro-polarimetric analysis of the combined data was fitted with the RVM using the affine invariant Markov chain Monte Carlo ensemble sampler EMCEE package of PYTHON (Foreman-Mackey et al. 2013). All the parameters in Eq. (1) were left free. As a result, we obtained accurate estimates of the pulsar inclination,  , the co-latitude of the magnetic pole,
  , and the position angle of the pulsar spin,
  (see Figs. 4 and 7). However, the pulsar spin-axis position angle is not determined uniquely and can be directed in the opposite direction at
  because only the orientation of the polarization plane can be measured. Also, if radiation escapes in the X-mode, then the pulsar spin is oriented at χp = χp, X = χp, O ± 90°. The obtained geometrical parameters were verified using the RVM fit to the unbinned Stokes parameters on a photon-by-photon basis as outlined in González-Caniulef et al. (2023) and Marshall (2021). We find that the PD and PA obtained in this way is nearly identical to those shown in Fig. 4.
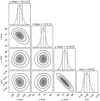 |
Fig. 7. Corner plot of the posterior distribution for the RVM parameters for the pulsar geometry obtained using the PA values from the phase-resolved spectro-polarimetric analysis of the combined data. The two-dimensional contours correspond to 68.27%, 95.45%, and 99.73% confidence levels. The histograms show the normalized one-dimensional distribution for each parameter derived from the posterior samples. The mean value and 1σ confidence interval for the derived parameters are presented above the corresponding histogram (dashed lines). |
Furthermore, the inclination of the pulsar estimated from IXPE data (ip ≃ 130°) appears to be close to the orbital inclination of ∼144° estimated by Coe et al. (2007) based on an analysis of the Hα emission line profile from a circumbinary Be disk3. Although the accuracy of the latter estimate might be debated, it indicates that the accretion torques had sufficient time to align the spin and orbital axes. Very rough estimates result in alignment timescales of the order of ≲105 yr for a NS with a strong magnetic field (see Eq. (16) in Biryukov & Abolmasov 2021).
It is interesting to note that the resulting determination of the co-latitude of the magnetic pole points to a very high value of θ ≈ 75°, which tells us that GRO J1008–57 is an almost orthogonal rotator. This finding is in stark contrast with results for Cen X-3 and Her X-1, where the magnetic obliquity was much lower, at about 16° (Doroshenko et al. 2022; Tsygankov et al. 2022). Observations of other XRPs with IXPE, that is, Vela X-1 (Forsblom et al. 2023) and X Persei (Mushtukov et al. 2023), also imply either low or high values of magnetic obliquity. These results are in fact in line with some studies predicting a bimodal distribution of the magnetic obliquity θ peaking around 0 and 90 deg in the case of isolated NSs (e.g., Lander & Jones 2018). However, we note that in the case of accreting NSs, the predictions are less specific depending on the accretion mechanism (Biryukov & Abolmasov 2021). More observations of XRPs with IXPE will allow us to verify models of the axis alignment of accreting pulsars.
5. Summary
The results of our study can be summarized as follows:
-
GRO J1008–57 was observed by IXPE during the Type I outburst in November 2022 in two states, which differ in flux level by a factor of 2.
-
Both the energy-binned and spectro-polarimetric analyses of the phase-averaged data reveal a significant average polarization of the source with a PD of ∼3.9% regardless of the source flux.
-
The pulse-phase resolved analysis reveals a correlation between the flux and the PD, and suggests that a strong variation of the PA is responsible for the low average polarization from the source. The results obtained in the two luminosity states are consistent within the uncertainties. We also find an indication that the PD is positively correlated with energy.
-
The observed variations of the PA are well described in the framework of the rotating-vector model. The corresponding inclination of the pulsar is about 130°, and the position angle of the pulsar spin is ∼75° (or 255°) if radiation escapes from the surface in the O-mode, or ∼165° (or −15°) if the X-mode dominates. In all cases, the magnetic obliquity is found to be very large ∼75°, implying that GRO J1008–57 is a nearly orthogonal rotator.
-
The observed pulsar inclination appears to agree with the estimated orbital inclination of the system, suggesting that the pulsar spin is close to being aligned with the orbital axis. This indicates that, in spite of a strong natal kick received by the NS, the accretion torques (even though acting sporadically) had sufficient time to align the spin and orbital angular momenta.
-
The relatively low polarization detected from GRO J1008–57 as well as the finding that the polarization properties are independent of the mass accretion rate can be explained in the framework of the model of an overheated NS atmosphere.
Detecting changes in the polarization properties with mass accretion rate requires observations of an XRP during giant Type II outburst. Such observations were performed by IXPE in February 2023 for the Be/XRP LS V +44 17/RX J0440.9+4431, where strong variations of the PD and PA in different luminosity states were discovered (Doroshenko et al. 2023).
The actual value of inclination reported by Coe et al. (2007) is ∼36°, but this cannot be distinguished from 180° −36° = 144°.
Acknowledgments
The Imaging X-ray Polarimetry Explorer (IXPE) is a joint US and Italian mission. The US contribution is supported by the National Aeronautics and Space Administration (NASA) and led and managed by its Marshall Space Flight Center (MSFC), with industry partner Ball Aerospace (contract NNM15AA18C). The Italian contribution is supported by the Italian Space Agency (Agenzia Spaziale Italiana, ASI) through contract ASI-OHBI-2017-12-I.0, agreements ASI-INAF-2017-12-H0 and ASI-INFN-2017.13-H0, and its Space Science Data Center (SSDC) with agreements ASI-INAF-2022-14-HH.0 and ASI-INFN 2021-43-HH.0, and by the Istituto Nazionale di Astrofisica (INAF) and the Istituto Nazionale di Fisica Nucleare (INFN) in Italy. This research used data products provided by the IXPE Team (MSFC, SSDC, INAF, and INFN) and distributed with additional software tools by the High-Energy Astrophysics Science Archive Research Center (HEASARC), at NASA Goddard Space Flight Center (GSFC). We acknowledge support from the Academy of Finland grants 333112, 349144, 349373, and 349906 (SST, JP), the German Academic Exchange Service (DAAD) travel grant 57525212 (VD, VFS), the Väisälä Foundation (SST), the German Research Foundation (DFG) grant WE 1312/53-1 (VFS), UKRI Stephen Hawking fellowship and the Netherlands Organization for Scientific Research Veni fellowship (AAM), the Czech Science Foundation project 21-06825X (JS).
References
- Arnaud, K. A. 1996, ASP Conf. Ser., 101, 17 [Google Scholar]
- Baldini, L., Barbanera, M., Bellazzini, R., et al. 2021, Astropart. Phys., 133, 102628 [NASA ADS] [CrossRef] [Google Scholar]
- Baldini, L., Bucciantini, N., Di Lalla, N., et al. 2022, SoftwareX, 19, 101194 [NASA ADS] [CrossRef] [Google Scholar]
- Basko, M. M., & Sunyaev, R. A. 1976, MNRAS, 175, 395 [Google Scholar]
- Becker, P. A., & Wolff, M. T. 2022, ApJ, 939, 67 [NASA ADS] [CrossRef] [Google Scholar]
- Bellm, E. C., Fürst, F., Pottschmidt, K., et al. 2014, ApJ, 792, 108 [NASA ADS] [CrossRef] [Google Scholar]
- Biryukov, A., & Abolmasov, P. 2021, MNRAS, 505, 1775 [NASA ADS] [CrossRef] [Google Scholar]
- Budden, K. G. 1952, Proc. R. Soc. London Ser. A, 215, 215 [NASA ADS] [CrossRef] [Google Scholar]
- Caiazzo, I., & Heyl, J. 2021, MNRAS, 501, 109 [Google Scholar]
- Coe, M. J., Bird, A. J., Hill, A. B., et al. 2007, MNRAS, 378, 1427 [NASA ADS] [CrossRef] [Google Scholar]
- Deeter, J. E., Boynton, P. E., & Pravdo, S. H. 1981, ApJ, 247, 1003 [NASA ADS] [CrossRef] [Google Scholar]
- Di Marco, A., Soffitta, P., Costa, E., et al. 2023, AJ, 165, 143 [CrossRef] [Google Scholar]
- Doroshenko, V., Poutanen, J., Tsygankov, S. S., et al. 2022, Nat. Astron., 6, 1433 [NASA ADS] [CrossRef] [Google Scholar]
- Doroshenko, V., Poutanen, J., Heyl, J., et al. 2023, A&A, submitted [arXiv:2306.02116] [Google Scholar]
- Foreman-Mackey, D., Hogg, D. W., Lang, D., & Goodman, J. 2013, PASP, 125, 306 [Google Scholar]
- Forsblom, S. V., Poutanen, J., Tsygankov, S. S., et al. 2023, ApJ, 947, L20 [NASA ADS] [CrossRef] [Google Scholar]
- Fortin, F., García, F., Chaty, S., Chassande-Mottin, E., & Simaz Bunzel, A. 2022, A&A, 665, A31 [NASA ADS] [CrossRef] [EDP Sciences] [Google Scholar]
- Ge, M. Y., Ji, L., Zhang, S. N., et al. 2020, ApJ, 899, L19 [NASA ADS] [CrossRef] [Google Scholar]
- Gnedin, Y. N., & Pavlov, G. G. 1974, Sov. J. Exp. Theoret. Phys., 38, 903 [NASA ADS] [Google Scholar]
- Gnedin, Y. N., Pavlov, G. G., & Shibanov, I. A. 1978, Pisma v Astronomicheskii Zhurnal, 4, 214 [NASA ADS] [Google Scholar]
- González-Caniulef, D., Zane, S., Turolla, R., & Wu, K. 2019, MNRAS, 483, 599 [CrossRef] [Google Scholar]
- González-Caniulef, D., Caiazzo, I., & Heyl, J. 2023, MNRAS, 519, 5902 [CrossRef] [Google Scholar]
- Harding, A. K., & Lai, D. 2006, Rep. Progr. Phys., 69, 2631 [CrossRef] [Google Scholar]
- Heyl, J., & Caiazzo, I. 2018, Galaxies, 6, 76 [NASA ADS] [CrossRef] [Google Scholar]
- Heyl, J. S., & Shaviv, N. J. 2002, Phys. Rev. D, 66, 023002 [NASA ADS] [CrossRef] [Google Scholar]
- Kislat, F., Clark, B., Beilicke, M., & Krawczynski, H. 2015, Astropart. Phys., 68, 45 [NASA ADS] [CrossRef] [Google Scholar]
- Kühnel, M., Müller, S., Kreykenbohm, I., et al. 2013, A&A, 555, A95 [NASA ADS] [CrossRef] [EDP Sciences] [Google Scholar]
- Lander, S. K., & Jones, D. I. 2018, MNRAS, 481, 4169 [NASA ADS] [CrossRef] [Google Scholar]
- Lutovinov, A., Tsygankov, S., Molkov, S., et al. 2021, ApJ, 912, 17 [Google Scholar]
- Marshall, H. L. 2021, AJ, 162, 134 [NASA ADS] [CrossRef] [Google Scholar]
- Marshall, H. L., Ng, M., Rogantini, D., et al. 2022, ApJ, 940, 70 [NASA ADS] [CrossRef] [Google Scholar]
- Matsuoka, M., Kawasaki, K., Ueno, S., et al. 2009, PASJ, 61, 999 [Google Scholar]
- Meszaros, P., Novick, R., Szentgyorgyi, A., Chanan, G. A., & Weisskopf, M. C. 1988, ApJ, 324, 1056 [NASA ADS] [CrossRef] [Google Scholar]
- Mushtukov, A., & Tsygankov, S. 2022, in Handbook of X-ray and Gamma-ray Astrophysics, eds. C. Bambi, & A. Santangelo (Singapore: Springer) [Google Scholar]
- Mushtukov, A. A., Suleimanov, V. F., Tsygankov, S. S., & Poutanen, J. 2015, MNRAS, 447, 1847 [NASA ADS] [CrossRef] [Google Scholar]
- Mushtukov, A. A., Suleimanov, V. F., Tsygankov, S. S., & Portegies Zwart, S. 2021, MNRAS, 503, 5193 [Google Scholar]
- Mushtukov, A. A., Tsygankov, S. S., Poutanen, J., et al. 2023, MNRAS, submitted [arXiv:2303.17325] [Google Scholar]
- Naik, S., Paul, B., Kachhara, C., & Vadawale, S. V. 2011, MNRAS, 413, 241 [CrossRef] [Google Scholar]
- Nelson, R. W., Wang, J. C. L., Salpeter, E. E., & Wasserman, I. 1995, ApJ, 438, L99 [Google Scholar]
- Pavlov, G. G., & Gnedin, Y. N. 1984, Astrophys. Space Phys. Res., 3, 197 [NASA ADS] [Google Scholar]
- Poutanen, J. 2020, A&A, 641, A166 [NASA ADS] [CrossRef] [EDP Sciences] [Google Scholar]
- Radhakrishnan, V., & Cooke, D. J. 1969, App. Lett., 3, 225 [NASA ADS] [Google Scholar]
- Reig, P. 2011, Ap&SS, 332, 1 [Google Scholar]
- Shrader, C. R., Sutaria, F. K., Singh, K. P., & Macomb, D. J. 1999, ApJ, 512, 920 [NASA ADS] [CrossRef] [Google Scholar]
- Soffitta, P., Baldini, L., Bellazzini, R., et al. 2021, AJ, 162, 208 [CrossRef] [Google Scholar]
- Sokolova-Lapa, E., Gornostaev, M., Wilms, J., et al. 2021, A&A, 651, A12 [NASA ADS] [CrossRef] [EDP Sciences] [Google Scholar]
- Stollberg, M. T., Finger, M. H., Wilson, R. B., et al. 1993, IAU Circ., 5836, 1 [NASA ADS] [Google Scholar]
- Strohmayer, T. E. 2017, ApJ, 838, 72 [NASA ADS] [CrossRef] [Google Scholar]
- Suleimanov, V. F., Poutanen, J., & Werner, K. 2018, A&A, 619, A114 [NASA ADS] [CrossRef] [EDP Sciences] [Google Scholar]
- Taverna, R., Turolla, R., Muleri, F., et al. 2022, Science, 378, 646 [NASA ADS] [CrossRef] [Google Scholar]
- Tsygankov, S. S., Mushtukov, A. A., Suleimanov, V. F., et al. 2017a, A&A, 608, A17 [NASA ADS] [CrossRef] [EDP Sciences] [Google Scholar]
- Tsygankov, S. S., Wijnands, R., Lutovinov, A. A., Degenaar, N., & Poutanen, J. 2017b, MNRAS, 470, 126 [Google Scholar]
- Tsygankov, S. S., Doroshenko, V., Mushtukov, A. A., et al. 2019a, MNRAS, 487, L30 [NASA ADS] [CrossRef] [Google Scholar]
- Tsygankov, S. S., Rouco Escorial, A., Suleimanov, V. F., et al. 2019b, MNRAS, 483, L144 [NASA ADS] [CrossRef] [Google Scholar]
- Tsygankov, S. S., Doroshenko, V., Poutanen, J., et al. 2022, ApJ, 941, L14 [NASA ADS] [CrossRef] [Google Scholar]
- Weisskopf, M. C., Soffitta, P., Baldini, L., et al. 2022, J. Astron. Telesc. Instrum. Syst., 8, 026002 [NASA ADS] [CrossRef] [Google Scholar]
- Wilms, J., Allen, A., & McCray, R. 2000, ApJ, 542, 914 [Google Scholar]
- Yamamoto, T., Mihara, T., Sugizaki, M., et al. 2013, ATel, 4759, 1 [NASA ADS] [Google Scholar]
- Zel’dovich, Y. B., & Shakura, N. I. 1969, Sov. Astron., 13, 175 [NASA ADS] [Google Scholar]
All Tables
Spectral parameters for the best-fit model for the two flux states of the source, separately and combined; uncertainties are at 68.3% CL.
Spectral parameters for the phase-resolved spectro-polarimetric analysis of the combined data.
All Figures
|
Fig. 1. Light curve of GRO J1008–57 during the November 2022 outburst. Left: long-term light curve in the 4–10 keV energy band obtained by the MAXI all-sky monitor (black points). Blue and red shaded stripes show the time periods of the first and second IXPE observations, respectively. Right: light curves of GRO J1008–57 in the 2–8 keV energy band summed over three modules of IXPE during the first (top) and second (bottom) observation. |
| In the text | |
|
Fig. 2. Pulse profile of GRO J1008–57 in different energy bands as seen by IXPE in the bright (left) and low (right) states. Data from the three telescopes were combined. The zero phase was chosen to coincide for both observations using cross-correlation of the profiles. |
| In the text | |
|
Fig. 3. Variations of the normalized Stokes parameters q and u with the pulsar phase, averaged over all DUs in the 2–8 keV energy band (beige circles and arrows) for the bright (left) and low (right) states of GRO J1008–57. Each circle corresponds to a specific phase bin, numbered successively following the binning shown in Fig. 4. The circle radius represents the 1σ uncertainty value. The phase-averaged value is shown with a red cross in the corresponding panel. |
| In the text | |
|
Fig. 4. Dependence of the normalized flux in the 2–8 keV energy band, normalized Stokes parameters q and u (based on the formalism by Kislat et al. 2015), PD, and PA (from the spectro-polarimetric analysis) on the pulse phase for two IXPE observations separately (left) and combined (right). Data from the three IXPE telescopes are combined. Vertical dash-dotted lines show the positions of two minima in the profile and are added for illustrative purposes. The black solid line in the bottom right panel shows the best-fit rotating vector model (see Sect. 4.2). |
| In the text | |
|
Fig. 5. Energy distributions of the Stokes parameters I, Q, and U for the bright (upper plots) and low (lower plots) states of GRO J1008–57 with the best-fit model shown with the black solid line. The residuals between the data and the model normalized for the errors are shown in the bottom panels of the corresponding plots. The different colors represent the three IXPE detectors: DU1 in blue, DU2 in orange, and DU3 in green. |
| In the text | |
|
Fig. 6. Polarization vectors as a function of the phase of GRO J1008–57 based on the spectral fitting of the combined data from both IXPE observations. In each plot, the PD and PA contours at 68.27%, 95.45%, and 99.73% confidence levels (red, green and blue, respectively) are shown in polar coordinates for 14 different phase intervals (coinciding with the ones defined in Fig. 4). |
| In the text | |
|
Fig. 7. Corner plot of the posterior distribution for the RVM parameters for the pulsar geometry obtained using the PA values from the phase-resolved spectro-polarimetric analysis of the combined data. The two-dimensional contours correspond to 68.27%, 95.45%, and 99.73% confidence levels. The histograms show the normalized one-dimensional distribution for each parameter derived from the posterior samples. The mean value and 1σ confidence interval for the derived parameters are presented above the corresponding histogram (dashed lines). |
| In the text | |
Current usage metrics show cumulative count of Article Views (full-text article views including HTML views, PDF and ePub downloads, according to the available data) and Abstracts Views on Vision4Press platform.
Data correspond to usage on the plateform after 2015. The current usage metrics is available 48-96 hours after online publication and is updated daily on week days.
Initial download of the metrics may take a while.