Fig. 7.
Download original image
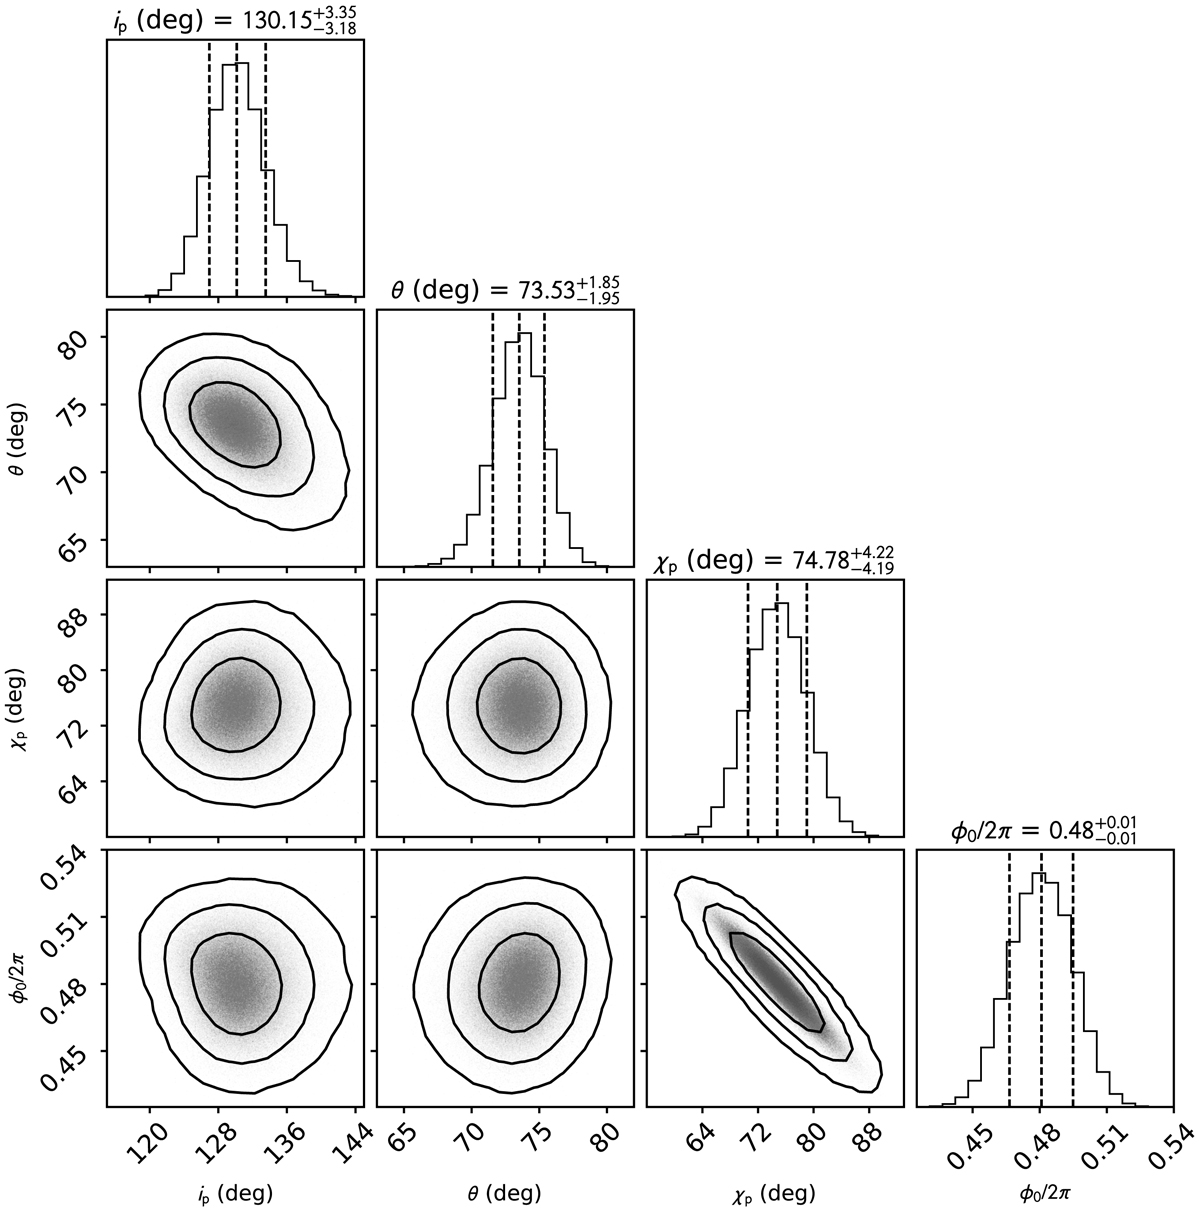
Corner plot of the posterior distribution for the RVM parameters for the pulsar geometry obtained using the PA values from the phase-resolved spectro-polarimetric analysis of the combined data. The two-dimensional contours correspond to 68.27%, 95.45%, and 99.73% confidence levels. The histograms show the normalized one-dimensional distribution for each parameter derived from the posterior samples. The mean value and 1σ confidence interval for the derived parameters are presented above the corresponding histogram (dashed lines).
Current usage metrics show cumulative count of Article Views (full-text article views including HTML views, PDF and ePub downloads, according to the available data) and Abstracts Views on Vision4Press platform.
Data correspond to usage on the plateform after 2015. The current usage metrics is available 48-96 hours after online publication and is updated daily on week days.
Initial download of the metrics may take a while.