Fig. 6.
Download original image
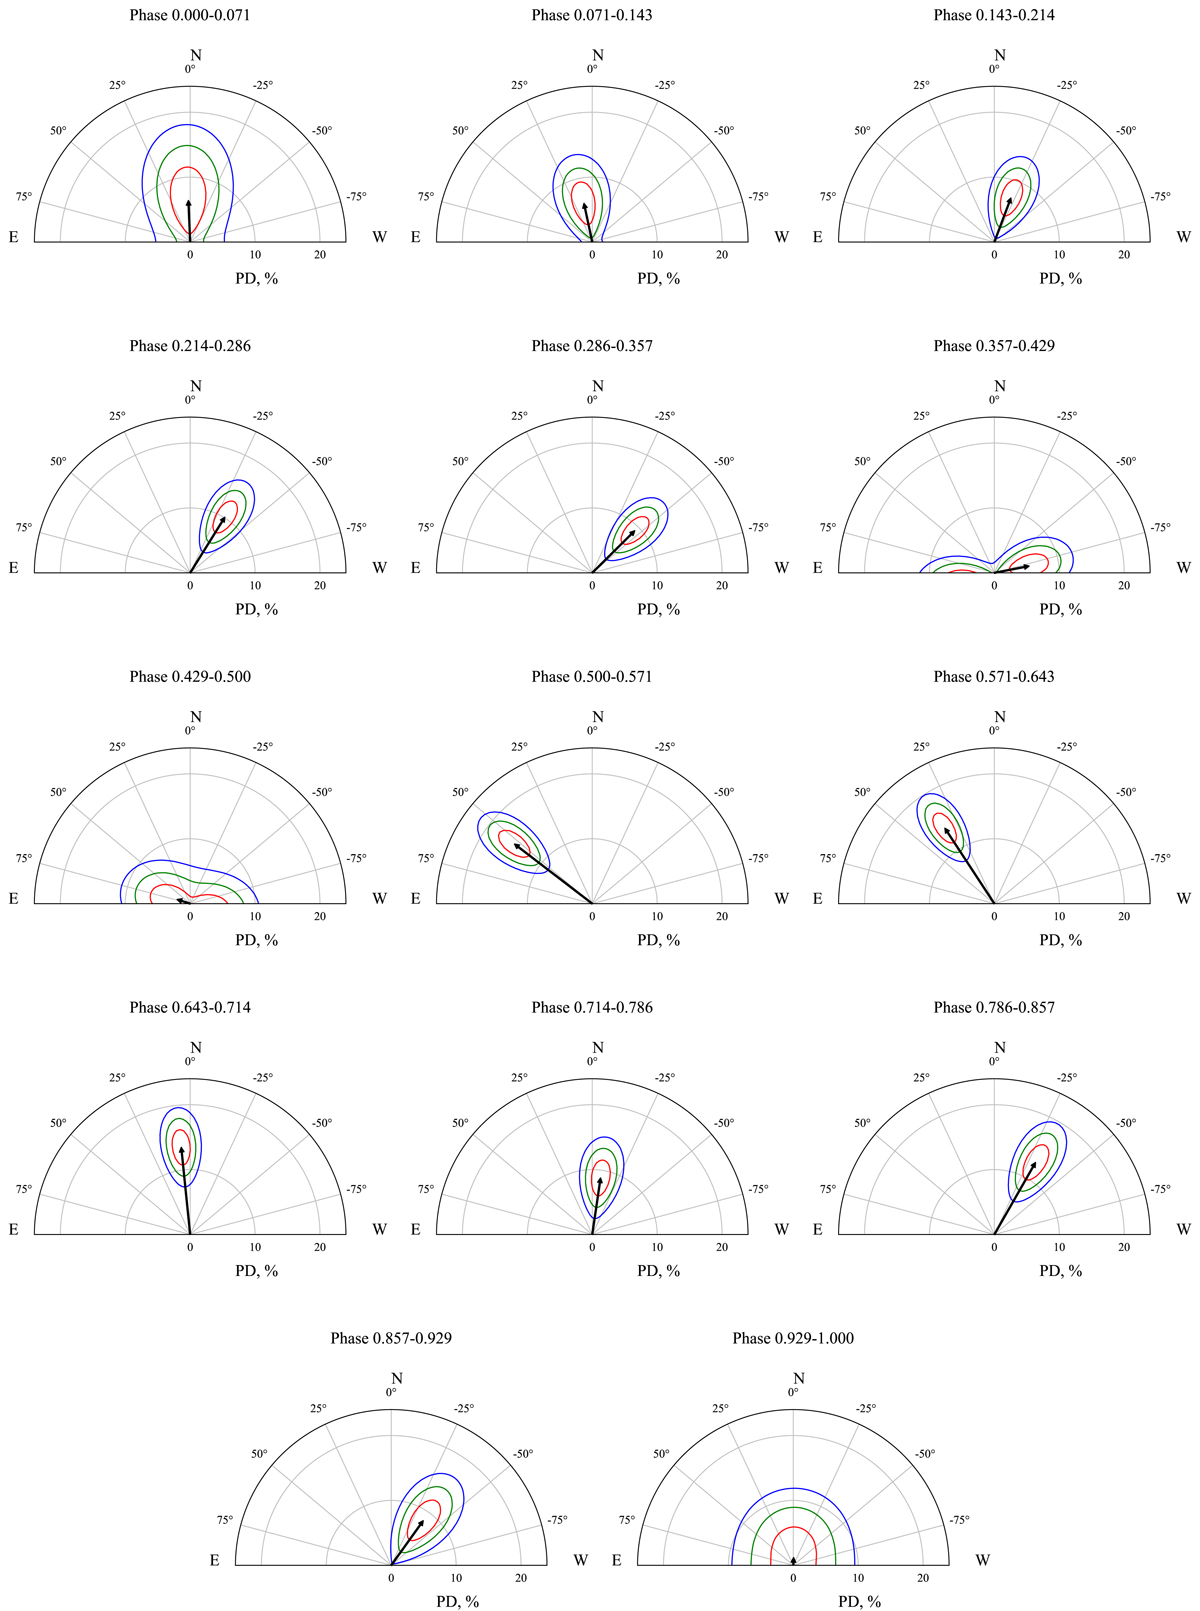
Polarization vectors as a function of the phase of GRO J1008–57 based on the spectral fitting of the combined data from both IXPE observations. In each plot, the PD and PA contours at 68.27%, 95.45%, and 99.73% confidence levels (red, green and blue, respectively) are shown in polar coordinates for 14 different phase intervals (coinciding with the ones defined in Fig. 4).
Current usage metrics show cumulative count of Article Views (full-text article views including HTML views, PDF and ePub downloads, according to the available data) and Abstracts Views on Vision4Press platform.
Data correspond to usage on the plateform after 2015. The current usage metrics is available 48-96 hours after online publication and is updated daily on week days.
Initial download of the metrics may take a while.