Fig. 1.
Download original image
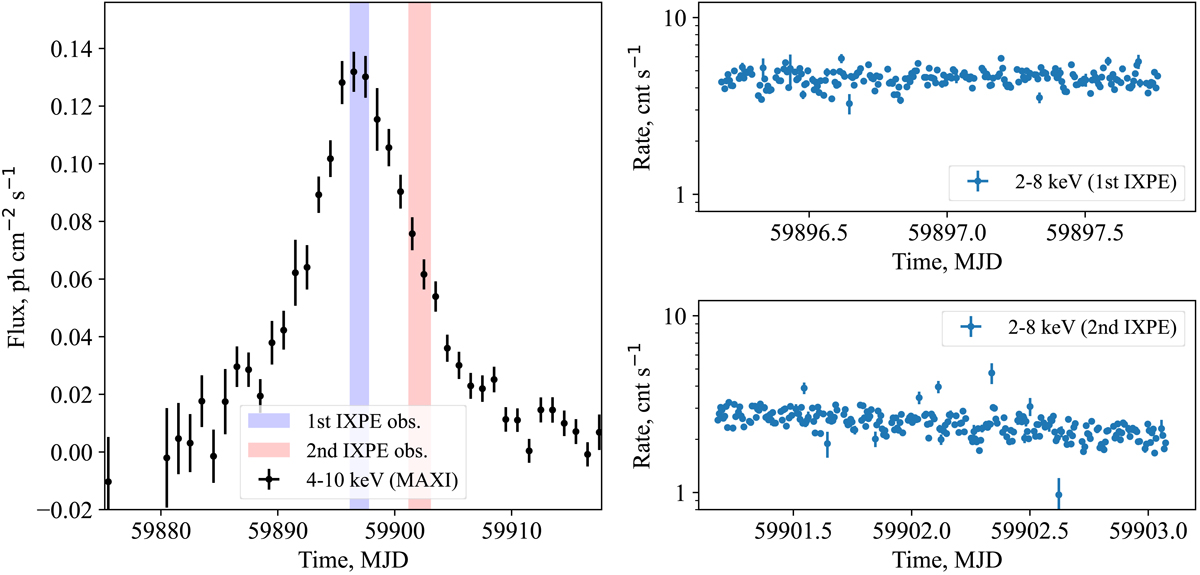
Light curve of GRO J1008–57 during the November 2022 outburst. Left: long-term light curve in the 4–10 keV energy band obtained by the MAXI all-sky monitor (black points). Blue and red shaded stripes show the time periods of the first and second IXPE observations, respectively. Right: light curves of GRO J1008–57 in the 2–8 keV energy band summed over three modules of IXPE during the first (top) and second (bottom) observation.
Current usage metrics show cumulative count of Article Views (full-text article views including HTML views, PDF and ePub downloads, according to the available data) and Abstracts Views on Vision4Press platform.
Data correspond to usage on the plateform after 2015. The current usage metrics is available 48-96 hours after online publication and is updated daily on week days.
Initial download of the metrics may take a while.