| Issue |
A&A
Volume 675, July 2023
|
|
|---|---|---|
| Article Number | A178 | |
| Number of page(s) | 14 | |
| Section | Extragalactic astronomy | |
| DOI | https://doi.org/10.1051/0004-6361/202345949 | |
| Published online | 18 July 2023 | |
Long-term optical spectral monitoring of a changing-look active galactic nucleus NGC 3516
II. Broad-line profile variability
1
Astronomical Observatory, Volgina 7, 11000 Belgrade, Serbia
e-mail: This email address is being protected from spambots. You need JavaScript enabled to view it.
2
Department of Astronomy, University of Belgrade – Faculty of Mathematics, Studentski trg 16, 11000 Belgrade, Serbia
3
Humboldt Research Fellow, Hamburger Sternwarte, Universität Hamburg, Gojenbergsweg 112, 21029 Hamburg, Germany
4
Special Astrophysical Observatory of the Russian AS, Nizhnij Arkhyz, Karachaevo-Cherkesia 369167, Russia
5
Instituto Nacional de Astrofiísica, Óptica y Electroónica, Luis Enrique Erro 1, Tonantzintla, Puebla 72840, Mexico
6
Max-Planck-Institut fuer Radioastronomie, Auf dem Huegel 69, 53121 Bonn, Germany
7
Key Laboratory for Particle Astrophysics, Institute of High Energy Physics, Chinese Academy of Sciences, 19B Yuquan Road, Beijing 100049, PR China
8
INAF – Osservatorio Astronomico di Padova, Vicolo dell, Osservatorio 5, Padova, Italy
9
Center for Astrophysics | Harvard & Smithsonian, 60 Garden Street, Cambridge MA 02138, USA
10
School of Astronomy and Space Sciences, University of Chinese Academy of Sciences, 19A Yuquan road, Beijing 100049, PR China
11
National Astronomical Observatory of China, 20A Datun Road, Beijing 100020, PR China
12
Instituto de Astrofísica de Canarias, Vía Láctea S/N, La Laguna 38200, Tenerife, Spain
13
Departamento de Astrofísica, Universidad de la Laguna, La Laguna, 38200 Tenerife, Spain
Received:
19
January
2023
Accepted:
29
May
2023
Abstract
Context. We analyze the broad Hβ line profile variability of a “changing look” active galactic nucleus (CL-AGN) NGC 3516 over an extensive period of 25 years (from 1996 to 2021). The observed change in the broad line profile may indicate a change in the geometry of the broad line region (BLR). The main objective is to follow and understand the change in the BLR over a long period as well as its connection to the CL mechanism.
Aims. Using spectral line profiles, we aim to explore changes in the kinematics and dimensions of the BLR in NGC 3516. We consider two possible scenarios: the changes in the broad-line emission are either caused by a decrease of ionisation continuum emission or by the BLR obscuration by outer dusty regions. With this investigation, we aim to clarify the CL mechanism of this AGN.
Methods. We analyzed the spectral band around the Hβ line as well as the broad Hβ line parameters and how they change over time. We modelled the broad-line profiles, assuming that there is an emission from the accretion disc superposed with emission from a surrounding region that is outside the disc.
Results. We find that in the type 1 activity phase occurring when the strong broad emission lines are observed, the BLR is very complex. There is a clear disc-like BLR that contributes to the broad line wings and an additional intermediate line region (ILR) that contributes to the line core. In the high-activity phase, the ILR emission is close to the center of the line, although in some cases, it is slightly shifted to the red. In the low-activity phase (i.e. type 2 phase), the ILR component has a significant shift to the blue, indicating an outflow.
Conclusions. We propose that the changing-look mechanism in NGC 3516 is rather connected with the intrinsic effects than with an outer obscuring region. It may still be possible that the dust plays an important role in the low-activity phase when it is coming from within the BLR, leading to a dusty BLR. In this way, it would cause a decrease in the ionisation and recombination rates.
Key words: galaxies: active / galaxies: nuclei / quasars: emission lines / line: profiles
© The Authors 2023
 Open Access article, published by EDP Sciences, under the terms of the Creative Commons Attribution License (https://creativecommons.org/licenses/by/4.0), which permits unrestricted use, distribution, and reproduction in any medium, provided the original work is properly cited.
This article is published in open access under the Subscribe to Open model. This email address is being protected from spambots. You need JavaScript enabled to view it. to support open access publication.
1. Introduction
Broad emission lines (with full width at half maximum, FWHM, around several 1000 km s−1) that are emitted from the broad line region (BLR) can be observed in so-called type 1 active galactic nuclei (AGNs). According to the unified model, broad lines (emitted from the BLR) can be observed when an AGN has an adequate orientation (see Antonucci 1993; Urry & Padovani 1995) with respect to the observer. In this scenario, the BLR is present in all AGNs, but the emission from BLR can only be detected when it is not covered by the dusty torus. In principle, the difference between type 1 and 2 AGNs is caused by obscuring of the dust that is assumed to be in a shape of a torus that is co-planar with the accretion disc (Urry & Padovani 1995). However, the dust distribution can be more complex and dust may be also present in the form of polar cones in AGNs (see Stalevski et al. 2019).
In the case of type 1 AGN, we can see emission of the gas that is closer to the central supermassive black hole (SMBH) and the broad line widths are broadened due to the rotation caused by gravitation of the SMBH. Therefore, these parameters are often used for the SMBH mass measurements (see a review Popović 2020, and references therein). However, other effects, such as inflows and outflows could affect the width of broad lines (see e.g., León-Tavares et al. 2013; Popović et al. 2019; Hu et al. 2020). The broad line shapes can be used to explore the BLR kinematics and emission gas motion that is close to the SMBH. The broad line variability is caused by the variability of the ionised gas source, but dust can play an important role because it can obscure a portion or the entire BLR (see e.g., Gaskell & Harrington 2018). The variation in the broad line intensity is mostly caused by the variability of the ionisation continuum, but the changes in line shapes, widths, and shifts are most likely caused by the change in the BLR geometry (see e.g., Shapovalova et al. 2010; Popović et al. 2011; Du et al. 2018; Brotherton et al. 2020; Bao et al. 2022; Chen et al. 2023 etc.). Both of these changes can offer more information about the nature of the AGNs.
Additionally, in a number of AGNs, the broad component in emission lines disappears for a certain period of time, when they only show a narrow component, as in the case of type 2 AGNs (see e.g., Lyutyj et al. 1984; Kollatschny & Fricke 1985, for early works). These AGNs are classified as changing-look AGNs (CL-AGNs). This phenomenon of CL-AGNs may be caused by a number of aspect, most often including: a) the existence of an obscuring material, which is able to cover the BLR and obscure the broad line component (e.g., Elitzur 2012); b) changes in the rate of accretion, that is: from time to time, there is lack of accreting material (e.g., Stern et al. 2018) attributed to a range of possible reasons (e.g., tidal disruption events Eracleous et al. 1995). Also, the combination of these two effects, along with some additional effects, may be responsible for CL-AGN phenomena (see e.g., Noda et al. 2016; Noda & Done 2018; Guo et al. 2020; Wang & Bon 2020, etc.).
The specific nature of CL AGNs is one of the most interesting questions in AGN investigations (see e.g., Bianchi et al. 2005; MacLeod et al. 2016, 2019; Noda & Done 2018; Mathur et al. 2018; Śniegowska et al. 2020, 2022), since it indicates that the difference between type 1 and type 2 AGNs may not be solely caused by their orientation. Several tens of AGNs have been observed as changing-look AGN up to now (see e.g., Yang et al. 2018; Hon et al. 2020, 2022; Kollatschny et al. 2023), with more to come thanks to ongoing and upcoming time-domain surveys (see e.g., Sánchez-Sáez et al. 2021). One of the characteristics of the CL-AGN is that the broad line appearance is connected with the blue continuum in most of the observed CL-AGNs (see Hon et al. 2022).
The variability of the broad line flux and shape may help to clarify the nature of the CL-AGNs, especially in the case of long-term monitoring of this type of AGNs. Specifically, the line shape variability is connected with the BLR geometry and can indicate changes in the BLR geometry, namely, if it remains the same or, in contrast, if it is significantly changed during the transition between two phases of activity. In Shapovalova et al. (2019, hereafter Paper I), we published the variability in the flux of the continuum and emission lines of the active galaxy NGC 3516 over an extended time period (1996–2018), in which we confirmed that this AGN is a CL-AGN. We found that the broad lines disappeared in the period after 2014, with a very weak broad line component observed in 2017, supporting the changing-look classification of this AGN. The phase of weak broad lines has extended past 2017, with a number of coronal lines detected in that time (see Ilić et al. 2020).
The galaxy NGC 3516 was one of the first observed active galaxies (Seyfert 1943) and the strong variability of its broad emission lines was firstly noted by Andrillat & Souffrin (1968). The galaxy is situated in the local universe (z ∼ 0.009) and it is a bright object (V ∼ 12.5 magnitude), which is why this object has often been observed in spectral mode (see Souffrin 1968; Andrillat 1971; Collin-Souffrin et al. 1973; Adams & Weedman 1975; Boksenberg & Netzer 1977; Osterbrock 1977; Crenshaw 1986; Collin-Souffrin 1980; Bochkarev et al. 1990; van Wanders et al. 1993; Lyutyi & Doroshenko 1993; Wanders & Horne 1994; Denney et al. 2010; De Rosa et al. 2018; Shapovalova et al. 2019; Ilić et al. 2020 etc.). In this paper, we explore the Hβ broad line shape of NGC 3516 over a long period in order to explore possible changes in the BLR geometry during a transition phase from a type 1 to type 2 AGN. To address the question of the CL nature of NGC 3516, we explore the changes in the broad line shapes over a long-term period (from 1996 to 2019, reported in Paper I), along with additional observations from 2019 to 2021. The aim of this paper is to investigate the Hβ broad line profile observed over a long-term period to find the nature of the CL mechanism in NGC 3516.
The paper is organised as follows. In Sect. 2, we shortly describe the observations and the data reduction. In Sect. 3, we model line profiles and outline the most important results of the broad line profile modeling. In Sect. 4, we discuss the obtained results in the frame of the CL nature of NGC 3516. Finally, in Sect. 5, we outline our conclusions.
2. Observations and spectral analysis
2.1. Spectral observations
Details about the observations, calibration of spectra, unification of the spectral data, and measurements of the spectral fluxes are given in our previous works (see Shapovalova et al. 2004, 2008, 2010, 2012, 2013, 2016, 2017, 2019, and references therein). Thus, we only offer some basic information about the observations and data reduction.
NGC 3516 has been monitored over an extended period lasting from 1996 to 2021. The observations from 1996 to 2019 were taken with the 6 m and 1 m telescopes of the SAO RAS, Russia, while with the INAOE’s 2.1 m telescope of the Guillermo Haro Observatory (GHO) at Cananea, Sonora, Mexico the observations were taken in period 1998–2007 and 2020–2021. The description of observations and data reduction for these spectra are described in detail in Paper I. We note that Paper I reports on data acquired until 2019, however, all spectra collected afterwards were processed in the same manner.
2.2. Spectral analysis
To explore broad line profiles from different epochs, we mostly used the Hβ line profile for two reasons, as follows. First, most of the spectra presented in Paper I cover only the Hβ wavelength band and, second, the spectral line intensities are re-scaled to the [O III] lines, which is close to the Hβ. Thus, we were able to avoid a possible deformation of the line intensity and shape farther in the spectra, where Hα is located. However, we did use the Hα broad line in 2017 and 2019 because, as we show in Shapovalova et al. (2019), the Hβ and Hα profiles are the same for 2017.
To analyze the broad emission lines, first we calibrated the spectra according to the [O III] lines (see in more details Shapovalova et al. 2019). However, we note that the [O III] lines could vary over a long period (e.g., as in the case of NGC 5548, see Peterson et al. 2013), especially in this case, after the ionizing continuum luminosity decreased dramatically (in the period 2014–2018). In this study, we mostly focus on broad line profiles where the effect of normalisation on [O III] lines is not expected to strongly affect the results. In the part where we compare changes in the broad line profile with broad line intensity, this aspect should kept in mind.
The Hβ wavelength region observed in different epochs is presented in Fig. 1. To extract only the broad Hβ components, we performed the following steps (see Fig. 2):
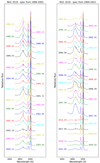 |
Fig. 1. Hβ wavelength band of NGC 3516 observed from 1996 to 2021. The spectra are normalised to the [O III] line flux. |
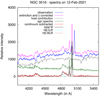 |
Fig. 2. Example of the procedure of the extracting broad Hβ component for a spectrum with weak Balmer lines (from 12-Feb-2021). First, the host galaxy contribution was subtracted from the observed spectrum. Afterwards, the continuum was estimated and subtracted and the broad and narrow lines were fitted (bottom spectrum). |
1. First, we carried out a reproduction and subtraction of the host galaxy spectrum. This is a very important for spectra obtained during the low-activity phase, when the broad component was very weak.
2. Then, we fit the Hβ emission region, based on the assumption that the broad line is composed pf two Gaussian functions and that the narrow lines (narrow Hβ and [O III] lines) have the same kinematics and other constraints (see e.g., Popović et al. 2004; Dimitrijević et al. 2007; Kovačević et al. 2010).
3. The subtraction of the continuum and narrow lines was done so that we would have only broad line components from different epochs, as shown in Fig. 3.
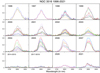 |
Fig. 3. All Hβ broad profiles observed during the monitoring period. The extracted broad line profiles are grouped within calendar years. The broad Hβ intensity is normalised to the [O III] lines (see Fig. 1). |
4. Finally, the broad Hβ lines were normalised to unity and the wavelength scale converted into velocity scale (v/c) to compare the line parameters (FWHM and shift) and shapes from different epochs (see Fig. 4).
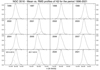 |
Fig. 4. Modelled broad Hβ line shapes during the monitoring period. The normalised (to unity) mean Hβ profile (solid line) and corresponding rms (dashed line) in the velocity scale is given for each year. |
Since the Hβ line is very weak in some epochs (e.g., in the period 2014–2019), for further analysis we only adopted lines for which the maximal intensity in broad Hβ over noise in Hβ is greater or approximately equal to 3. In this way, we ended up rejecting one observation from 2014. To estimate the error in fitting parameters (line widths, shifts, and asymmetries), we applied the Monte Carlo method for each spectrum. First, we measured the σ noise in each spectrum and then we used the line parameters obtained from the best fit to make the 100 mock spectra by adding random noise with the same level as measured in the observed spectrum. We took the 2σ dispersion of the fitting parameters of 100 mock spectra as the fit uncertainty. Additionally, for each year, we calculated the mean and rms profile in order to see changes in the line profile (see Fig. 4).
3. Results
We measured the broad Hβ line shapes from different epochs were inspected (see Figs. 1 and 3) and broad line parameters. We also fit the broad line profiles with a two-component model (accretion disc and surrounding region). Here, we present our results.
3.1. Broad Hβ line profiles
The change in the broad line shape can indicate changes in the BLR geometry. In order to study this, we calculate the mean and rms profiles for each calendar year during the monitoring period. As can be seen in Figs. 1 and 3, there are different states of AGN activity seen in NGC 3516 (see also Shapovalova et al. 2019). Below, we comment the behaviour of the broad Hβ line during the monitoring period from 1996 to 2021.
From the beginning of our observational campaign reported in Shapovalova et al. (2019), the Hβ line was very intensive (epoch 1996–1999). Afterwards, a period of variable broad line intensity is observed in 1999–2001, while in the period of 2002–2003, Hβ was weak. After 2004 until 2007 the Hβ became more intensive. The broad lines almost disappear in observations from 2014, and there is a very weak broad component appearing after 2017 (see Shapovalova et al. 2019; Ilić et al. 2020).
In the period between 2020–2021, the broad component becomes stronger, but it seems that there are strong changes in the line profile (see Figs. 3 and 4). This implies that the BLR geometry changes during these two periods, after the BLR again appears.
To explore the changes in the line profile, we normalised the line peak (to unity) of the modelled broad Hβ line and found the mean and rms profiles for each year when the line was observed (see Fig. 4). As can be seen in Fig. 4, the most significant changes occur during the phase of weak line emission. This can be caused by normalisation, since the rms is normalised to the averaged profile, and in the phase of low line luminosity, the change is greater. However, the changes in the line profiles show larger asymmetry in the low-luminous line phase (2000 and 2001), as well as in the period between 2014–2015. We note that there is also a big difference among the line profiles between 2020–2021.
We measured the Hβ broad line parameters for each observational epoch. The broad Hβ line for each epoch is modelled and normalised to one (as shown in Fig. 4 for the averaged spectra) and afterwards, we measured the line FWHM, as well as the FW10%M, and asymmetries at half and 10% of the line maximum. The asymmetry is measured as the difference between the centers of the line at FWHM and at FW10%M and the rest wavelength of Hβ.
To explore the influence of different activity phases to the broad Hβ parameters, we compared the line parameters from three activity phases defined on basis to the Hβ line intensity taking the maximal intensity (Imax) on Jan. 18, 2005 (see Fig. 3). We consider the following three activity phases (see first panel in Fig. 5): two extreme cases, the extremely weak line with I < 0.3Imax (red points in Figs. 5 and 6) and the phase with high line intensity I > 0.7Imax (blue points); and the period of moderate activity (black points).
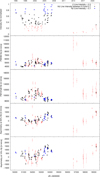 |
Fig. 5. Measured broad Hβ line parameters during the monitoring period (from up to down): Intensity (first panel), FWHM (second panel) and FW10%M (third panel), asymmetries measured at FWHM (forth panel), and FW10%M (fifth panel). The used notation is: blue represents the maximum activity (> 0.7Imax), red the extreme minimum activity (< 0.3Imax) and black represents observation between these two activity phase (0.3Imax < I < 0.7Imax). |
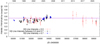 |
Fig. 6. Ratio of the FWHM and FW10%M for Hβ during the monitoring period. The horizontal line represents the value expected in the case of a Gaussian line profile. |
In Fig. 5, we present the line parameters variations during the monitoring period. The first two upper plots in Fig. 5 present the FWHM and FW10%M of Hβ line. As can be seen in Fig. 5 in the minimum of activity, the line width tends to be broader, while in the maximum of activity the width is narrower. The measured FWHM is mostly around 4000–5000 km s−1, while in the minimum, the width seems to be larger. The largest broad line measurements corresponding to the extreme minimum in 2014–2015 are probably affected by a large errors, but if we compare the broad line intensity shown in Fig. 5, we can see that the broader (FWHM > 5000 km s−1 and FW10%M > 10 000 km s−1) Hβ line shows up mostly in the low line intensity phases (in the periods of 2001–2004 and 2014–2021 the observed Hβ lines were weak).
To detect the potential influence of inflows and outflows to the line profile, we measured the asymmetry of the Hβ line at 50% and 10% of line maximal intensity taking the shift between the central peak1 and line center at these values of maximal intensity.
The asymmetries at 50% and 10% of line maximal intensity are shown in Fig. 5 (third and fourth panels from top). As it can be seen, there is an indication that in the minimal phase of line intensity a blue asymmetry is present, while in the maximum of the line intensity the line profiles are more shifted to the red. It is interesting to notice that in the period of extreme minimum (2014–2021), the line shift is going from blue to red. It may indicate that the BLR is changing geometry, which can be caused by several processes in the BLR, as, for instance, Keplerian gas motion and outflows.
As we note above, the line shape indicates the BLR geometry, and if there were strong changes in the BLR geometry they should be reflected in the broad line shape. For instance, if the Keplerian motion is changed to an outflow, the ratio of the FWHM and FW10%M should significantly change. We explore the ratio of these two widths in Fig. 6. The ratio FWHM/FW10%M remains between 0.36 and 0.69, and it is mostly smaller than the expected ratio in the case of a Gaussian line profile (middle horizontal line). It indicates a complex BLR structure, revealed by fitting the broad Hβ line profile with two Gaussian functions.
3.2. Broad spectral line shape modeling: disc and an additional region
The changes in ratio between the FWHM and FW10%M indicate that the BLR is complex, so we considered a BLR with several components. We followed the investigation given in Popović et al. (2002), where a two-component model has been applied to the NGC 3516 line profile, showing that the emission line can be fitted with the emission from a disc like component (which mostly contributes to the line wings) and one intermediate component described with a Gaussian that represents an intermediate line region (ILR). There are a number of AGNs where the complex, two-component BLR model can describe the broad line profiles (see e.g., Popović et al. 2004; Bon et al. 2009). The disc-like BLR can be expected in a number of AGNs which show double peaked line profiles (see e.g., Eracleous & Halpern 1994; Popović et al. 2011, 2014). However the variability in the line profiles of double peaked lines can be different from case to case (see the case of two double-peaked AGNs 3C390.3 and Arp 102B in Popović et al. 2011, 2014 respectively).
For the disc model, we used the model of Chen & Halpern (1989) and we added a Gaussian that represents the ILR emission2. We found that the model can fit the observed Hβ profiles well (see e.g., Figs. 7 and 8).
 |
Fig. 7. Three observed Hβ profiles in period 1996–1998 fitted with the two-component model (disc + one emitting region). |
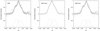 |
Fig. 8. Same as in Fig. 7 but for the averaged profile observed in 1999 (left) and in two activity periods: maximum (middle) and minimum (right). |
It is hard to extract parameters from a best fit of this complex model, since the two-component model has a number of parameters that may be correlated. Therefore, we fit the two-component model to the average of all observed Hβ lines over the course of a year (see also Appendix A). We normalised the line profiles to one and converted wavelengths to velocity scales. As can be seen in Fig. 7, the model can fit the broad Hβ profiles well. In Fig. 7, we show fits of the two component model using the observations from the beginning of the monitoring period (1996–1998). In some cases, where we had more variability in the line intensity, we divided the set of profiles between high activity and profiles with low activity, as in the case of the 1999 data (see Fig. 8).
The line profiles from all periods can be (at least roughly) described with a two-component model, where one component is Gaussian, mostly shifted to the blue and a disc-like component, which is slightly shifted to the blue. There is also an indication that in the low-activity phase, the central component is more shifted than in the active phase. As it can be seen in Fig. 9, compared to the high-activity phase in 2007, the central component is weak and is in the center of the line, while in the phase of low activity (2017 and 2019), the central component is significantly blue-shifted. From the fit we found that in 2007, the shift of the central component is close to zero, while in 2017 the shift is −600 km s−1, and in 2019 is around −1500 km s−1.
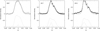 |
Fig. 9. Same as in Fig. 7 but for an averaged profile observed in 2006 and 2007, where the line’s maximum intensity was observed. |
The obtained disc parameters show that there is no major change in the disc parameters, only the intensity of the disc contribution to the line has changed (as well the intensity ratio between the disc and the ILR component). We found that the disc inclination is roughly around 11–12 degrees, the inner radius around 320-420 gravitational radius, the coefficient of the disc emissivity3 is around q ∼ 3, and the disc line is blue shifted (around −600 km s−1). This may indicate the presence of a spreading disc-like region (see e.g., Popović et al. 2011) similar as the disc-like BLR observed in 3C390.3).
4. Discussion
In order to find the nature of the change-look mechanism in the case of NGC 3516, we explored the Hβ line shape over a period of 25 years. The type 1 AGN spectra of NGC 3516 change after 2014 to typical type 2 spectra. Following the line shape changes, we find that the BLR seems to be complex, as was found in Popović et al. (2002), showing two-component emission: one coming from a very broad disc-like region and another which has a narrower Gaussian-like emission. The changes in the Hβ line shape may indicate the change in the BLR geometry.
The maximum of the broad Hβ line occurs in the 1990s; after 1999, the intensity variability remained more prominent (see Fig. 3). The extreme minimum in broad line intensity was observed after 2014. Later on, the broad lines began to appear again with low flux, and from 2017 to 2020, we were able to detect broad Hβ and Hα lines (see Shapovalova et al. 2019; Ilić et al. 2020). For 2021, a trend of increasing Hβ intensity is visible.
The fundamental question we hope to answer with this paper is the mechanism of NGC 3516’s changing appearance. As we noted above, the changing appearance of an AGN can be also caused by obscuring material (absorption). In such a case, the obscuring material could exhibit a patchy distribution. As a result, the dynamical movement of dust clouds might result in a change in the continuum (and broad line) emission, which would affect the current classification.
4.1. Nature of CL mechanism in NGC 3516
The nature of the CL mechanism in NGC 3516 has been investigated in several papers (see e.g., Shapovalova et al. 2019; Ilić et al. 2020; Oknyansky et al. 2021; Mehdipour et al. 2022; Ricci & Trakhtenbrot 2023 etc.). We take into account the two most likely scenarios for the changing-look mechanism discussed in the literature (see also Ricci & Trakhtenbrot 2023, and references therein). The first where CL is due to changes in line-of-sight obscuration, namely, the dust covering the accretion disc and the BLR emission, and the second where CL is due to intrinsic variability, i.e. the emission of the accretion disc and BLR is disappearing.
The first scenario for NGC 3516 was suggested by Oknyansky et al. (2021) on the basis of the correlation between the UV/optical and X-ray variations. These authors found that the correlation was present in the first half of 2020 and afterwards, that correlation disappears, which may indicate an obscuration by Compton-thick clouds crossing the line of sight.
The second scenario, involving intrinsic variability, is caused by some physical mechanisms at inside the central part of an AGN. This can be investigated using X-ray radiation or the phenomenon of accretion-powered radiation. Mehdipour et al. (2022) compared the X-ray flux of NGC 3516 in 2006 when the Hβ line was strong (see Fig. 3) and in the low line flux intensity (observed in 2017). They found that the intrinsic bolometric luminosity of NGC 3516 was lower by a factor of between 4–8 in 2017 than it was in 2006. Contrary to Oknyansky et al. (2021), they suggested that that the CL mechanism is caused by the change in the ionizing spectral energy distribution (SED), without any obscuring effects. Furthermore, studies of the reverberation of the optical and Fe Kα lines have favored the intrinsic mechanism of CL AGN in NGC 3516 (see Feng et al. 2021; Noda 2023). The variability in the broad line fluxes obtained by Feng et al. (2021) supports the intrinsic variability hypotesis. This has been confirmed by Noda (2023), who investigated the variability of the Fe Kα narrow line. Based on the narrow Fe Kα line variability in the low-phase (2013–2014, when the broad Hβ line disappears), they discovered that the iron line emitting region has a radius of ten light-days, which is consistent with the BLR radius in the broad line bright phase. It is interesting to note that these authors concluded that the BLR material remained at the same locations as in the type 1 phase, but there were some effects that extinguished the BLR emission.
The results in the line shape changes of NGC 3516 favor the scenario of intrinsic variability to explain the low BLR emission. It is difficult to explain the variability of the Hβ line shape via an obscuring effect due to the following: a) in the minimum activity or phase of the weak broad lines, the line shapes indicate the presence of the disc-like region and an additional region contributing to the line core similar (almost the same) as in the maximum of activity. The total or partial obscuration should affect the geometry covering the disc emission partly or totally and/or emission of the region that contributes to the line core. Consequently, we can expect quite different broad line shapes in minimum and maximum of activity; b) the observed change in the line profile cannot be explained by crossing the dusty clouds across line of sight between an observer and the BLR, since in this case one can expect velocity dependent line shape changes that are not observed; c) after a total minimum (when the broad lines had almost disappeared), the weak broad line appears in a spreading disc-like BLR, indicating that this effect is connected with intrinsic radiation.
We may also consider a scenario in which the small accretion rate (and therefore smaller flux of ionizing photons) almost extinguish the BLR emission caused by the smaller rate of recombination. In support of this idea, we found that the broad line profiles were complex in both phases, namely: maximum and minimum. It indicates that the BLR geometry has changed by some intrinsic processes, but not by the obscuring material. Furthermore, we can see that the line is broader in the minimum Hβ intensity, indicating that the majority of emission is coming from the part of the BLR closest to the central black hole. It indicates that the changing-look effect in NGC 3516 is caused by the accretion and lack of photons from the central continuum source, which can only ionise the surrounding material4. This scenario is also supported by the lack of X-ray emission in this period. Any lack of accretion (which could be caused by a variety of factors) could result in the absence of the ionisation continuum and, as a result, in extremely weak broad emission lines (see Kim et al. 2018; Noda & Done 2018). For example, Mrk 1018 changed from type 1.9 to 1 and back to 1.9 over a 40 year period, and it appears that NGC 3516 has made type changes in the past, as Hβ shows a broad line in the first observations performed by Seyfert (Seyfert 1943) and a narrow line in 1967 (see Andrillat & Souffrin 1968).
Comparing the CL behavior of NGC 3516 with other AGNs, we see that there is something common with Mrk 1018, since both AGN in the type 1 phase exhibited complex broad Balmer lines, indicating more than one emission line region (Popović et al. 2002; Kim et al. 2018). It seems that we have a disc-like BLR with an ILR that is emitting a Gaussian-like component, which is mostly shifted to the blue, indicating some kind of outflow in the BLR. We cannot exclude the possibility that the outflowing component may be associated with the innermost part of the narrow line region, as noted in Marziani et al. (2022b). However, a strong absorption in the broad UV lines (Goad et al. 1999), as well as in the X-ray (see Kraemer et al. 2002; Turner et al. 2011; Holczer & Behar 2012 etc.) is in favor of the BLR outflowing part. The high-ionisation emission lines (Lyαλ1215, C IV λ1549, N V λ1240, and He II λ1640) showed a significant variation that was on the order of a factor of ∼2 (see Goad et al. 1999). This is similar to what was found in the Hβ and Hα line variations (Shapovalova et al. 2019).
A low X-ray emission was also observed in the period 2013–2014 (Noda et al. 2016) and it was at level of just 5% of the averaged X-ray flux in the1997–2002 period (Noda et al. 2016). However, new results obtained from the narrow Fe Kα line have shown that the BLR material is present in the phase of low broad line emission and there are likely to be some mechanisms that can affect the rate of recombination and consequently turn off the BLR light. We found that line profiles can be described by the emission of the disc-like BLR and an additional emission that contributes mostly to the core of the Hβ line. Also, the disc-like component were present in the low activity phase, which is in agreement with the finding of Noda (2023) that the BLR material is present in the type 2 phase, but the effect of recombination cannot produce strong broad lines.
To clarify the nature of the CL AGN in NGC 3516, we should take into account the key points in the discussion above, summarised as follows:
1. Because broad Hβ line shape variation, as well as X-ray or Fe Kα line variation are detected, the obscuring effect is ruled out. In addition, it is hard to explain how obscuration can affect the line profiles, while the broad line profile can be detected during most of the monitoring period. It seems that there is a change in the contributions of different regions to the total broad line profile.
2. The BLR material remains the same in both phases (high and low broad line intensity, see Noda 2023), but the change affects the rate of recombination, which (in turn) contributes to the line intensity. An additional problem is the intensity of the central continuum, since during the minimum, the optical continuum is too low and the low continuum simply does not reach the gas further out.
3. The disc-like geometry seems to be present in all phases during the monitoring period (except in total minimum 2014/2015). This confirms a rotational motion of emission gas in the BLR. This aspect can be inferred from the broad line parameters. Also, in the low line intensity phase, the line width seems to be broader, indicating that most of the emission is coming closer to the central black hole.
4.2. Role of dust and accretion in the CL mechanism
To better understand the CL nature of NGC 3516, we go on to consider the spectro-polarimetric observations of a number of AGNs, where equatorial scattering in the inner part of the dusty torus is expected (see e.g., Smith et al. 2005; Popović et al. 2022). The reverberation in the polarised broad lines, on the other hand, indicates that the scattering equatorial region is most likely coincident with the dust sublimation region, which is smaller than the estimated inner dusty torus radius (see e.g., Mrk 6 in Shablovinskaya et al. 2020). This may indicate that some amount of dust is present in the BLR (see Gaskell 2009; Czerny et al. 2023) and the amount of dust can influence the rate of recombination in the BLR and consequently the intensity of the broad lines.
In the case of a dusty BLR, the scenario can be described as follows. When the accretion rate is smaller, dust is moving closer to the central source, leading to a dusty BLR. Since the ionisation rate coefficients decrease when dust particles are present in the plasma (see e.g., Liang et al. 2020), the rate of the BLR emission in the broad lines should become weaker and the central continuum emission can be obscured, since dust may also extend in the polar region (see e.g., Stalevski et al. 2019). As the material is approaching the central black hole, the rate of accretion is increasing and the rate of ionisation is higher, so the amount of dust is smaller and the BLR emission is stronger, as well as the emission of the central continuum. In this scenario, the BLR material is also present during the lack of strong broad lines as found in Noda (2023). Additionally, in this case, the geometry of the disc-like region will be present the whole time and the blue-shifted central component (as well as the disc-like line) can be explained by the wind caused by radiation pressure.
We note here that Temple et al. (2023) suggested that in the majority of 412 Swift-BAT-detected CL-AGNs, the CL mechanism is not due to changes in line-of-sight obscuration. Also, changes in the hard X-ray and optical suggest that the accretion drives the changes between the type 1 or type 2. As obscuration by the dust outside the BLR is not likely to explain the changes in the hard X-ray, the scenario of a dusty BLR can be considered a model that is able to explain the CL mechanism in a number of AGNs. Also, recent investigations of the nature of the CL in IRAS 23226-3843 show that it is most probably caused by changes in the accretion rate (see Kollatschny et al. 2023).
5. Conclusions
We investigated the Hβ broad line shape and several related parameters emitted from the BLR of the AGN NGC 3516 observed over a 25-year period. Based on our analysis of the changing broad Hβ line profiles and parameters, we can outline the following conclusions:
-
The broad Hβ line profile has changed during the period, indicating important changes in the BLR structure, which appears to be complex.
-
The changes in the broad Hβ line parameters indicate that the line seems to be broader in the low line intensity phase, which may be due to the emission of material that is coming close to the central black hole. This indicates that the low intensity is probably caused by the rate of recombination in the BLR (or the rate of photoionisation). This may be due to a lack of ionizing photons, which (in turn) may be caused by a lower rate of accretion or the presence of dust in the BLR.
-
The Hβ line profiles can be roughly explained with a two component model, where one component represents a disc-like region and another one is an intermediate component, which is shifted to the blue, indicating a wind from the center. The disc-like component is also shifted to the blue, indicating a windy disc-like region. Both regions are present in both cases, namely: in the maximal and minimal broad line intensity. This also indicates that the emission from these two regions is disappearing due to some intrinsic effect in the BLR.
Finally, we can conclude that the change from type 1 to type 2 of NGC 3516 is most likely caused by intrinsic effects in the BLR. This may be due to the lack of X-ray photons that would be able to photoionise the BLR gas, combined with the effects of dust plunging into the BLR. The photoionisation in a dusty BLR has a lower level of efficiency and, consequently, the rate of recombination is especially low. This may explain why the broad lines in this object to be almost disappearing from the spectrum.
Estimated at 90% maximal intensity in order to avoid the local line peaks caused by the subtraction of the narrow Hβ component.
Note: here the ILR + disc-like BLR decomposition is roughly equivalent to the BLR + VBLR (very broad line region) or ILR + VBLR decomposition considered by several authors (see e.g., Ferland et al. 1990; Sulentic et al. 2000; Popović et al. 2004).
The emissivity is assumed as ε ∼ r−q (see e.g., Popović et al. 2002, 2004).
In E1 context NGC 3516 belongs to spectral type B1, and can be well understood as a low-accretor in Population B or even extreme Population B, as outlined in Marziani et al. (2022a). Therefore at very low accretion rate only the gas in the disc-like region is illuminated.
Acknowledgments
This work is devoted to our dear colleague Alla Ivanovna Shapovalova, who passed away in January 2019. She worked despite difficulties until the very end on the first published paper (Shapovalova et al. 2019) as a pioneer and a leader of reverberation mapping campaign of AGNs at SAO RAS. This work is supported by the Ministry of Science, Technological Development, and Innovation of R. Serbia through projects of Astronomical Observatory Belgrade (contract 451-03-47/2023-01/200002) and the University of Belgrade – Faculty of Mathematics (contract 451-03-68/2022-14/200104). Observations with the SAO RAS telescopes are supported by the Ministry of Science and Higher Education of the Russian Federation. The renovation of telescope equipment is currently provided within the national project “Science and Universities”. The work provided by A.B. and E.S. was performed as part of the SAO RAS government contract approved by the Ministry of Science and Higher Education of the Russian Federation. L.Č.P. and A.B.K. acknowledge the support by Chinese Academy of Sciences President’s International Fellowship Initiative (PIFI) for visiting scientist. D.I. acknowledges the support of the Alexander von Humboldt Foundation.
References
- Adams, T. E., & Weedman, D. W. 1975, ApJ, 199, 19 [NASA ADS] [CrossRef] [Google Scholar]
- Andrillat, Y. 1971, ApJ, 8, 161 [Google Scholar]
- Andrillat, Y., & Souffrin, S. 1968, ApJ, 1, 111 [Google Scholar]
- Antonucci, R. 1993, ARA&A, 31, 473 [Google Scholar]
- Bao, D.-W., Brotherton, M. S., Du, P., et al. 2022, ApJS, 262, 14 [NASA ADS] [CrossRef] [Google Scholar]
- Bianchi, S., Guainazzi, M., Matt, G., et al. 2005, A&A, 442, 185 [NASA ADS] [CrossRef] [EDP Sciences] [Google Scholar]
- Bochkarev, N. G., Shapovalova, A. I., & Zhekov, S. A. 1990, AJ, 100, 1799 [NASA ADS] [CrossRef] [Google Scholar]
- Boksenberg, A., & Netzer, H. 1977, ApJ, 212, 37 [NASA ADS] [CrossRef] [Google Scholar]
- Bon, E., Popović, L. Č., Gavrilović, N., La Mura, G., & Mediavilla, E. 2009, MNRAS, 400, 924 [NASA ADS] [CrossRef] [Google Scholar]
- Brotherton, M. S., Du, P., Xiao, M., et al. 2020, ApJ, 905, 77 [NASA ADS] [CrossRef] [Google Scholar]
- Chen, K., & Halpern, J. P. 1989, ApJ, 344, 115 [NASA ADS] [CrossRef] [Google Scholar]
- Chen, Y.-J., Bao, D.-W., Zhai, S., et al. 2023, MNRAS, 520, 1807 [NASA ADS] [CrossRef] [Google Scholar]
- Collin-Souffrin, S. 1980, Variability of Stars and Galaxies-Proceedings of the Fifth Europian Regional Meeting in Astronomy (Liege, Belgium: Institute d’Astrophysics), Cl. 11 [Google Scholar]
- Collin-Souffrin, S., Allein, D., & Andrillat, Y. 1973, A&A, 22, 343 [NASA ADS] [Google Scholar]
- Crenshaw, D. M. 1986, ApJS, 62, 821 [NASA ADS] [CrossRef] [Google Scholar]
- Czerny, B., Zajaček, M., Naddaf, M.-H., et al. 2023, EPJD, 77, 56 [NASA ADS] [CrossRef] [EDP Sciences] [Google Scholar]
- Denney, K. D., Peterson, B. M., Pogge, R. W., et al. 2010, ApJ, 721, 715 [NASA ADS] [CrossRef] [Google Scholar]
- De Rosa, G., Fausnaugh, M. M., Grier, C. J., et al. 2018, ApJ, 866, 133 [NASA ADS] [CrossRef] [Google Scholar]
- Dimitrijević, M. S., Popović, L. Č., Kovačević, J., Dačić, M., & Ilić, D. 2007, MNRAS, 374, 1181 [CrossRef] [Google Scholar]
- Du, P., Brotherton, M. S., Wang, K., et al. 2018, ApJ, 869, 142 [CrossRef] [Google Scholar]
- Elitzur, M. 2012, ApJ, 747, L33 [Google Scholar]
- Eracleous, M., & Halpern, J. P. 1994, ApJS, 90, 1 [NASA ADS] [CrossRef] [Google Scholar]
- Eracleous, M., Livio, M., Halpern, J. P., & Storchi-Bergmann, T. 1995, ApJ, 438, 610 [NASA ADS] [CrossRef] [Google Scholar]
- Feng, H.-C., Hu, C., Li, S.-S., et al. 2021, ApJ, 909, 18 [NASA ADS] [CrossRef] [Google Scholar]
- Ferland, G. J., Korista, K. T., & Petersonet, B. M. 1990, ApJ, 363L, 21 [Google Scholar]
- Holczer, T., & Behar, E. 2012, ApJ, 747, 71 [NASA ADS] [CrossRef] [Google Scholar]
- Hon, W. J., Webster, R., & Wolf, C. 2020, MNRAS, 497, 192 [NASA ADS] [CrossRef] [Google Scholar]
- Hon, W. J., Wolf, C., Onken, C. A., Webster, R., & Auchettl, K. 2022, MNRAS, 511, 54 [NASA ADS] [CrossRef] [Google Scholar]
- Hu, C., Li, S.-S., Guo, W.-J., et al. 2020, ApJ, 905, 75 [NASA ADS] [CrossRef] [Google Scholar]
- Gaskell, C. M. 2009, New A. Rev., 53, 140 [NASA ADS] [CrossRef] [Google Scholar]
- Gaskell, C. M., & Harrington, P. Z. 2018, MNRAS, 478, 1660 [NASA ADS] [CrossRef] [Google Scholar]
- Goad, M. R., Koratkar, A. P., Kim-Quijano, J., et al. 1999, ApJ, 524, 707 [NASA ADS] [CrossRef] [Google Scholar]
- Guo, H., Shen, Y., He, Z., et al. 2020, ApJ, 888, 58 [NASA ADS] [CrossRef] [Google Scholar]
- Ilić, D., Oknyansky, V., Popović, L. Č., et al. 2020, A&A, 638, A13 [NASA ADS] [CrossRef] [EDP Sciences] [Google Scholar]
- Kim, D.-C., Yoon, I., & Evans, A. S. 2018, ApJ, 861, 51 [Google Scholar]
- Kollatschny, W., & Fricke, K. J. 1985, A&A, 146, L11 [NASA ADS] [Google Scholar]
- Kollatschny, W., Grupe, D., Parker, M. L., et al. 2023, A&A, 670, A103 [NASA ADS] [CrossRef] [EDP Sciences] [Google Scholar]
- Kovačević, J., Popović, L. Č., & Dimitrijević, M. S. 2010, ApJS, 189, 15 [Google Scholar]
- Kraemer, S. B., Crenshaw, D. M., George, I. M., et al. 2002, ApJ, 577, 98 [NASA ADS] [CrossRef] [Google Scholar]
- León-Tavares, J., Chavushyan, V., Patiño-Álvarez, V., et al. 2013, ApJ, 763, L36 [CrossRef] [Google Scholar]
- Liang, Y., Wu, J., Li, H., et al. 2020, Plasma Sci. Technol., 22, 034003 [NASA ADS] [CrossRef] [Google Scholar]
- Lyutyi, V. M., & Doroshenko, V. T. 1993, Astron. Lett., 19, 405 [NASA ADS] [Google Scholar]
- Lyutyj, V. M., Oknyanskij, V. L., & Chuvaev, K. K. 1984, Pisma v Astronomicheskii Zhurnal, 10, 803 [NASA ADS] [Google Scholar]
- MacLeod, C. L., Ross, N. P., Lawrence, A., et al. 2016, MNRAS, 457, 389 [Google Scholar]
- MacLeod, C. L., Green, P. J., Anderson, S. F., et al. 2019, ApJ, 874, 8 [Google Scholar]
- Marziani, P., Bon, E., Bon, N., et al. 2022a, Astronomische Nachrichten, 343, e210082 [NASA ADS] [CrossRef] [Google Scholar]
- Marziani, P., Deconto-Machado, A., & Del Olmo, A. 2022b, Galaxies, 10, 54 [NASA ADS] [CrossRef] [Google Scholar]
- Mathur, S., Denney, K. D., Gupta, A., et al. 2018, ApJ, 866, 123 [NASA ADS] [CrossRef] [Google Scholar]
- Mehdipour, M., Kriss, G. A., Brenneman, L. W., et al. 2022, ApJ, 925, 84 [NASA ADS] [CrossRef] [Google Scholar]
- Noda, H., & Done, C. 2018, MNRAS, 480, 3898 [Google Scholar]
- Noda, H., Minetal, T., Minezaki, T., et al. 2023, ApJ, 943, 63 [NASA ADS] [CrossRef] [Google Scholar]
- Noda, H., Minezaki, T., Watanabe, M., et al. 2016, ApJ, 828, 78 [NASA ADS] [CrossRef] [Google Scholar]
- Oknyansky, V. L., Brotherton, M. S., Tsygankov, S. S., et al. 2021, MNRAS, 505, 1029 [NASA ADS] [CrossRef] [Google Scholar]
- Osterbrock, D. E. 1977, ApJ, 215, 733 [Google Scholar]
- Peterson, B. M., Denney, K. D., De Rosa, G., et al. 2013, ApJ, 779, 109 [NASA ADS] [CrossRef] [Google Scholar]
- Popović, L. Č. 2020, Open Astron., 29, 1 [Google Scholar]
- Popović, L. Č., Mediavilla, E. G., Kubičela, A., & Jovanović, P. 2002, A&A, 390, 473 [NASA ADS] [CrossRef] [EDP Sciences] [Google Scholar]
- Popović, L. Č., Mediavilla, E. G., Bon, E., & Ilić, D. 2004, A&A, 423, 909 [NASA ADS] [CrossRef] [EDP Sciences] [Google Scholar]
- Popović, L. Č., Shapovalova, A. I., Ilić, D., et al. 2011, A&A, 528, A130 [NASA ADS] [CrossRef] [EDP Sciences] [Google Scholar]
- Popović, L. Č., Shapovalova, A. I., Ilić, D., et al. 2014, A&A, 572, A66 [NASA ADS] [CrossRef] [EDP Sciences] [Google Scholar]
- Popović, L. Č., Kovačević-Dojčinović, J., & Marčeta-Mandić, S. 2019, MNRAS, 484, 3180 [Google Scholar]
- Popović, L. Č., Shablovinskaya, E. S., & Savić, D. 2022, Astron. Nachr., 343, e210089 [Google Scholar]
- Ricci, C., & Trakhtenbrot, B. 2023, Nat. Astron., [arXiv:2211.05132] [Google Scholar]
- Sánchez-Sáez, P., Lira, H., Martí, L., et al. 2021, AJ, 162, 206 [CrossRef] [Google Scholar]
- Seyfert, C. 1943, ApJ, 97, 28 [NASA ADS] [CrossRef] [Google Scholar]
- Shablovinskaya, E. S., Afanasiev, V. L., & Popović, L. Č. 2020, ApJ, 892, 118 [NASA ADS] [CrossRef] [Google Scholar]
- Shapovalova, A. I., Doroshenko, V. T., Bochkarev, N. G., et al. 2004, A&A, 422, 925 [NASA ADS] [CrossRef] [EDP Sciences] [Google Scholar]
- Shapovalova, A. I., Popović, L. Č., Collin, S., et al. 2008, A&A, 486, 99 [NASA ADS] [CrossRef] [EDP Sciences] [Google Scholar]
- Shapovalova, A. I., Popović, L. Č., Bochkarev, N. G., et al. 2010, A&A, 517, A42 [NASA ADS] [CrossRef] [EDP Sciences] [Google Scholar]
- Shapovalova, A. I., Popović, L. Č., Burenkov, A. N., et al. 2012, ApJS, 202, 10 [NASA ADS] [CrossRef] [Google Scholar]
- Shapovalova, A. I., Popović, L. Č., Bochkarev, N. G., et al. 2013, A&A, 559, A10 [NASA ADS] [CrossRef] [EDP Sciences] [Google Scholar]
- Shapovalova, A. I., Popović, L. Č., Chavushyan, V., et al. 2016, ApJS, 222, 25 [NASA ADS] [CrossRef] [Google Scholar]
- Shapovalova, A. I., Popović, L. Č., Chavushyan, V., et al. 2017, MNRAS, 466, 4759 [NASA ADS] [Google Scholar]
- Shapovalova, A. I., Popović, L. Č., et al. 2019, MNRAS, 485, 4790 [NASA ADS] [CrossRef] [Google Scholar]
- Smith, J. E., Robinson, A., Young, S., Axon, D. J., & Corbett, E. A. 2005, MNRAS, 359, 846 [Google Scholar]
- Śniegowska, M., Czerny, B., Bon, E., & Bon, N. 2020, A&A, 641A, 167 [Google Scholar]
- Śniegowska, M., Grzedzielski, M., Czerny, B., & VJaniuk, A. 2022, Astron. Nachr., 343, e210065 [Google Scholar]
- Souffrin, S. 1968, AJ, 73, 897 [NASA ADS] [CrossRef] [Google Scholar]
- Stalevski, M., Tristram, K. R. W., & Asmus, D. 2019, MNRAS, 484, 33 [Google Scholar]
- Stern, D., McKernan, B., Graham, M. J., et al. 2018, ApJ, 864, 27 [Google Scholar]
- Sulentic, J. W., Marziani, P., & Dultzin-Hacyan, D. 2000, ARA&A, 38, 521 [Google Scholar]
- Urry, C. M., & Padovani, P. 1995, PASP, 107, 80 [Google Scholar]
- Temple, M. J., Ricci, C., Koss, M. J., et al. 2023, MNRAS, 518, 2938 [Google Scholar]
- Turner, T. J., Miller, L., Kraemer, S. B., & Reeves, J. N. 2011, ApJ, 733, 48 [NASA ADS] [CrossRef] [Google Scholar]
- van Wanders, I., Groningen, E., Alloin, D., et al. 1993, A&A, 269, 39 [NASA ADS] [Google Scholar]
- Wanders, I., & Horne, K. 1994, A&A, 289, 76 [NASA ADS] [Google Scholar]
- Wang, J.-M., & Bon, E. 2020, A&A, 643, L9 [NASA ADS] [CrossRef] [EDP Sciences] [Google Scholar]
- Yang, Q., Wu, X.-B., Fan, X., et al. 2018, ApJ, 862, 19 [NASA ADS] [CrossRef] [Google Scholar]
Appendix A: Modeled line profiles
Here, we show the decomposition using a two-component model of the Hβ broad lines profiles for different epochs. It is important to note that in almost in all periods (excluding the minimum Hβ intensity in 2014–2015), the line can be reasonably well fitted with a disc and an outflow component.
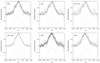 |
Fig. A.1. Same as in Fig. 7, but for averaged profiles corresponding to 2000, 2001 (whole period and minimum-maximum periods), 2002, and 2003, where the line was in the minimum. |
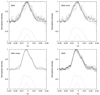 |
Fig. A.2. Same as in Fig. 7, but for profiles observed in 2004, where the minimum is given in the second and the maximum in the third panel. The fourth panel shows the model for Hβ profile observed in 2005. |
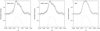 |
Fig. A.3. Same as in Fig. 7, but for an averaged profile observed in 2006 and 2007, where the line maximum intensity was observed. |
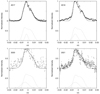 |
Fig. A.4. Same as in Fig. 7, but for an averaged Hα profiles observed in 2017 and 2019 and for Hβ observed in 2020 and 2021, where the line minimum in the broad lines was observed. |
All Figures
|
Fig. 1. Hβ wavelength band of NGC 3516 observed from 1996 to 2021. The spectra are normalised to the [O III] line flux. |
| In the text | |
|
Fig. 2. Example of the procedure of the extracting broad Hβ component for a spectrum with weak Balmer lines (from 12-Feb-2021). First, the host galaxy contribution was subtracted from the observed spectrum. Afterwards, the continuum was estimated and subtracted and the broad and narrow lines were fitted (bottom spectrum). |
| In the text | |
|
Fig. 3. All Hβ broad profiles observed during the monitoring period. The extracted broad line profiles are grouped within calendar years. The broad Hβ intensity is normalised to the [O III] lines (see Fig. 1). |
| In the text | |
|
Fig. 4. Modelled broad Hβ line shapes during the monitoring period. The normalised (to unity) mean Hβ profile (solid line) and corresponding rms (dashed line) in the velocity scale is given for each year. |
| In the text | |
|
Fig. 5. Measured broad Hβ line parameters during the monitoring period (from up to down): Intensity (first panel), FWHM (second panel) and FW10%M (third panel), asymmetries measured at FWHM (forth panel), and FW10%M (fifth panel). The used notation is: blue represents the maximum activity (> 0.7Imax), red the extreme minimum activity (< 0.3Imax) and black represents observation between these two activity phase (0.3Imax < I < 0.7Imax). |
| In the text | |
|
Fig. 6. Ratio of the FWHM and FW10%M for Hβ during the monitoring period. The horizontal line represents the value expected in the case of a Gaussian line profile. |
| In the text | |
|
Fig. 7. Three observed Hβ profiles in period 1996–1998 fitted with the two-component model (disc + one emitting region). |
| In the text | |
|
Fig. 8. Same as in Fig. 7 but for the averaged profile observed in 1999 (left) and in two activity periods: maximum (middle) and minimum (right). |
| In the text | |
|
Fig. 9. Same as in Fig. 7 but for an averaged profile observed in 2006 and 2007, where the line’s maximum intensity was observed. |
| In the text | |
|
Fig. A.1. Same as in Fig. 7, but for averaged profiles corresponding to 2000, 2001 (whole period and minimum-maximum periods), 2002, and 2003, where the line was in the minimum. |
| In the text | |
|
Fig. A.2. Same as in Fig. 7, but for profiles observed in 2004, where the minimum is given in the second and the maximum in the third panel. The fourth panel shows the model for Hβ profile observed in 2005. |
| In the text | |
|
Fig. A.3. Same as in Fig. 7, but for an averaged profile observed in 2006 and 2007, where the line maximum intensity was observed. |
| In the text | |
|
Fig. A.4. Same as in Fig. 7, but for an averaged Hα profiles observed in 2017 and 2019 and for Hβ observed in 2020 and 2021, where the line minimum in the broad lines was observed. |
| In the text | |
Current usage metrics show cumulative count of Article Views (full-text article views including HTML views, PDF and ePub downloads, according to the available data) and Abstracts Views on Vision4Press platform.
Data correspond to usage on the plateform after 2015. The current usage metrics is available 48-96 hours after online publication and is updated daily on week days.
Initial download of the metrics may take a while.