Open Access
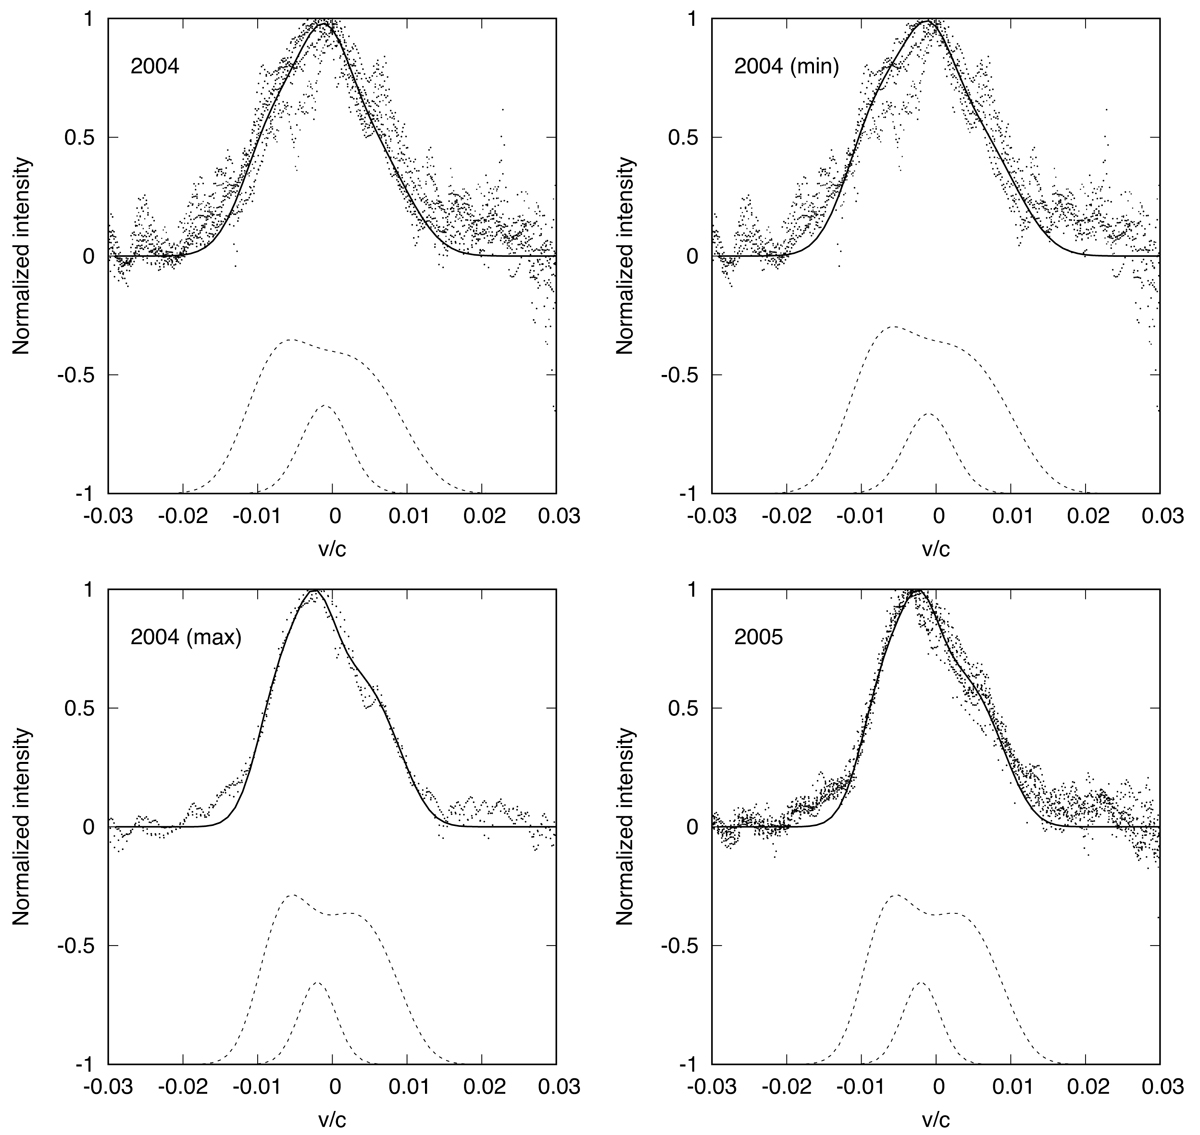
Fig. A.2.
Download original image
Same as in Fig. 7, but for profiles observed in 2004, where the minimum is given in the second and the maximum in the third panel. The fourth panel shows the model for Hβ profile observed in 2005.
Current usage metrics show cumulative count of Article Views (full-text article views including HTML views, PDF and ePub downloads, according to the available data) and Abstracts Views on Vision4Press platform.
Data correspond to usage on the plateform after 2015. The current usage metrics is available 48-96 hours after online publication and is updated daily on week days.
Initial download of the metrics may take a while.