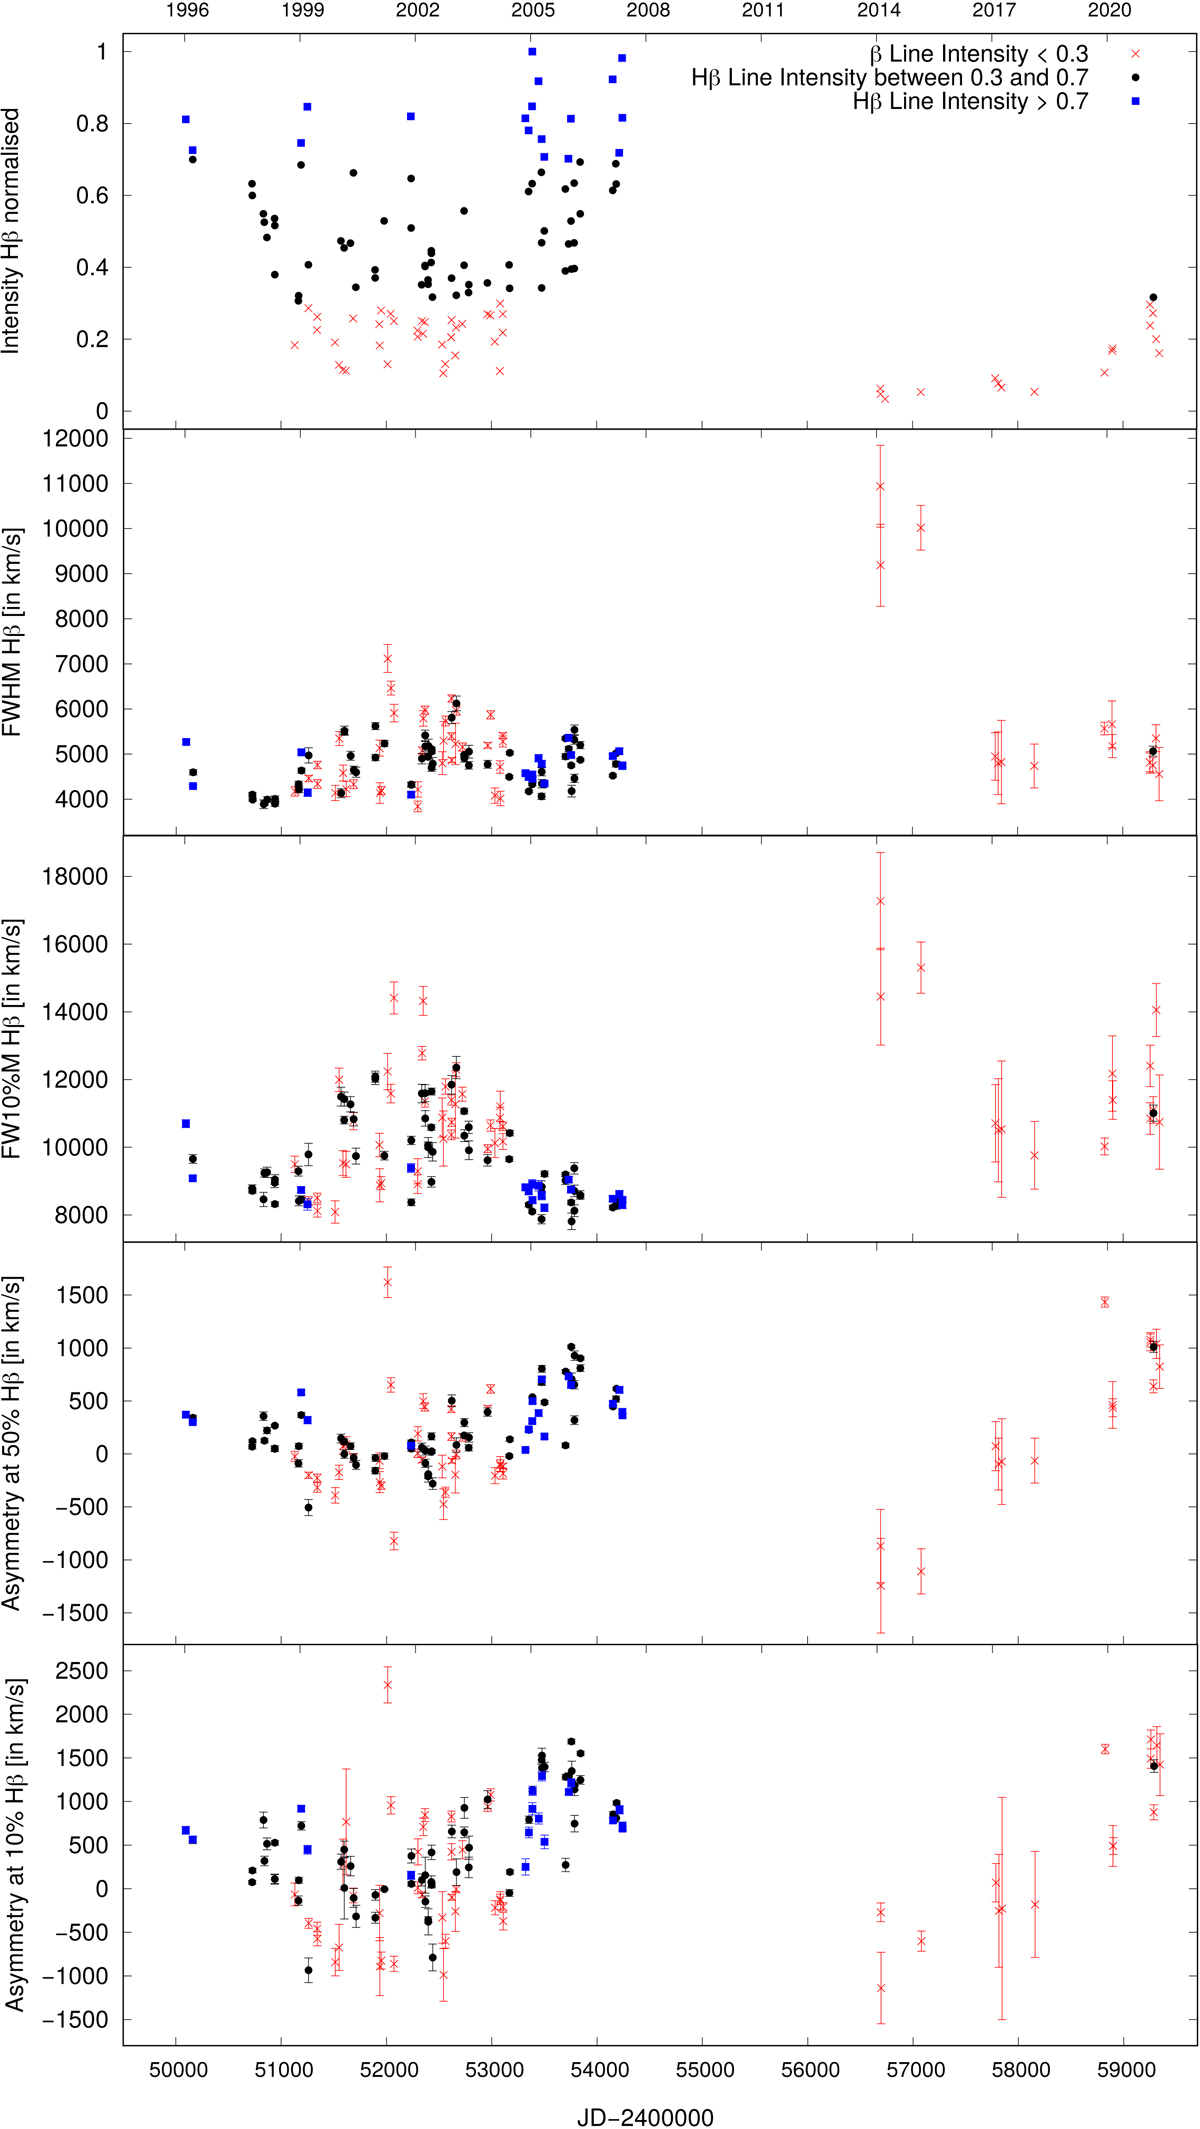
Fig. 5.
Download original image
Measured broad Hβ line parameters during the monitoring period (from up to down): Intensity (first panel), FWHM (second panel) and FW10%M (third panel), asymmetries measured at FWHM (forth panel), and FW10%M (fifth panel). The used notation is: blue represents the maximum activity (> 0.7Imax), red the extreme minimum activity (< 0.3Imax) and black represents observation between these two activity phase (0.3Imax < I < 0.7Imax).
Current usage metrics show cumulative count of Article Views (full-text article views including HTML views, PDF and ePub downloads, according to the available data) and Abstracts Views on Vision4Press platform.
Data correspond to usage on the plateform after 2015. The current usage metrics is available 48-96 hours after online publication and is updated daily on week days.
Initial download of the metrics may take a while.