Open Access
Fig. A.4.
Download original image
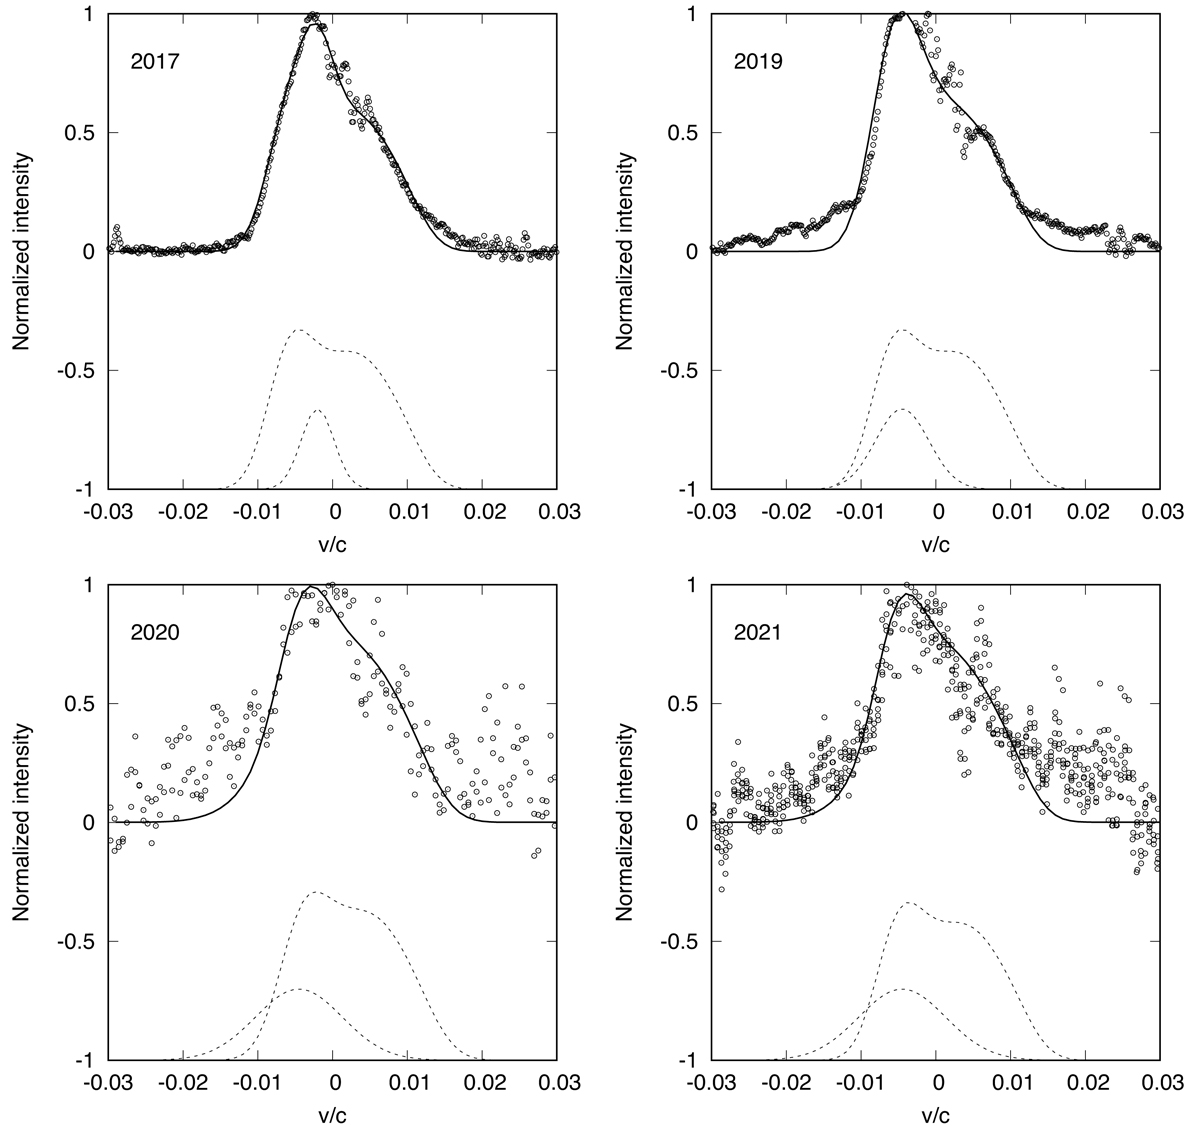
Same as in Fig. 7, but for an averaged Hα profiles observed in 2017 and 2019 and for Hβ observed in 2020 and 2021, where the line minimum in the broad lines was observed.
Current usage metrics show cumulative count of Article Views (full-text article views including HTML views, PDF and ePub downloads, according to the available data) and Abstracts Views on Vision4Press platform.
Data correspond to usage on the plateform after 2015. The current usage metrics is available 48-96 hours after online publication and is updated daily on week days.
Initial download of the metrics may take a while.