| Issue |
A&A
Volume 675, July 2023
|
|
|---|---|---|
| Article Number | A40 | |
| Number of page(s) | 18 | |
| Section | Extragalactic astronomy | |
| DOI | https://doi.org/10.1051/0004-6361/202245549 | |
| Published online | 29 June 2023 | |
Detections of 21 cm absorption with a blind FAST survey at z ≤ 0.09
1
Aix-Marseille Univ., CNRS, CNES, LAM, 13388 Marseille, France
e-mail: wenkai.hu@lam.fr
2
National Astronomical Observatories, Chinese Academy of Sciences, Beijing, 100101
PR China
e-mail: wangyg@bao.ac.cn, xuelei@cosmology.bao.ac.cn
3
ARC Centre of Excellence for All Sky Astrophysics in 3 Dimensions (ASTRO 3D), Mt Stromlo Rd, Australian Capital Territory, 2611
Australia
4
Key Laboratory of Cosmology and Astrophysics (Liaoning) & College of Sciences, Northeastern University, Shenyang, 110819
PR China
5
School of Astronomy and Space Science, University of Chinese Academy of Sciences, Beijing, 100049
PR China
6
Institute of Astronomy and Astrophysics, Academia Sinica, Astronomy-Mathematics Building, No. 1, Sec. 4, Roosevelt Road, Taipei, 10617 Taiwan, PR China
7
Canadian Institute for Theoretical Astrophysics, University of Toronto, 60 S George Street, Toronto, ON, M5S 3H8
Canada
8
Canadian Institute for Advanced Research, 180 Dundas St West, Toronto, ON, M5G 1Z8
Canada
9
Dunlap Institute for Astronomy and Astrophysics, University of Toronto, 50 St George Street, Toronto, ON, M5S 3H4
Canada
10
Perimeter Institute of Theoretical Physics, 31 Caroline Street North, Waterloo, ON, N2L 2Y5
Canada
11
Research Center for Intelligent Computing Platforms, Zhejiang Laboratory, Hangzhou, 311100
PR China
Received:
24
November
2022
Accepted:
25
April
2023
We present the early science results from a blind search of the extragalactic H I 21 cm absorption lines at z ≤ 0.09 with the drift-scan observation of the Five-hundred-meter Aperture Spherical radio Telescope (FAST). We carried out the search using the data collected over 643.8 h by the ongoing Commensal Radio Astronomy FasT Survey (CRAFTS), which spans a sky area of 3155 deg2 (∼81% of CRAFTS sky coverage up to January 2022) and covers 44827 radio sources with a flux density greater than 12 mJy. Due to the radio frequency interference (RFI), only the relatively clean data in the frequency range of 1.3–1.45 GHz are used in the present work. Under the assumption of Ts/cf = 100 K, the total completeness-corrected comoving absorption path length spanned by our data and sensitive to Damped Lyman α Absorbers (DLAs; NH I ⩾ 2 × 1020 cm−2) is ΔXinv = 8.33 × 10³ (Δzinv = 7.81 × 10³) for intervening absorption. For associated absorption, the corresponding value is ΔXasc = 1.28 × 101 (Δzasc = 1.19 × 101). At each time point of the drift scan, a matched-filtering approach is used to search H I absorbers. Combining the information of observation mode and the distribution of the beams that detect the same candidates, spurious absorbers are successfully excluded. Three known H I absorbers (UGC 00613, 3C 293, and 4C +27.14) and two new H I absorbers (towards the direction of NVSS J231240–052547 and NVSS J053118+315412) are detected blindly. We fitted the H I profiles with multi-component Gaussian functions and calculated the redshift (0.063, 0.066), width, flux density, optical depth, and H I column densities for each absorption. Our results demonstrate the power of FAST in blindly searching H I absorbers. For absorption towards NVSS J231240–052547, the optical counterparts are faint and currently lack existing spectra. The most likely interpretation is that a radio-loud active galactic nucleus (AGN) is faint in the optical as the background source, with a faint optical absorber in between. NVSS J053118+315412 exhibits an associated absorption with a complex profile, which may suggest unsettled gas structures or gas accretion onto the supermassive black hole (SMBH). The expanding collection of blind radio detections in the ongoing CRAFTS survey offers a valuable opportunity to study AGNs, associated interstellar medium (ISM) interaction, and intervening absorbers optically without overwhelming quasi-stellar object (QSO) background light.
Key words: radio lines: galaxies / line: identification / radio continuum: galaxies / quasars: absorption lines / methods: observational / methods: data analysis
© The Authors 2023
 Open Access article, published by EDP Sciences, under the terms of the Creative Commons Attribution License (https://creativecommons.org/licenses/by/4.0), which permits unrestricted use, distribution, and reproduction in any medium, provided the original work is properly cited.
This article is published in open access under the Subscribe to Open model. Subscribe to A&A to support open access publication.
1. Introduction
Hydrogen is the most abundant and widely distributed element in the Universe. The 21 cm hyperfine transition of neutral hydrogen (H I) has been used as an important tool in the study of a wide range of astrophysical processes, including galaxy dynamics, galaxy mergers, and galaxy interaction, star formation history, as well as tracing the cosmic large-scale structure (Chang et al. 2008).
Substantial effort has been dedicated to measuring the H I emission line; for example, the H I Parkes All Sky Survey (HIPASS; Zwaan et al. 2004; Meyer et al. 2004), the Arecibo Legacy Fast Arecibo L-Band Feed Array (ALFALFA) survey (Giovanelli et al. 2005, 2007; Saintonge 2007), and the Jansky Very Large Array (JVLA) deep survey (Jarvis et al. 2014). However, due to the limited sensitivity of the telescopes, wide-field H I emission surveying has been limited to the local Universe, while individual 21 cm deep field surveys have only detected H I galaxies up to z ≈ 0.3 (Catinella et al. 2008; Zwaan et al. 2001; Verheijen et al. 2007; Fernández et al. 2016). Combined with the observations of damped DLAs at high-z, the H I mass density (ΩH I) of the Universe is well-constrained at z < 0.2 and 2 < z < 5, with the H I content poorly constrained at 0.2 < z < 2 (see Hu et al. 2019 and references therein).
The H I 21 cm absorption lines, arising from H I gas absorbing the flux of the bright background source, could be a complement to the observation of the H I emission at higher redshifts. Unlike H I flux in emission, which is flux-limited, the detectability of the H I absorption depends only on the column density of foreground gas and the strength of the background sources. H I absorption may be a good alternative tool to measure the H I content and constrain the redshift evolution of ΩH I at intermediate redshifts 0.2 < z < 2 (Morganti & Oosterloo 2018; Grasha et al. 2020).
Two types of H I absorption systems exist, with one being the associated absorption system where the absorbing gas is situated in the same extragalactic object that emits the background bright continuum. Studies of associated absorption systems typically concentrate on the extragalactic object (usually an AGN) and its interaction with the ISM within the same object. This includes exploring the kinematics and structure of the ISM in galaxies that host AGNs and investigating the potential mechanisms by which H I gas fuels supermassive black holes.
Significant progress has been made in associated absorption studies in the past two decades (see Morganti & Oosterloo 2018 for a review). Some physical pictures have been established and revealed by observations, including the detection of circumnuclear absorbing structures containing H I (Taylor 1996; Struve & Conway 2010), the identification of H I outflows potentially driven by the jet (Morganti et al. 2003; Schulz et al. 2021) and the indication of the fuelling of a SMBH through the accretion of small gas clouds (Araya et al. 2010; Maccagni et al. 2014). Although many discoveries have been made, the statistics are still limited by small sample sizes, and there is a lack of conclusive observational evidence for H I playing a role in fuelling the central SMBH. To further the understanding of H I associated absorption, a larger and more diverse sample from different physical environments is necessary.
The other type of H I absorption system is referred to as the intervening absorption system that results from gas in a foreground Galactic or extragalactic object absorbing the flux of a bright background source that is not related. The intervening absorptions are usually employed to investigate the ISM characteristics in both our Galaxy and distant galaxies. A major fraction of the neutral hydrogen of the post-reionisation universe has been found in DLAs, which are found in the optical spectrum of QSO as strong H I absorption lines with NH I ⩾ 2 × 1020 cm−2 (Wolfe et al. 2005). Despite numerous studies, the physical nature of the DLAs remains an unsolved problem (for recent work, see, e.g. Bordoloi et al. 2022). The QSOs used for such searches are usually bright, making it difficult to observe the optical emission from the DLA system itself, in analogy to the practical challenge of detecting planets in reflected light. Besides this, the optical surveys have additional biases from dust extinction, which could be systematically correlated to the self-shielding required for the existence of DLAs, to the gravitational magnification bias.
Most radio-loud QSOs are optically faint, opening up the possibility of uncovering a sample of absorption systems without blinding the optical background. To our knowledge, only two 21 cm absorbers (towards UGC 6081 and 3C 286) have been discovered in untargeted blind radio searches to date. The absorber in UGC 6081 is an associated system (Darling et al. 2011) and 3C 286 is a bright optical QSO (Brown & Roberts 1973). Only 18 21 cm absorbers have been discovered in bright radio sources’ targeted blind radio searches (Darling et al. 2004; Allison et al. 2015, 2020; Grasha et al. 2020; Sadler et al. 2020; Gupta et al. 2021a,b; Mahony et al. 2022). Of these, 16 still had a bright optical QSO, one had a radio background with unknown type (Allison et al. 2020) and one had a powerful radio galaxy (PKS 0409-75) with a velocity separation of 3000 km s−1 and should be considered an associated absorber (Mahony et al. 2022).
Blind radio searches offer the opportunity to detect DLAs in front of optically faint QSOs, enabling a detailed study of DLA properties without interference from a bright background source. A rare opportunity was the observation of the afterglow of GRB030323, which showed both a DLA and Lyman α emission (Vreeswijk et al. 2004) in the gamma-ray burst (GRB) host galaxy. However, at present, the number of DLAs detected from GRB afterglow is still very low.
To achieve sufficient sensitivity, detecting the relatively weak 21 cm absorption technically requires a long integration time, and the observation is also affected by technical limitations such as unstable bandpass and RFI. Knowing that the compact sources have the higher rate of H I absorption detection (Emonts et al. 2010; Chandola et al. 2011) and the majority of DLAs show strong MgII absorption, most H I absorption searches have been pointed at selected targets with these features. However, these pre-selection methods could introduce biases in studying the intrinsic physics of H I absorptions, which have not been well-understood.
An unbiased radio survey would address the DLA question directly, help overcome these limitations, and also produce a more comprehensive depiction of the interaction between the ISM and host galaxy. Darling et al. (2011) carried out a pilot search of H I 21 cm absorption spanning −650 km s−1 < cz < 17 500 km s−1 and covering 517.0 deg2 with the ALFALFA Survey. The intrinsic absorption of UGC 6081 was re-detected, but no new absorption line systems were detected. Allison et al. (2020) reported a spectroscopically blind search for 21 cm absorption lines in the First Large Absorption Survey in H I (FLASH; Allison et al. 2022) using the Australian Square Kilometre Array Pathfinder (ASKAP). No absorptions were found in a purely blind search of the GAMA 23 field. Still, a 21 cm absorption at z = 0.3562 towards NVSS J224500-343030 was detected after cross-matching the radio sources with optical spectroscopic identifications of galaxies. Moreover, Su et al. (2022) presented the results of a search for 21 cm H I absorption from three Galaxy And Mass Assembly (GAMA) survey fields. Two associated H I absorption systems in SDSS J090331+010847 and SDSS J113622+004852 are detected from a sample of 326 radio sources with 855.5 MHz peak flux density over 10 mJy. Recently, Gupta et al. (2021b) developed the Automated Radio Telescope Imaging Pipeline (ARTIP), which is designed to process large volumes of radio interferometric data from the MeerKAT Absorption Line Survey (MALS). Applying this pipeline to the observations of a field centred on PKS 1830-211, they re-detected the known H I 21 cm absorption at z = 0.19, and OH 1665 and 1667 MHz absorption at z = 0.89 using the MeerKat L-band (Gupta et al. 2021b) and UHF bands (Combes et al. 2021).
In the not-too-distant future, an unbiased census of intrinsic H I absorption could be established by large, blind, H I absorption line surveys planned with the next-generation telescopes, that is, the Square Kilometre Array or its pathfinders, including the MeerKAT Absorption Line Survey (MALS; Gupta et al. 2018), the Widefield ASKAP L-band Legacy All-sky Blind surveY (WALLABY; Koribalski et al. 2020), the First Large Absorption Survey in H I (FLASH; Allison et al. 2020), and the Search for H I Absorption with AperTIF (SHARP; Maccagni et al. 2017).
As a complement in the northern hemisphere, FAST (Nan et al. 2011; Jiang et al. 2020) can play an important role in blind surveys of H I absorption. FAST is the largest filled-aperture single-dish radio antenna in the world, with high sensitivity and large sky coverage. Equipped with a 19-beam sL-band receiver, covering a wide band from 1050 MHz to 1450 MHz (Smith et al. 2017; Jiang et al. 2020) and corresponding to a redshift of 0 < z < 0.35 for H I observations, FAST can effectively search for H I absorption lines in the above redshift range. According to the forecast provided by Yu et al. (2017), FAST should be able to detect ∼200 H I absorption systems, including associated and intervening systems, in a one-month survey around the celestial equator. Zhang et al. (2021) presented a study of extragalactic H I 21 cm absorption lines using FAST. They observed five H I absorption systems that were previously identified in the 40% data release of the ALFALFA survey. The H I absorption profiles given by FAST have much higher spectral resolution and higher signal-to-noise ratio (S/N) than obtained in the previous searches, demonstrating the power of FAST in revealing detailed structures of H I absorption lines. Also, Zheng et al. (2020) carried out an OH absorption survey towards eight associated and one intervening H I absorbers at redshifts of z ∈ [0.1919, 0.2241] using FAST and constrained the OH-to-H I relative abundance ([OH]/[HI]) to be ≤ 5.45 ×10⁻⁸.
In this paper, we report the early science results from a purely blind search for H I absorption lines at z ≤ 0.09 in ∼81% (643.8 hours and 3155 deg2) of the sky covered by the CRAFTS survey up to January 2022. Three known H I absorbers (UGC 00613, 3C 293, and 4C +27.14) and two new H I absorbers (NVSS J231240–052547 and NVSS J053118+315412) are found using our search pipeline. The signal of 4C +27.14 has also been re-detected in follow-up observations with FAST.
This paper is organised as follows. Section 2 describes the CRAFTS data and the follow-up observation used in this work. We then summarise the data processing procedure, including candidate searching by the matched-filtering approach and candidate selection methods and H I absorption measuring method in Sect. 3. The ten candidates selected from the CRAFTS data and the confirmed H I absorbers are presented in Sect. 4. We discuss the future implications of our methods for the blind H I absorption survey in Sect. 5. In Sect. 6, a summary of this work is presented. Throughout this paper, we assume H0 = 70 km s−1 Mpc−1, Ωm = 0.3, and ΩΛ = 0.7, but the results are not sensitive to these parameters.
2. Data
2.1. CRAFTS
The Commensal Radio Astronomy FasT Survey (CRAFTS; Li et al. 2018) is a multi-purpose drift-scan survey using the FAST L-band Array of 19 feed horns (FLAN; Dunning et al. 2017, 2017) that aims to observe the Galactic and extragalactic H I emission and to search for pulsars and radio transients. According to the CRAFTS plan, the survey region will be observed by two passes of drift scans, with the 19-beam feed rotated by 23.4° to achieve a super-Nyquist sampling of the surveyed area. The full survey will cover over 20 000 deg2 within a declination (DEC) range between −14° and 66°, and it will reach a redshift of 0.35. Limited by the allocated time, there is only one survey pass at present.
In Fig. 1, we show the CRAFTS sky coverage up to January 7, 2022. Data have been taken for both the orange and blue regions, while the orange regions have been used for H I absorption search in the present work, which is ∼81% of the total surveyed region.
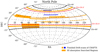 |
Fig. 1. CRAFTS sky coverage in equatorial coordinates up to January 7, 2022. We carried out our search in the orange regions, and the orange and blue regions were surveyed with CRAFTS. The zenith angle of 40° (maximum zenith angle for FAST) and 26.4° (zenith angle within which FAST has full gain) are shown as black circles and red circles, respectively. |
The raw CRAFTS data set has a time resolution of 0.2 s and a frequency resolution of 7.63 kHz (∼1.61 km s−1 at z = 0), covering a frequency range from 1000 MHz to 1500 MHz. The receiver response drops at the two ends of the frequency band, so only the data in the frequency range of 1.05–1.45 GHz are utilised. Additionally, in consideration of our scientific objectives and computing capacity, we further re-binned the data into a frequency resolution of 15.26 kHz and a time resolution of 12/cos δdec s (∼ the transit time in drift scan), where δdec is the declination of the pointing. The instantaneous sensitivity of each beam of the FAST system will be 2.15 mJy beam−1, assuming a bandwidth of Δν = 15.26 kHz and a 12 s integration time per beam (Hu et al. 2020). According to the calculation presented in Sect. 3.2, a velocity-integrated signal-to-noise ratio ((S/N)int) of ∼12 corresponds to the 90% completeness limit. Considering the expected final RMS noise of a 2.15 mJy beam−1 and assuming source coverage of 100%, a source with a flux density greater than 12 mJy is sufficient to detect H I absorption with a peak S/N ((S/N)peak) better than 5.5 (corresponding to a velocity-integrated signal-to-noise ratio ((S/N)int) of ∼12 for the Gaussian narrow line template with a full width at half maximum (FWHM) of 30 km s−1 and the frequency resolution of 15.26 kHz). According to the NRAO VLA Sky Survey (NVSS; Condon et al. 1998) Catalogue, whose completeness limit is about 2.5 mJy, 44827 radio sources with a flux density greater than 12 mJy are covered in our search region.
Figure 2 shows a sample of the raw time-averaged frequency spectra of the CRAFTS data for the 19 beams, each with one curve. RFI dominates the frequency range from 1.15 GHz to 1.3 GHz (green shaded region in Fig. 2). In the range of 1.05 GHz to 1.15 GHz (yellow shaded region in Fig. 2), there are also many smaller peaks due to chronically present RFI (Hu et al. 2021). Considering the data quality, the data in the frequency range of 1.3 GHz to 1.45 GHz (blue shaded region in Fig. 2), which is relatively clean, was used in the present study. We are also currently searching the H I absorption in the range of 1.05 GHz to 1.15 GHz, which will be presented in a future work. The peaks at 1420 MHz are from the Galactic neutral hydrogen.
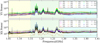 |
Fig. 2. Raw frequency spectra for the 19 feeds of the FAST L-band multi-beam receiver feeds. These spectra were obtained by taking the time average of the raw data throughout the whole time of observation. The XX and YY polarisations are shown in the top and bottom panels, respectively. |
As an example, in Fig. 3, we show the waterfall plot of the raw data of feed 1 from the observation on February 13, 2020, which scanned a stripe at the declination of +27d15m0.0s. The horizontal linear features at some frequency points are chronically RFI.
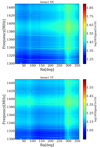 |
Fig. 3. Waterfall plot of the raw data for feed 1 of the FAST L-band multi-beam receiver feeds. The two polarisations are shown in the top and bottom sub-panels, respectively. |
2.2. Follow-up observation
When blind searching CRAFTS data (described in the next section), ten candidates, including three previously known H I absorption systems (UGC 00613, 3C 293 and 4C +27.14) were detected. Two known absorbers (UGC 00613 and 3C 293) and all new absorption systems are further confirmed by the CRAFTS data of several neighbouring beams with a high signal-to-noise ratio (see Sects. 3.4 and 4). In order to confirm the signal of the candidates and obtain a more significant H I absorption feature for 4C +27.14, we also carried out a nighttime follow-up observation with FAST from 18:55:00 UTC to 23:17:00 UTC on August 21, 2021.
To suppress the fluctuations in the bandpass and remove the sky signal, the follow-up observation used the ON-OFF tracking mode. The integration time for both source-on and source-off observations is 990 s. The cycle of 330 s source-on followed by 330 s source-off observation was repeated three times per target. The follow-up data set has a time resolution of 1 s and a frequency resolution of 7.63 kHz, covering the frequency from 1000 MHz to 1500 MHz. Under the condition that the frequency resolution is 7.63 kHz and the integration time is 990 s, the spectral RMS of 0.33 mJy can be obtained. The source 3C 48 was also observed for flux calibration.
3. Analysis
To begin, we extracted spectra at each time point from the data cubes. We processed the XX and YY spectra separately to search for H I absorption and combined them to create the final spectra if selected as candidates. For each XX and YY polarisation, we masked the RFI and obtained the band baseline by smoothing with a low-pass filter using the medfilt function (Van Rossum & Drake 1995; Virtanen et al. 2020). The median filter window size is set to 0.65 MHz, carefully selected to be smaller than the chronically present RFI and bandpass fluctuations yet larger than the typical size of H I absorption profiles.
We note that we only flag strong RFI (≥5σ) in our data. This is because some true H I absorbers may reside in the location of chronically present RFI. Furthermore, the spurious candidates produced by RFI will be excluded later in our blind search pipeline.
We then searched for the H I absorbers blindly by cross-correlating the flux spectrum with templates. This matched-filtering approach was developed for identifying emission signals in the Arecibo Legacy Fast ALFA survey (Saintonge 2007) and is more sensitive and faster than the usual peak-finding algorithms. Here, we provide a brief summary of the key steps. Spectra at each time point were extracted from the data cubes. After the removal of the baseline of the bandpass, the matched-filtering approach was applied to find the absorption profiles. The final candidates were selected using the transit information recorded by the 19 beams of FAST.
3.1. Searching algorithms
The matched filter is applied to the bandpass baseline-removed data. The signal g(x) is assumed to be represented as
where t is a template function over frequency channel x, α, μ and σ are the amplitude, the central position, and the width, respectively. The Gaussian function with negative amplitude is used as the template,
The best-fit template is found by minimising the χ2:
![$$ \begin{aligned} \chi ^{2} = \sum _{x=1}^{N_{\rm f}}[\alpha t(x - \mu ; \sigma ) - g(x)]^{2}, \end{aligned} $$](/articles/aa/full_html/2023/07/aa45549-22/aa45549-22-eq3.gif)
where Nf is the number of the spectral channel. Expanding the χ2 gives

where  and
and  are the variance of the signal and the template and c(x) is the normalised cross-correlation function:
![$$ \begin{aligned} c(x) = g(x) * t(x - \mu ; \sigma ) = \frac{1}{N_{\rm f}\sigma _{\rm g}\sigma _{\rm t}}\sum _{n}[g(n)t(n-x)]. \end{aligned} $$](/articles/aa/full_html/2023/07/aa45549-22/aa45549-22-eq7.gif)
Minimising the χ2 with respect to α gives

Replacing the α in χ2 using Eq. (6), we have
![$$ \begin{aligned} \chi ^{2} = N_{\rm f}\sigma _{\rm g}^{2}[1 - c(\mu )^{2}], \end{aligned} $$](/articles/aa/full_html/2023/07/aa45549-22/aa45549-22-eq9.gif)
where χ2 is minimised by maximising the value of the cross-correlation between the observational data and the template.
The template is parameterised by the peak amplitude αmax, the central channel position μmax, and the width σmax. To determine the best-fit parameters (α, μ, and σ) that minimise χ2 in realistic data processing, a series of steps are undertaken. Firstly, a set of templates covering a physical range (from 3.22 km s−1 to 325.22 km s−1 with an increment of 0.322 km s−1; the range is selected to ensure comprehensive coverage of all detected absorptions in terms of their width (Geréb et al. 2015)) is generated, with the width of each template specified by σ. Next, the convolution function c(x) is calculated for each template, and μmax is obtained for each convolution function by finding the spectral channel at which c(x) is maximised. Finally, the σmax is obtained by finding the largest value of c(μmax) from templates with different σ, and the peak amplitude αmax is obtained using Eq. (6).
The velocity-integrated signal-to-noise ratio of the absorption profile can be calculated following Saintonge (2007):
where Fint is the velocity-integrated flux, σrms is the RMS noise, W is the width of the signal in km s−1, and dv is the velocity resolution. For the rest of the content, all signal-to-noise ratios are velocity-integrated unless stated otherwise.
The H I absorption signal is searched in both the XX and YY polarisations of each beam. Only candidates with a total S/N > 5.5 that can be found at nearly the same frequency (Δν < 0.05MHz) with S/N > 3.5 in both XX and YY polarisations are selected.
3.2. Completeness
The absorption signal may be diluted either due to the presence of emission (Maina et al. 2022) at low redshift or poor baseline subtraction as a result of fluctuations of the bandpass. In order to quantify how this affects our H I absorption search, we estimated completeness by adding 1.67 × 10⁸ mock absorption lines to real spectra and calculating the fraction detected using our search method and selection threshold. The mock absorption signals are simulated using a Gaussian function template. The peak flux of mock absorption (Fpeak) is calculated using Eq. (8) and  , where σabs refers to the standard deviation of the Gaussian template for absorption signals.
In Fig. 4, we show the estimated completeness of mock absorption profiles under different conditions, including velocity widths with FWHMs of 15 km s−1, 30 km s−1, and 60 km s−1, as well as velocity-integrated S/Ns of 5.5 (the threshold we used for search in real data) and 12. For a fixed velocity-integrated sensitivity, narrower lines are more complete compared to broader lines, as the latter are more susceptible to being diluted by bandpass fluctuations. Recognising that the sensitivity is affected by the selection of velocity width, we have chosen a value of FWHM = 30 km s−1, which corresponds to the mean velocity width for all intervening 21 cm detected absorbers (Curran et al. 2016; Allison et al. 2016). Figure 5 shows the average completeness for mock absorption with velocity width of a FWHM = 30 km s−1 and velocity-integrated S/N ranging from 5.5 to 33.0 at a frequency of 1.30–1.42 GHz. Frequency-dependent structures exhibited in the completeness result from the chronically present RFI at specific frequencies (as shown in Fig. 3). As expected, our search is less complete for absorptions with lower S/Ns. As shown in Fig. 5, the velocity-integrated S/N cut of ∼12 corresponds to the estimate of the 90% completeness limit. As a consequence, the signal-to-noise ratio of 12 is adopted in the comoving absorption path calculation in Sect. 5.4.
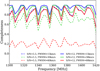 |
Fig. 4. Estimated completeness of mock absorption for various combinations of parameters, including velocity widths of 15 km s−1 (blue), 30 km s−1 (green), and 60 km s−1 (red), as well as velocity-integrated S/Ns of 5.5 (dashed lines) and 12 (solid lines). |
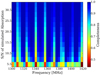 |
Fig. 5. Estimated completeness for mock absorption with velocity-integrated S/N ranges from 5.5 to 33.0 at frequencies of 1.30–1.42 GHz. |
3.3. Standing waves
However, even with the threshold shown in Sect. 3.1, tens of thousands of candidates have passed this screening. Nearly all of the spurious candidates originate from the fluctuations of the bandpass and chronically present RFI. The instability of the bandpass, which is mainly the result of standing waves, makes it difficult to remove the bandpass baseline accurately and find the true absorption signals. Most of these are excluded by using the multi-beam information in the drift scans, but the variation of the bandpass can be a significant source of error in such searches.
In the H I absorption feature search above, we ran our pipeline with the raw data before bandpass calibration. We also tried to carry out the analysis of the bandpass-calibrated data. The built-in noise diode of the FAST receiver is used as a real-time calibrator to estimate the bandpass variations. For the CRAFTS high-cadence calibration mode, the noise diode is injected for 81.92 μs in every 196.608 μs, with an amplitude of ∼1 K, which is a small fraction of the system temperature (∼20 K). Data with or without noise collected by the pulsar back end are averaged for every 0.2 s (equal to the sampling time of the spectral line back end), respectively, and their difference can be converted to spectrum back-end units, relying on the fact that the bandpass shape and system temperature are determined mostly by the front end, and the two back ends produce similar bandpasses. The noise spectra averaged over 30 minutes were used to calibrate the variations of the bandpass. We then carried out the same analysis using the calibrated data. However, the final result was not significantly affected. To ensure no absorption is left out as a result of the imperfect baseline fitting (due to the presence of standing waves), we also tried a smaller median filter window size (0.45 MHz) and lower S/N threshold (4σ). We find that it has little effect on the final candidate samples after multi-beam cross-correlation selection.
The results show that our calibration can only correct the variations over large frequency scales (Δν > 10 MHz), the fluctuations at small frequency scales (Δν ∼ 1 MHz) remain unimproved, and the small-scale fluctuations generate the spurious signals. The precision of the calibration procedure is therefore limited due to noise or fluctuations in the noise-diode signal. So, further selection methods are needed to screen for spurious candidates.
3.4. Candidate selection
Figures 2 and 3 demonstrate the chronically present RFI and features produced by standing waves, which presents a challenge in accurately modelling the bandpass baseline and results in numerous false candidates. It is not feasible to determine the authenticity of a candidate using only one scan. However, with the drift-scan strategy and multi-beam system data, it becomes possible to differentiate the genuine H I absorption signal from the spurious signal.
In CRAFTS, the feed array is rotated by 23.4 degrees to achieve super-Nyquist sampling. Perpendicular to the scanning direction, the spacing between the inner 17 beams is less than half the FWHM. During the drift scan, the true H I absorber will be scanned by multiple beams distributed along the scanning path, resulting in detection in different beams but the same sky location. In contrast, the spurious signals caused by RFI may appear in data from multiple beams, but they do not necessarily originate from the same location in the sky. On the other hand, the transit time for each beam in the drift scan is ∼12/cos θza seconds. In the drift-scan data with a time resolution of 12/cos θza seconds, the true signal can be detected in < 3 continuous time points (corresponding to 9 arcmin in size – a conservative estimate of the angular size of extragalactic radio source), while the spurious signals can be detected in ≥5 continuous or discontinuous time points.
We employed our selection pipeline to the preliminary H I absorption candidates that had passed the matched-filtering search. The pipeline involved several steps. In Step 1, we excluded candidates that could be detected at the same time point in more than five beams that were widely separated. In Step 2, candidates that could be detected in more than six continuous or discontinuous time points in the data from every single beam were excluded. In Step 3, we gave priority to candidates in the remaining catalogue if they could be detected in more than one beam distributed along the direction of the scanning. In Step 4, we visually examined the candidates that survived after Step 1 and Step 2 and compared these visual candidates with the automated candidates from Step 3.
We take the known H I absorption system UGC 00613 as an example of how our candidate selection pipeline works. Using the matched-filtering approach, the absorption profile of UGC 00613 can be detected in the data from Beam 10, Beam 4, and Beam 13, respectively. In Fig. 6, we show the raw spectra (left column) and baseline-removed spectra (right column) from Beam 10, Beam 4 and Beam 13. A high emission peak is beside the absorption profile, which arises from the chronically present RFI. Even though contaminated by the RFI, all detections have significant S/Ns (larger than 12). These three beams are horizontal along the scanning direction, as shown in Fig. 7. Moreover, no other distant beam has detected this feature. These show that the absorption profile we detected is a true signal, not one from RFI or bandpass variation.
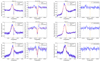 |
Fig. 6. Spectra extracted from different beams at the pointing position closest to UGC 00613. Left: Spectra of the (previously known) H I absorption system UGC 00613. The top, middle, and bottom sub-panels show the detection from Beam 10, Beam 4, and Beam 13, respectively. The left column shows the raw data, and the right column shows the baseline-removed data. The solid red lines in the left column indicate the baselines estimated using medfilt. The solid red lines in the right column depict the best template modelling the H I absorption profile. The vertical orange dashed lines show the central channel position of the template. The S/Ns of the absorption profiles are given as the titles of the sub-figures in the right column. Right: Same as the left sub-panels, but there is no precise detection for neighbouring Beam 3, Beam 11, and Beam 14. The vertical orange dashed lines refer to the frequency position of UGC 00613. |
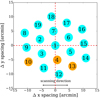 |
Fig. 7. Distribution of the beams from which the H I absorption system UGC 00613 was detected. The known H I absorption system UGC 00613 can be detected in the data of Beam 10, Beam 4, and Beam 13, which are labelled in orange. These three beams distribute in a horizontal line along the scanning direction. The 19 beams have been rotated by 23.4 degrees. |
In our data analysis, using criteria (i) and (ii) alone can exclude 73% and 89% of the spurious detections, respectively, and combining the spatial and time information together makes our method more effective. From the results, all the excluded candidates are produced by the RFI and standing waves. No true signals are diagnosed as spurious in either criterion (i) or (ii). Using the selection method described above, we excluded most spurious detections (∼140 000 cases) and three known and two new H I absorption systems; five unverified candidates survived.
3.5. HI absorption measurement
According to the radiative transfer theory, the observed signal (Tb(ν)) of an H I source that is partially covering a background continuum source can be described as follows (Morganti & Oosterloo 2018):

where cf is the covering factor that is the fraction of the background source covered by foreground gas clouds, as seen from the centre. τ(ν) and Ts are the optical depth and spin temperature of the H I source, respectively, and Tc is the brightness temperature of the background continuum source. In Eq. (9), the first term denotes the absorbed emission from the continuum source, the second term is the emission from the part of the continuum source not covered by the cloud, and the last term describes self-absorbed 21 cm line emission from the H I source.
The difference between the Tb(ν) and Tc is then

If Ts > cfTc, the spectral line will be seen in emission, while if Ts < cfTc, the absorption dominates. For most H I absorption observations, Ts ≪ cfTc, then ΔT(ν) = − cfTc(1 − e−τ(ν)). After converting the frequency (ν) to velocity (V), the optical depth can be expressed as

in the limit Ts ≪ cfTc, where Tc can be deduced from the line-free parts of the spectrum or the other database. In this work, we used the Tc from the NASA/IPAC Extragalactic Database1 (NED).
The optical depth τ is proportional to NH I/Ts, and the H I column density is given by
![$$ \begin{aligned} N_{\mathrm{H}i }[\mathrm {cm}^{-2} ] = 1.82 \times 10^{18} T_{\rm s}[\mathrm{K} ] \int \tau (V)\mathrm{d}V[\mathrm {km\,s}^{-1} ]. \end{aligned} $$](/articles/aa/full_html/2023/07/aa45549-22/aa45549-22-eq15.gif)
Throughout this paper, we assume that cf = 1 (Maccagni et al. 2017) for the calculation of τ and NH II.
4. Results
By utilising the matched filter and multi-beam candidate selection pipeline on the collected data, we identified a total of ten candidates, among which three have been previously detected: UGC 00613 (Zhang et al. 2021), 3C 293 (Baan & Haschick 1981; Beswick et al. 2004a), and 4C +27.14 (Stanimirović et al. 2014). The spectra of these ten candidates are shown in Fig. 8. All spectra have been corrected for the Doppler shift induced by the Earth’s revolution. The high peaks besides the absorption profile (Candidate 5, UGC 00613 and NVSS J231240–052547, for example) are the chronically present RFI. As shown in Fig. 8, the baseline fit in some cases is not good enough. Although the median filter window size is carefully determined, it cannot always provide a perfect estimation of the baseline, especially when factors such as RFI, standing waves (Candidate 4 in Fig. 8, for example), or broad absorption lines (3C 293 in Fig. 8, for example) exist. To improve the results, we also tested a smaller median filter window size of 0.45 MHz. However, this did not yield any new H I absorption detections beyond the five already identified. While spurious detections decreased, the S/N of the previously identified candidates was reduced. To eliminate the effects of fluctuations and RFI around H I absorption signals, in the future we will employ a finely tuned fitting technique using high-order polynomials and multi-component Gaussian functions on the spectra from follow-up observations.
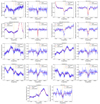 |
Fig. 8. CRAFTS spectra of the five H I absorber candidates, 4C +27.14 3C 293, NVSS J231240–052547, and NVSS J053118+315412. In each row, the odd- and even-numbered columns show the raw spectra and the baseline-removed spectra, respectively. The vertical lines indicate the frequencies of the absorbers. The solid red lines in the raw spectra show the baseline. The solid red lines in the baseline-removed spectra show the Gaussian fit absorption profile. Spectra of UGC 00613 are shown in Fig. 6. |
We carried out follow-up observations for these candidates in the ON-OFF tracking observation mode, with 990 s of integration on each. Besides the three previously known ones, two are confirmed to be bona fide absorbers (along the line of sight towards NVSS J231240–052547 and NVSS J053118+315412), while the other five candidates are either produced by features in the bandpass or the combined features from the H I emission and bandpass ripples (this will be discussed later). We fitted the profiles of the true H I absorptions with multi-component Gaussian functions and presented the basic physical information for each source. The absolute photometric flux is calibrated with 3C 48 and the FAST built-in noise diode.
4.1. Previously known absorbers
4.1.1. UGC 00613
The H I absorption feature of UGC 00613 was first reported in Zhang et al. (2021) with a flux density depth of SH I,peak = −64.28 ± 6.61 mJy, FWHM of 26.36 ± 1.74 km s−1, and ∫τdv= 21.24 ± 4.10 km s−1, from a one-component Gaussian fitting. UGC 00613 is a flat-spectrum extended radio source (Healey et al. 2007), which is probably located in an unrelaxed, merging system (Hardcastle et al. 2019). We blindly re-detected its H I absorption in Beam 10, Beam 4, and Beam 13 in the CRAFTS drift-scan data. As Fig. 6 shows, the absorption feature overlaps in the frequency band with an emission feature, which is a chronically present RFI. To remove the baseline and RFI, a Gaussian and second-order polynomial function was fitted to the absorption-line-free parts of the spectrum. We used the FAST built-in noise diode for flux calibration. The system temperature Tsys is estimated as
where Pnoise is the recorded noise power from the noise diode, Pobs is the CRAFTS recorded observational data, and Tnoise is the noise temperature. Tsys was converted to flux density using pre-measured antenna gain (Jiang et al. 2020): flux = Tsys/Gain.
The absorption spectra of UGC 00613 and its Gaussian fitting are presented in Fig. 9. Two components are found in the absorption feature, and some basic physical information is given in Tables 1 and 2. Our measurements of the H I absorption of UGC 00613 with a flux density depth of SH I,peak = −69.46 ± 5.56 mJy, FWHM of 31.74 ± 1.85 km s−1, and ∫τdv= 32.75 ± 4.39 km s−1. The measurements of Gaussian component 2 (Table 2) are consistent with the previous results reported in Zhang et al. (2021).
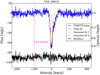 |
Fig. 9. H I absorption feature of UGC 00613. The solid blue line depicts the absorption spectrum, and the solid red line shows the fit with a double-component Gaussian model (components shown as orange and green dashed lines). The magenta dot-dashed vertical line marks the redshift of UGC 00613 as given in the NASA/IPAC Extragalactic Database. The fitting residual is shown as the solid black line at the bottom. The optical depth value for the H I absorption is shown on the right scale. |
Some basic physical parameters of radio sources UGC 00613, 3C 293, 4C +27.14, NVSS J231240–052547, and NVSS J053118+315412.
Some basic physical parameters of FAST observations of the H I absorption profiles for UGC 00613, 3C 293 and 4C +27.14.
4.1.2. 3C 293
The galaxy 3C 293 is a Fanaroff and Riley type II (FR II) (Fanaroff & Riley 1974) radio galaxy with a compact core of steep spectrum and multiple knots in the radio lobe (Evans et al. 1999; Beswick et al. 2004a). Both emission and absorption in CO have been detected (Evans et al. 1999), showing that 3C 293 is a disc galaxy with an optical jet or tidal tail towards its companion galaxy. The outflow of H I had also been detected and is probably driven by the radio jet (Mahony et al. 2013). The radio jets twist by 30°, probably as a result of strong interaction or a recent merger event. Besides, an extremely broad and multi-component H I absorption feature has been detected (Baan & Haschick 1981; Beswick et al. 2004a,b), indicating a rotating H I disc.
We detected the H I absorption in 3C 293 again in our blind search. Its signal can be detected in Beam 10, Beam 11, Beam 4, and Beam 13 with a high signal-to-noise ratio (S/N > 10). We used the built-in noise diode to calibrate the data and measure the basic physical parameters using the method described in Sect. 3.5. The absorption feature is fitted by a triple-component Gaussian function and is presented in Fig. 10, and the physical parameters are given in Tables 1 and 2.
As shown in Fig. 10, a broad H I absorption feature with multiple components is obtained. For the total signal, the H I absorption of 3C 293 is detected with a flux density depth of SH I,peak = −283.33 ± 17.24 mJy, FWHM = 61.54 ± 4.32 km s−1, τpeak = 0.062 ± 0.004, ∫τdv = 6.47 ± 0.41 km s−1, and NH I = 0.12Ts × 1020 cm−2 K−1, which are consistent with the previous measurement reported in Baan & Haschick (1981) that detected the H I absorption signal for the first time and gave τpeak = 0.085 and a column density of 0.18Ts × 1020 cm−2 K−1. The difference is a result of different adoption of flux density of 3C 293 at 1.4 GHz (S1.4GHz), Baan & Haschick (1981) used S1.4 GHz = 3.76 Jy, while we adopted the recent measurement S1.4 GHz = 4.69 Jy (Lin et al. 2018).
4.1.3. 4C +27.14
The galaxy 4C +27.14 is a Type II Seyfert galaxy and displays the properties of a radio-loud AGN (Parisi et al. 2014). A broad H I absorption profile has been observed in the direction of radio continuum source 4C +27.14 (Stanimirović et al. 2014) for the first time. The H I absorption lines are detected in the CRAFTS drift-scan data with a blind search and the follow-up observation using ON-OFF tracking mode. The absorption signal of 4C +27.14 is faint, only detected in Beam 11 in the CRAFTS data. The fluctuations in the bandpass are suppressed by subtracting the source-off data from the source-on data. The calibrator 3C 48 was also observed to calibrate the data. A second-order polynomial function was fitted to the absorption-line-free parts of the spectrum to remove the baseline of the bandpass.
The calibrated ON-OFF spectrum and its Gaussian fitting are presented in Fig. 11 (and Fig. 12 for the follow-up observation). Some physical parameters of the system are given in Table 2. Our measurement of the H I absorption profile of 4C +27.14 is consistent with Stanimirović et al. (2014). However, Eq. (11) is no longer a good assumption because Ts ≪ cfTc is not satisfied for 4C +27.14. Heiles & Troland (2003) developed a 17-point observing pattern with the Arecibo telescope and used the least-squares procedure to measure the optical depth and the expected emission profile, which is the profile of H I source that would be observed at the source position if the background continuum sources were absent. Sixteen off-source measurements and one on-source measurement were applied to each source. The off-source spectra were expressed in a Taylor series expansion of the expected profile and a small contribution from the source intensity attenuated by the optical depth. A least-squares fitting technique is then used to estimate the expected H I emission and the optical depth. Using this method, Stanimirović et al. (2014) derived the expected H I emission profile. The opacity spectrum was then obtained by subtracting the expected H I emission spectrum from the on-source spectrum.
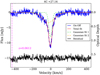 |
Fig. 11. Same as Fig. 9, but for the H I absorption feature of 4C +27.14 obtained by processing the follow-up ON-OFF tracking data. |
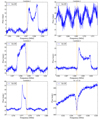 |
Fig. 12. Spectra for Candidates 1, 2, 3, 4, 5, and 4C +27.14 from the follow-up observation. The orange dashed lines show the central frequency position of the H I candidates found via CRAFTS searching (see Fig. 8). |
We re-scale our optical depth profile in Fig. 11 and Table 2 using the data presented in Stanimirović et al. (2014). our measurements of the H I absorption associated with 4C +27.14 give a flux density depth of SH I,peak = −11.11 ± 0.34 mJy, an FWHM of 54.58 ± 1.99 km s−1, and ∫τdv = 3.01 ± 0.09 km s−1.
4.2. New absorbers
Here we report two newly discovered absorbers. We name them by the bright radio sources located very close to the peak position of the absorption seen in our observation, NVSS J231240–052547 and NVSS J053118+315412. According to the NED and VLASS, these are the only radio sources found within 3 arcmin of these positions where H I absorptions are detected.
One may wonder if absorption is really produced along the line of sight towards the bright background radio source or if it is produced against the blank sky or some fainter, fused sources within the beam. We note that the flux decrements for the two absorbers are quite large. Given that there are bright sources at the position where absorbers are detected, it is much more likely to obtain such a large decrement against a single, bright radio background source since only an absorber of a small area on that line of sight is required, while it is far more difficult to achieve such absorption against fainter, possibly multiple background sources within the same beam, which would require a much larger area for the absorber. Combined with the fact that in CRAFTS drift-scan data there is a tight negative relation between the intensity of the absorption signal and the angular distance between the beam centre and the radio sources mentioned above, these two radio sources are very likely related to the newly discovered H I absorbers. Therefore, we proceeded under the assumption that these two absorbers are indeed related to that strong radio source, and this justifies our naming of the absorbers with the radio sources.
4.2.1. NVSS J231240-052547
The H I absorption towards NVSS J231240–052547 is reported here for the first time. NVSS J231240–052547 is a radio source detected in the NRAO VLA Sky Survey with flux S1.4 GHz = 181.9 mJy. We blindly detected H I absorption in Beam 10, Beam 4, and Beam 14 in the CRAFTS drift-scan data.
The absorption spectra towards NVSS J231240–052547 and its Gaussian fitting are shown in the upper panel of Fig. 13. Two components are found in the absorption feature, and some basic physical parameters are given in Tables 1 and 2. Under the assumption that Ts ≪ cfTc, the H I absorption towards NVSS J231240–052547 has a flux density depth of SH I,peak = −54.04 ± 6.02 mJy, a FWHM of 9.12 ± 1.01 km s−1, ∫τdv = 3.01 ± 0.36 km s−1, and NH I = 0.05Ts × 1020 cm−2 K−1.
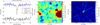 |
Fig. 13. Absorption spectrum and images towards NVSS J231240–052547. Left panel: Same as Fig. 9, but for the H I absorption feature towards NVSS J231240–052547. Middle panel: Image centred at NVSS J231240–052547 (or WISEA J231240.69–052548.8) using WISE data at 4.618 microns. Right panel: Radio image centred at NVSS J231240–052547 using VLASS data. The straight cross shows the position of the radio source. |
At this same position, a mid-infrared source (WISEA J231240.69–052548.8) has been detected by the Wide-field Infrared Survey Explorer (WISE, Cutri et al. 2013) and cross-identified as the radio source NVSS J231240–052547 in the NASA/IPAC Extragalactic Database. The left and right panels of Fig. 13 show the image centred at NVSS J231240–052547 (or WISEA J231240.69–052548.8), constructed using data at 4.618 microns (W2) from WISE and radio data at the S band from the Karl G. Jansky Very Large Array Sky Survey (VLASS; Lacy et al. 2020), respectively. The straight cross marks the position of NVSS J231240–052547. The WISE magnitudes for WISEA J231240.69–052548.8 are presented in Table 3. The W1–W2 colour of value 0.8 is often used as a simple mid-infrared colour criterion for AGN candidates (Stern et al. 2012). The W1–W2 colour of 0.827 indicates that it is an AGN candidate. Combining with the W2–W3 value of 3.752 mag, this source lies in the intersecting region of Seyferts and the Ultra-luminous Infrared Galaxies (ULIRGs) in the WISE colour–colour diagram (Wright et al. 2010). It is probably associated with the background radio source, though there is also a chance that it is located at a lower redshift, in which case the absorber could be associated with it.
WISE magnitudes for the WISE counterparts of two new absorbers, NVSS J231240–052547 and NVSS J053118+315412.
There is also an optical counterpart located at the same position. According to the information shown on the SDSS DR17 SkyServer website2, WISEA J231240.69–052548.8 is cross-identified as SDSS J231240.73–052541.1 in the optical band. SDSS J231240.73–052541.1 is a galaxy with a Petrosian radius of 7.36 arcsec and a photometric redshift of photo Z = 0.091 ± 0.0364. The magnitudes of SDSS J231240.73–052541.1 are u = 20.66 ± 0.20, g = 19.68 ± 0.03, r = 19.37 ± 0.03, i = 19.16 ± 0.05, and z = 19.09 ± 0.16. The absorption line towards NVSS J231240–052547 is located at z ∼ 0.063, which is within the error box of the photometric redshift of SDSS J231240.73-052541.1. It could be associated with the absorber, though spectroscopic observations are needed to give a definite answer. The optical image for SDSS J231240.73–052541.1 is extracted from the SDSS SkyServer website and is shown as the central galaxy in Fig. 14.
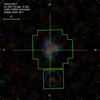 |
Fig. 14. Optical image for SDSS J231240.73–052541.1 (central galaxy). Blue circles mark the photometric objects, and the green squares depict the SDSS outlines. |
4.2.2. NVSS J053118+315412
The other new absorber is found in the line of sight towards NVSS J053118+315412. NVSS J053118+315412 has been detected at 1.4 GHz in NVSS with a flux of S1.4 GHz= 40.2 mJy. Its H I absorption is only detected in Beam 12 of the drift scan covering a declination of +31d57m00s. In order to verify this detection, it was observed in follow-up observation using ON-OFF tracking mode. The absorption spectra towards NVSS J053118+315412 and its Gaussian fitting are shown in the upper panel of Fig. 15. Six components are found in the absorption feature, and some basic parameters are given in Tables 1 and 2. Under the assumption that Ts ≪ cfTc, the measurements of the H I absorption towards NVSS J053118+315412 give a flux density depth of SH I,peak = −21.85 ± 0.77 mJy, an FWHM of 89.53 ± 2.85 km s−1, ∫τdv = 55.81 ± 2.23 km s−1 and NH I = 1.016Ts × 1020 cm−2 K−1.
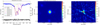 |
Fig. 15. Absorption spectrum and images towards NVSS J053118+315412. Left panel: Same as Fig. 9, but for the H I absorption feature of NVSS J053118+315412. Middle panel: Image centred at NVSS J053118+315412 (or WISEA J053118.83+315412.0) using WISE data at 4.618 microns. Right panel: Radio image centred at NVSS J231240–052547 using VLASS data. The straight cross shows the position of the radio source. |
The radio source has also been cross-identified to a source in the 2MASS Two Micron All Sky Survey (2MASS; Skrutskie et al. 2006) and one in the mid-infrared band by WISE by the NASA/IPAC Extragalactic Database. We show the image centred at NVSS J053118+315412 (or WISEA J053118.83+315412.0), constructed using infrared data at 4.618 microns (W2) from WISE and radio data at the S band from VLASS, in the middle and right panels of Fig. 15. The straight cross marks the position of NVSS J053118+315412. The WISE magnitudes for WISEA J053118.83+315412.0 are presented in Table 3. The W1–W2 colour is 1.630, which is higher than the value of 0.8 often used to select AGN candidates and implies that the mid-infrared emission comes mainly from the AGN. Combined with the W2–W3 value of 3.598 mag, NVSS J053118+315412 lies in the region of QSOs in the WISE colour–colour diagram. The 2MASS counterpart has J-band[1.235 μm], H-band[1.662 μm], and Ks-band[2.159 μm] magnitudes of 15.180 ± 0.043, 13.943 ± 0.044, and 13.219 ± 0.028.
We should note that although the velocity of the absorption is ∼1500 km s−1 higher than the velocity of WISEA J053118.83+315412.0 (or NVSS J053118+315412) as shown in the NED database (given by 2MASS Redshift Catalog, Bilicki et al. 2014), this velocity difference is smaller than the typical precision of 2MASS redshift estimates (∼12%), indicating the velocity of absorption is similar to that of NVSS J053118+315412.
The complicated structures of the absorption profile indicate the interaction between ISM and host AGNs. NVSS J053118+315412 exhibits a symmetric absorption spectrum (Gaussian components 2 and 3) relative to the systemic velocity of its host galaxy, suggesting that the H I gas traces a regular rotating structure. On the other hand, asymmetric absorption wings (Gaussian components 1 and 6) in the absorption profile are generally indicative of unsettled gas structures (Morganti & Oosterloo 2018), such as gas outflows that are propelled by the radio jet or tidal gas streams. Additionally, the redshifted absorption components (Gaussian components 4 and 5) could be evidence of accretion onto the SMBH (Araya et al. 2010; Maccagni et al. 2014). However, precise identification of infalling H I can only be achieved via high-resolution observations.
The position of NVSS J053118+315412 is outside the footprint of SDSS and other optical surveys. We are in the process of applying the telescope time to obtain the optical spectrum of the potential foreground and background sources, which will be investigated in future work.
4.3. Mid-infrared colour
The mid-infrared wavelength colour information from the WISE survey for the WISE counterparts of UGC 00613, 3C 293, 4C +27.14, NVSS J231240–052547 and NVSS J053118+315412 is shown in Table 3. Figure 16 presents the WISE colour-colour diagram from Wright et al. (2010), which is overlaid with the WISE counterparts of UGC 00613, 3C 293, 4C +27.14, NVSS J231240–052547, and NVSS J053118+315412, as well as three associated absorptions (PKS B1740-517, 3C 216, and M1540-1453) detected in previous blind surveys. In the WISE colour-colour diagram, extragalactic objects are grouped into different classes based on their mid-infrared colour signatures.
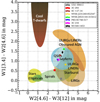 |
Fig. 16. WISE colour-colour diagram. The WISE colour for the WISE counterparts of UGC 00613, 3C 293, 4C +27.14, NVSS J231240–052547, NVSS J053118+315412, and three associated absorptions (PKS B1740-517, 3C 216, and M1540-1453) from blind surveys. |
From the H I absorption experiment towards radio AGNs classified as either low-excitation radio galaxies (LERGs) or high-excitation radio galaxies (HERGs), Chandola et al. (2020) confirmed that compact radio AGNs with WISE colour W2–W3 > 2 have higher detection rates compared to those with W2–W3 < 2 (Chandola & Saikia 2017). This is because the sources with W2–W3 > 2 are typical of gas-rich systems.
All four associated H I absorptions in our work and the three associated absorptions (PKS B1740-517 (Allison et al. 2015), 3C 216 (Grasha et al. 2020), and M1540-1453 (Gupta et al. 2021a) from previous blind surveys reside in the W2–W3 > 2 region, which supports the conclusion given by Chandola et al. (2020). More importantly, this associated absorption sample is obtained from a blind survey without any prior selection, indicating a universal relation between mid-infrared wavelength colour and detection rate for all radio sources. However, limited by the small number of unbiased H I absorption samples, it is necessary to use more H I absorbers from blind surveys to verify the relationship between mid-infrared colour and detectability for associated and intervening absorption.
4.4. Spurious detections
The other five candidates in the follow-up observations are also checked and found not to be true H I absorptions. The spectra of these sources, together with 4C +27.14, are shown in Fig. 12. The spectra are obtained by subtracting the source-off spectra from the source-on spectra and are calibrated with 3C 48. The orange dashed lines show the central frequency position of the absorber candidates (see Fig. 8 for a comparison). Compared with the spectra in CRAFTS (Fig. 8), we found that Candidates 1, 3, 4, and 5 arise from the combination of the fluctuations of the bandpass and the H I emission, while Candidate 2 comes from the fluctuations of the bandpass.
Although there are significant H I emission profiles in the source-on and source-off spectra from a follow-up observation, in the CRAFTS data they are mixed with the bandpass fluctuations induced by standing wave and chronically present RFI, making it difficult to distinguish the H I emission from the bandpass ripples. The standing wave ripples of the FAST have c/2f ∼ 1.1 MHz (where c denotes the speed of light and f ∼ 138 m is the FAST focal length), which is not far from the width of H I emission.
The spurious absorbers such as Candidates 1, 3, 4, and 5 are the results of the interplay between H I mission, RFI, and bandpass ripples. Such spurious absorption features can survive the multi-beam cross-correlation selection and cannot be easily excluded without further observation (Sect. 3.4).
5. Discussions
5.1. Correction for standing waves
There have been attempts to suppress the standing waves in radio data. Kern et al. (2019) described techniques for modelling and removing the reflections and standing waves in the Hydrogen Epoch of Reionisation Array (HERA) data (Kern et al. 2020). They showed that by combining reflection calibration and cross-coupling subtraction, standing waves could be suppressed down to the integrated noise floor. Li et al. (2021) recognised the standing waves in the Tianlai cylinder array and found the oscillating modulations in the frequency spectrum could be mitigated by removing the corresponding components in the Fourier space. Tests are also being carried out to correct the FAST standing waves. By fitting or extracting peaks in Fourier space caused by standing wave components with the period of ∼1.1 MHz, we can remove them and bring the level of fluctuation down to below 1 mJy or even lower (Yang et al., in prep.). A careful study of the small-scale fluctuations may help improve the calibration. However, the standing waves do vary with time, making it difficult to remove their effect completely.
On the other hand, only a one-pass drift scan has been carried out to date. In the near future, after the two-pass drift scan is finished, more time-varied RFI and other fluctuations can be excluded by comparing the data covering the same sky at different times.
5.2. Information from neighbouring beams
With so many spurious signals originating from the bandpass fluctuations and RFI being selected as preliminary candidates, it is of vital importance to find a valid and easy-to-use method to distinguish the intrinsic H I absorption from man-made signals. Fortunately, the 19 beams of the L-band receiver and the drift-scan survey strategy provide an effective solution (described in Sect. 3.4). The unique design of FAST makes it a powerful instrument for H I absorption searching. Considering that only approximately half of the frequency band from a small part of CRAFTS observable sky has been searched, we expect that a larger number of H I absorbers could be detected with the two-pass full survey.
In the blind search presented in this work, we ran our pipeline in the data from every single beam separately. For a drift scan at the meridian circle, 12/cos δ seconds of integration time is obtained in each beam-size pixel. Considering the drift-scan strategy and the positions of the 19 beams, there are overlaps among nearby beams. About 24/cos δ seconds of integration time can be obtained on each beam-size pixel (Hu et al. 2020) if we combine the data from the 19 beams. All of the data from the scans of the 19 beams can be utilised fully without losing information by using the linear map-making method (Tegmark 1997). It is a well-known technique for turning time-ordered raw data into estimators of the true sky. We developed an effective map-making pipeline for FAST to combine the data from the 19 beams and make the high signal-to-noise ratio map (Li et al. 2023). It will be used to process the CRAFTS data in the near future. Predictably, more and fainter H I absorption systems could be detected in the data processed from the full map.
5.3. Counterparts to the radio sources
Finding the counterpart of the radio source has long been an important yet challenging problem (Laing et al. 1983). In the above, we have argued that the absorption is very likely against the background radio source seen at the position of the beam if such a radio source is present within the beam. The absorber is then located precisely in the same line of sight. However, there is also the question of the nature of the optical and infrared counterpart, which is found by matching the radio source and the sources in the SDSS and WISE catalogue within a fiducial radius of several arcseconds. These optical and infrared sources could be associated with the background radio source or the absorber, or they could be simply coincidentally located near the line of sight.
We quantify the probability of finding coincident optical and infrared sources in the SDSS photometric catalogue, whose surface density is ∼4.2 per square arcminute, near the line of sight by simulation. We generated 10 000 random positions (Ra, Dec) in the surveyed sky region and computed the probability of having galaxies within a fiducial radius to these positions. Figure 17 shows the probability of matching as a function of radius. The probability of finding a galaxy is only 0.0036 at a matching radius of 1 arcsec, but it increases rapidly with the matching radius. The average separation between the radio sources of our five H I absorption systems and their SDSS counterparts is 0.734 arcsec, within which the probability of having an SDSS galaxy by chance is only 0.0021. For the two newly discovered absorbers towards NVSS J231240–052547 and NVSS J053118+315412, the separations are 2.351 and 0.387 arcsec, indicating a coincidence probability of 0.018 and 0.0002, respectively. This indicates that the detected SDSS matches are unlikely to be pure coincidence.
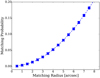 |
Fig. 17. Probability of finding SDSS galaxies within a certain matching radius centred around arbitrary directions. |
As we argued earlier, the radio background source and the absorber are most likely in the same line of sight. If the background sources are all located at high redshift (z ∼ 1), for which the optical counterpart would be too faint to be listed in the present SDSS catalogue, then these optical counterparts should be associated with the absorber. However, although most NVSS sources are located at high redshift (Nolta et al. 2004; Ho et al. 2008; Rahman et al. 2015), there is also a fraction of NVSS sources located at low redshift (z < 0.1) (Condon et al. 1998). A spectroscopic measurement of its redshift is needed to find the final answer.
5.4. Expected detection
5.4.1. Comoving absorption path
We estimate the total absorption path length (ΔX) and the NH II frequency distribution function (f(NH II, X)) for the CRAFTS data survey used here (1300–1450 MHz) following the method described in Allison et al. (2015, 2020), Allison (2021). The absorption path length is defined as the comoving interval of the survey that is sensitive to intervening absorbers. It can be obtained by summing over all data elements that are sensitive to a given minimum column density threshold:
where nt and nf are the total number of time points and frequency channels; δi, j = 1 when the data element (i, j) is sensitive to a given minimum column density, and otherwise δi, j = 0. Xi, j is the comoving absorption path length for a certain element; C(zi, j) denotes the completeness at a certain redshift (frequency); and wi, j refers to the redshift weighting function, which gives the probability of the radio source being located beyond zi, j:
where the redshift distribution of source is (de Zotti et al. 2010)

which is obtained by fitting the bright (S1.4 GHz ≥ 10 mJy) sources in the Combined EIS-NVSS Survey Of Radio Sources (CENSORS; Brookes et al. 2008). For intervening H I absorption, we adopted  , where
  and Δvasc = 3000 km s−1. For associated H I absorption, we excluded H I absorption not associated with H I gas in the host galaxy of the radio source by setting the upper limit of the integral of the denominator to
  .
.
The comoving absorption path element for the element i,j in the ΛCDM model is

where

The elements sensitive to a given column density are selected by calculating the column density sensitivity for each element. Assuming the spin temperature of Ts = 100 K, covering factor cf = 1, velocity FWHM ΔvFWHM = 30 km s−1, the column density sensitivity can be expressed as
![$$ \begin{aligned} N_{{Hi },s} = 5.82 \times 10^{21}\left[\frac{T_{\mathrm{s} }}{100\,\mathrm{K} }\right]\left[\frac{\Delta { v}_{\mathrm{FWHM}}}{30\,\mathrm {km\,s}^{-1} }\right]\tau _{\mathrm{peak}}\mathrm{cm} ^{-2}, \end{aligned} $$](/articles/aa/full_html/2023/07/aa45549-22/aa45549-22-eq25.gif)
where τpeak is the peak optical depth sensitivity estimated from the spectral noise. Adjusting Eq. (11), τpeak can be expressed as
![$$ \begin{aligned} \tau _{\mathrm{peak}} = -\mathrm{ln} \left(1 - ({S/N})_{\mathrm{peak}}\left[\frac{\sigma _{\mathrm{rms} }}{S_{c}c_{\mathrm{f} }} \right]\right), \end{aligned} $$](/articles/aa/full_html/2023/07/aa45549-22/aa45549-22-eq26.gif)
where (S/N)peak is the minimum peak signal-to-noise ratio required to reach high completeness. (S/N)peak is adopted as 5.5 in the comoving path calculation, corresponding to a (S/N)int of ∼12, for the Gaussian narrow line absorption template with a FWHM of 30 km s−1 and the frequency resolution of 15.26 kHz. From Fig. 5, the detection of mock absorption lines with a (S/N)int of 12 can hit the completeness of 0.9. In Eq. (20), σrms is the RMS noise and Sc is the background continuum flux density, which is estimated by calibrating the CRAFTS data using the FAST built-in noise diode and then removing the system temperature and Galactic foreground signal. The system temperature for each beam and for observations pointing towards different declinations is estimated using the models and parameters given by Jiang et al. (2020). The Galactic foreground signal is estimated from the global sky model (GSM; de Oliveira-Costa et al. 2008; Zheng et al. 2017; Huang et al. 2019). In order to make sure all RFIs are masked, the calibrated spectra are then flagged with a three-sigma criterion.
The completeness correction employed in comoving absorption path estimation is determined using mock absorption with S/N = 12 and FWHM = 30 km s−1. Nonetheless, at a fixed velocity-integrated sensitivity, absorptions with broader lines exhibit lower completeness. Figure 4 demonstrates that when the velocity-integrated sensitivity is low (e.g. S/N = 5.5), the completeness decreases rapidly with increasing velocity widths. On the other hand, for a fixed high-velocity-integrated sensitivity (e.g. S/N = 12), there is little disparity in completeness among absorptions with velocity widths of 15 km s−1, 30 km s−1, and 60 km s−1. Consequently, the selection of velocity width has a minor impact on our estimation of the comoving absorption path length.
We show the comoving absorption path length for our current data as a function of H I column density in Fig. 18. We present the results for Ts/cf = 100 and 1000 K, which are the typical spin temperature of the cold neutral medium (CNM) and warm neutral medium (WNM; Murray et al. 2018). The comoving absorption paths for Ts/cf = 100 K and 1000 K are labelled as solid and dashed lines in Fig. 18. Under the assumption of Ts/cf = 100 K, the total comoving absorption path length spanned by our data is ΔXinv = 1.05 × 10⁴ (Δzinv = 9.80 × 10³) and ΔXasc = 1.63 × 101 (Δzasc = 1.51 × 101). The absorption paths sensitive to all DLAs (NH I ⩾ 2 × 1020 cm−2) and super-DLAs (NH I ⩾ 2 × 1021 cm−2) are  (
( ) and
) and  (
( ) for intervening absorption and
  (
( ) and
) and  = 1.63×101 (
 ) for associated absorption, respectively.
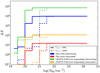 |
Fig. 18. Comoving absorption path length (ΔX) as a function of H I column density sensitivity. The results for the spin temperature to source covering fraction ratios of 100 and 1000 K are depicted as solid and dashed lines, respectively. The comoving absorption paths spanned by our data are labelled in blue (intervening absorption) and red (associated absorption). The predicted results from H I absorption searching in map-making data from the full coverage of the FAST observable sky are presented in green (intervening absorption) and orange (associated absorption). |
The maximum zenith angle for FAST is ∼40°, allowing the full cover of the FAST observable sky ∼23 800 deg2. The predicted results for H I absorption searching at z ≤ 0.09 in map-making data from the full coverage of the FAST observable sky are also presented in Fig. 18. Under the assumption of Ts/cf = 100 K, for full cover searching in map-making data, the total path sensitive to all DLAs and super-DLAs increases to  = 7.37 × 10⁴ and
  = 7.90 × 10⁴ for intervening absorption and to
  = 1.14 × 10² and
  = 1.23 × 10² for associated absorption, respectively.
5.4.2. NHI frequency distribution function
With the comoving absorption path estimated above, we computed the NH II frequency distribution function (Prochaska et al. 2005; Cooksey et al. 2010; Darling et al. 2011; Allison et al. 2020; Grasha et al. 2020), f(NH I,X), which is the number of absorbers per column density NH II bin per absorption path length sensitive to NH II; this is given by
where λabsorption is the number of H I absorption systems within each column density interval, ΔNH I = 0.5 dex, and ΔX is the comoving absorption path length searched with NH II. Making use of the five detected H I absorption systems, we calculated the measured f(NH I,X) for the analysed data in this work and present it in Fig. 19 with oblique crosses.
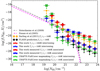 |
Fig. 19. Measured H I column density frequency distribution (f(NH I,X)) or the 95 per cent upper limits on f(NH I,X) for CRAFTS data and previous works. For data used in this work, f(NH I,X) for associated H I absorption (measured using the 4 associated absorption) and intervening H I absorption (the 95 per cent upper limits) are presented as oblique and straight crosses, the distributions for the spin temperature to source covering fraction ratio of 100 K and 1000 K are shown as blue and red crosses. The predicted f(NH I,X) for the H I absorption searching in map-making data from the full coverage of the FAST observable sky are presented as green oblique (associated) and straight (intervening) crosses. The predicted distribution from planned FLASH survey (Allison et al. 2020) (integration time 2 h, 36 antennas, sky area of δ = +10 deg and redshift coverage of z = 0.4 to 1.0), the ALFALFA absorption pilot survey (Darling et al. 2011) and model fits to H I emission-line observations with WSRT (Westerbork Synthesis Radio Telescope) at z = 0 (Zwaan et al. 2005) and DLA systems in SDSS-DR7 at z ∼ 3 (Noterdaeme et al. 2009) are also presented. |
We also compare our results with the upper limits on the f(NH I,X) for the other surveys. For the case of upper limits, NH II frequency distribution function is expressed as  , where λmax is the Poisson upper limit on the detection rate of absorbers with column density NH II in the interval ΔNH I. The 95% confidence upper limit on the Poisson rate is λmax = 3.0 when non-detection is assumed (Gehrels 1986).
Considering only one tentative intervening and four associated H I absorptions were detected in this work, we present measured f(NH I,X) for associated absorption and the 95% upper limits of f(NH I,X) for intervening absorption for Ts/cf = 100 and 1000 K in Fig. 19, together with the distribution from a planned FLASH survey (Allison et al. 2020) (integration time 2 h, 36 antennas, sky area of δ = +10 deg and redshift coverage from 0.4 to 1.0), the ALFALFA absorption pilot survey (Darling et al. 2011), and model fits to H I emission-line observations with the Westerbork Synthesis Radio Telescope (WSRT) at z = 0 (Zwaan et al. 2005) and DLA systems in SDSS-DR7 at z ∼ 3 (Noterdaeme et al. 2009). The predicted f(NH I,X) for the H I absorption searching in map-making data from the full coverage of the FAST observable sky is comparable with the FLASH f(NH I,X) upper-limit prediction in super-DLA (NH I ⩾ 2 × 1020 cm−2) regions.
We should note that, limited by the RFIs, computing resources and authorised follow-up observation time, only the 1300–1450 MHz band is used for absorption line searches and sensitivity calculations. With more comprehensive data processing methods and more frequency bands (1000–1300 MHz) and a larger sky searched in the near future, a much larger comoving absorption path and higher sensitivity to NH II frequency distribution function could be obtained with CRAFTS.
5.4.3. Comparing forecast with real blind searching
Utilising the number density distribution of H I clouds and radio sources over the sky, Yu et al. (2017) predicted that a one-month drift scan around the celestial equator by FAST could detect ∼200 absorption systems with S/Ns of 10σ in the redshift range of 0 < z < 0.39. Zhang et al. (2021) considered the NVSS bright source within the FAST observable sky and forecasted that ∼6000 extragalactic H I absorbers can be found with a detection rate of ∼5.5% (detection rate of 40% of the ALFALFA data). However, we only blindly found five absorption systems in the 643.8 h drift-scan survey. This difference between forecast and real data processing is attributed to the RFI and unstable bandpass (standing waves), which can contaminate the spectrum profile of true absorption systems and produce a spurious absorption line shape. It is expected that with standing waves corrected and the map-making method applied in the near future, more H I absorbers could be unveiled with the FAST extragalactic sky survey data.
6. Summary
In this paper, we present the early science results of a purely blind search for extragalactic H I 21 cm absorption lines in the CRAFTS drift-scan data from FAST. A nearly 643.8 h and 3155 deg2 survey (covers 44827 radio sources with a flux density greater than 12 mJy) from the Commensal Radio Astronomy FAST Survey (CRAFTS) was searched for H I absorbers. The total comoving absorption path length spanned by our data for intervening and associated absorption is ΔXinv = 1.05 × 10⁴ (Δzinv = 9.80 × 10³) and ΔXasc = 1.63 × 101 (Δzasc = 1.51 × 101, assuming Ts/cf = 100 K). The completeness correction, determined using mock absorption signals with FWHM = 30 km s−1, has been applied to the estimates of a comoving absorption path. All polarisation data of all 19 beams were processed. Due to the RFI, only the relatively clean data in the frequency range of 1.3 GHz to 1.45 GHz were investigated.
We used a matched-filtering approach to detect the H I absorption profiles at each time point of the drift scan. By cross-correlating information from different beams, we effectively eliminated spurious signals and identified three previously known H I absorbers (UGC 00613, 3C 293, and 4C +27.14) as well as two newly discovered ones (NVSS J231240-052547 and NVSS J053118+315412). We fitted the H I profiles with multi-component Gaussian functions and calculate the redshift, FWHM, flux density, optical depth, and H I column densities for each source. The newly discovered H I absorption feature in NVSS J053118+315412 displays associated absorption with both blueshifted and redshifted wings, as well as redshifted components. These characteristics suggest the presence of unsettled gas structures and possible accretion of gas onto the SMBH. Our results demonstrate the power of FAST in H I absorption blind searching. The forecast for the FAST H I absorption searching indicates a long comoving absorption path and high sensitivity to NH II frequency distribution function could be obtained with CRAFTS.
Discovery of intervening H I absorbers in a blind radio search may enable us to unravel the nature of the DLAs. As most DLAs were discovered in the observation of optically bright background quasars, it is often difficult to observe the absorber itself. In the present case, H I absorbers with column densities comparable to the DLAs are detected in the radio; it is thus possible that the absorber could also be observed optically. We found optical and infrared counterparts in data archives along the line of sight where the two absorptions were detected, and a follow-up observation with redshift measurement will determine whether NVSS J231240-052547 is associated with the H I absorbers and the nature of the counterparts.
Acknowledgments
We acknowledge the support of the National SKA Program of China, No. 2022SKA0110100. This work is supported by the National Key R&D Program 2017YFA0402603, the Ministry of Science and Technology (MoST) inter-government cooperation program China-South Africa Cooperation Flagship project 2018YFE0120800, the MoST grant 2016YFE0100300, the National Natural Science Foundation of China (NSFC) key project grant 11633004, the Chinese Academy of Sciences (CAS) Frontier Science Key Project QYZDJ-SSW-SLH017 and the CAS Interdisciplinary Innovation Team grant (JCTD-2019-05), the NSFC-ISF joint research program No. 11761141012, the CAS Strategic Priority Research Program XDA15020200, and the NSFC grant 11773034. Wenkai Hu and Guilaine Lagache are supported by the European Research Council (ERC) under the European Union’s Horizon 2020 research and innovation programme (project CONCERTO, grant agreement No. 788212) and from the Excellence Initiative of Aix-Marseille University-A*Midex, a French “Investissements d’Avenir” programme. Zheng Zheng is supported by NSFC grant Nos. 11988101, U1931110 and 12041302. Zheng Zheng is also supported by CAS Interdisciplinary Innovation Team (JCTD-2019-05). The authors thank Snežana Stanimirović, Elizabeth K. Mahony, Stephen J. Curran and James R. Allison for helpful discussion. Ue-Li Pen receives support from Ontario Research Fund–Research Excellence Program (ORF-RE), Natural Sciences and Engineering Research Council of Canada (NSERC) [funding reference number RGPIN-2019-067, CRD 523638-18, 555585-20], Canadian Institute for Advanced Research (CIFAR), the National Science Foundation of China (Grants No. 11929301), Thoth Technology Inc, Alexander von Humboldt Foundation, and the National Science and Technology Council (NSTC) (111-2123-M-001-008-, and 111-2811-M-001-040-). Computations were performed on the SOSCIP Consortium’s [Blue Gene/Q, Cloud Data Analytics, Agile and/or Large Memory System] computing platform(s). SOSCIP is funded by the Federal Economic Development Agency of Southern Ontario, the Province of Ontario, IBM Canada Ltd., Ontario Centres of Excellence, Mitacs and 15 Ontario academic member institutions. The radio data analyzed in this work can be accessed by sending a request to the FAST Data Centre or the corresponding authors of this paper.
References
- Allison, J. R. 2021, MNRAS, 503, 985 [NASA ADS] [CrossRef] [Google Scholar]
- Allison, J. R., Sadler, E. M., Moss, V. A., et al. 2015, MNRAS, 453, 1249 [NASA ADS] [CrossRef] [Google Scholar]
- Allison, J. R., Zwaan, M. A., Duchesne, S. W., & Curran, S. J. 2016, MNRAS, 462, 1341 [NASA ADS] [CrossRef] [Google Scholar]
- Allison, J. R., Sadler, E. M., Bellstedt, S., et al. 2020, MNRAS, 494, 3627 [Google Scholar]
- Allison, J. R., Sadler, E. M., Amaral, A. D., et al. 2022, PASA, 39, e010 [NASA ADS] [CrossRef] [Google Scholar]
- Araya, E. D., Rodríguez, C., Pihlström, Y., et al. 2010, AJ, 139, 17 [NASA ADS] [CrossRef] [Google Scholar]
- Baan, W. A., & Haschick, A. D. 1981, ApJ, 243, L143 [NASA ADS] [CrossRef] [Google Scholar]
- Beswick, R. J., Peck, A. B., Taylor, G. B., & Giovannini, G. 2004a, MNRAS, 352, 49 [CrossRef] [Google Scholar]
- Beswick, R. J., Peck, A. B., Taylor, G. B., Giovannini, G., & Pedlar, A. 2004b, in European VLBI Network on New Developments in VLBI Science and Technology, 147 [Google Scholar]
- Bilicki, M., Jarrett, T. H., Peacock, J. A., Cluver, M. E., & Steward, L. 2014, ApJS, 210, 9 [Google Scholar]
- Bordoloi, R., O’Meara, J. M., Sharon, K., et al. 2022, Nature, 606, 59 [NASA ADS] [CrossRef] [Google Scholar]
- Brookes, M. H., Best, P. N., Peacock, J. A., Röttgering, H. J. A., & Dunlop, J. S. 2008, MNRAS, 385, 1297 [NASA ADS] [CrossRef] [Google Scholar]
- Brown, R. L., & Roberts, M. S. 1973, ApJ, 184, L7 [NASA ADS] [CrossRef] [Google Scholar]
- Catinella, B., Haynes, M. P., Giovanelli, R., Gardner, J. P., & Connolly, A. J. 2008, ApJ, 685, L13 [Google Scholar]
- Chandola, Y., & Saikia, D. J. 2017, MNRAS, 465, 997 [NASA ADS] [CrossRef] [Google Scholar]
- Chandola, Y., Sirothia, S. K., & Saikia, D. J. 2011, MNRAS, 418, 1787 [NASA ADS] [CrossRef] [Google Scholar]
- Chandola, Y., Saikia, D. J., & Li, D. 2020, MNRAS, 494, 5161 [NASA ADS] [CrossRef] [Google Scholar]
- Chang, T.-C., Pen, U.-L., Peterson, J. B., & McDonald, P. 2008, Phys. Rev. Lett., 100, 091303 [NASA ADS] [CrossRef] [Google Scholar]
- Combes, F., Gupta, N., Muller, S., et al. 2021, A&A, 648, A116 [NASA ADS] [CrossRef] [EDP Sciences] [Google Scholar]
- Condon, J. J., Cotton, W. D., Greisen, E. W., et al. 1998, AJ, 115, 1693 [Google Scholar]
- Cooksey, K. L., Thom, C., Prochaska, J. X., & Chen, H.-W. 2010, ApJ, 708, 868 [NASA ADS] [CrossRef] [Google Scholar]
- Curran, S. J., Duchesne, S. W., Divoli, A., & Allison, J. R. 2016, MNRAS, 462, 4197 [NASA ADS] [CrossRef] [Google Scholar]
- Cutri, R. M., Wright, E. L., Conrow, T., et al. 2013, in Explanatory Supplement to the AllWISE Data Release Products [Google Scholar]
- Darling, J., Giovanelli, R., Haynes, M. P., Bolatto, A. D., & Bower, G. C. 2004, ApJ, 613, L101 [NASA ADS] [CrossRef] [Google Scholar]
- Darling, J., Macdonald, E. P., Haynes, M. P., & Giovanelli, R. 2011, ApJ, 742, 60 [NASA ADS] [CrossRef] [Google Scholar]
- de Oliveira-Costa, A., Tegmark, M., Gaensler, B. M., et al. 2008, MNRAS, 388, 247 [NASA ADS] [CrossRef] [Google Scholar]
- de Zotti, G., Massardi, M., Negrello, M., & Wall, J. 2010, A&A Rv., 18, 1 [NASA ADS] [Google Scholar]
- Dunning, A., Bowen, M., Castillo, S., et al. 2017, in 2017 XXXIInd General Assembly and ScientificSymposium of the International Union of Radio Science (URSI GASS), 1 [Google Scholar]
- Emonts, B. H. C., Morganti, R., Struve, C., et al. 2010, MNRAS, 406, 987 [NASA ADS] [Google Scholar]
- Evans, A. S., Sanders, D. B., Surace, J. A., & Mazzarella, J. M. 1999, ApJ, 511, 730 [NASA ADS] [CrossRef] [Google Scholar]
- Fanaroff, B. L., & Riley, J. M. 1974, MNRAS, 167, 31P [Google Scholar]
- Fernández, X., Gim, H. B., van Gorkom, J. H., et al. 2016, ApJ, 824, L1 [Google Scholar]
- Gehrels, N. 1986, ApJ, 303, 336 [Google Scholar]
- Geréb, K., Maccagni, F. M., Morganti, R., & Oosterloo, T. A. 2015, A&A, 575, A44 [CrossRef] [EDP Sciences] [Google Scholar]
- Giovanelli, R., Haynes, M. P., Kent, B. R., et al. 2005, AJ, 130, 2598 [Google Scholar]
- Giovanelli, R., Haynes, M. P., Kent, B. R., et al. 2007, AJ, 133, 2569 [NASA ADS] [CrossRef] [Google Scholar]
- Grasha, K., Darling, J., Leroy, A. K., & Bolatto, A. D. 2020, MNRAS, 498, 883 [NASA ADS] [CrossRef] [Google Scholar]
- Gupta, N., Srianand, R., Baan, W., et al. 2018, PoS, MeerKAT2016, 014 [Google Scholar]
- Gupta, N., Srianand, R., Shukla, G., et al. 2021a, ApJS, 255, 28 [NASA ADS] [CrossRef] [Google Scholar]
- Gupta, N., Jagannathan, P., Srianand, R., et al. 2021b, ApJ, 907, 11 [Google Scholar]
- Hardcastle, M. J., Croston, J. H., Shimwell, T. W., et al. 2019, MNRAS, 488, 3416 [Google Scholar]
- Healey, S. E., Romani, R. W., Taylor, G. B., et al. 2007, ApJS, 171, 61 [Google Scholar]
- Heiles, C., & Troland, T. H. 2003, ApJS, 145, 329 [Google Scholar]
- Helou, G., Madore, B. F., Schmitz, M., et al. 1991, in The NASA/IPAC extragalactic database, 171, 89 [Google Scholar]
- Ho, S., Hirata, C., Padmanabhan, N., Seljak, U., & Bahcall, N. 2008, Phys. Rev. D, 78, 043519 [NASA ADS] [CrossRef] [Google Scholar]
- Hu, W., Hoppmann, L., Staveley-Smith, L., et al. 2019, MNRAS, 489, 1619 [NASA ADS] [CrossRef] [Google Scholar]
- Hu, W., Wang, X., Wu, F., Wang, Y., Zhang, P., & Chen, X. 2020, MNRAS, 493, 5854 [NASA ADS] [CrossRef] [Google Scholar]
- Hu, W., Li, Y., Wang, Y., et al. 2021, MNRAS, 508, 2897 [NASA ADS] [CrossRef] [Google Scholar]
- Huang, Q., Wu, F., & Chen, X. 2019, Sci. China Phys. Mech. Astron., 62, 989511 [NASA ADS] [CrossRef] [Google Scholar]
- Jarvis, M. J., Bhatnagar, S., Bruggen, M., et al. 2014, ArXiv e-prints [arXiv:1401.4018] [Google Scholar]
- Jiang, P., Tang, N.-Y., Hou, L.-G., et al. 2020, Res. Astron. Astrophys., 20, 064 [CrossRef] [Google Scholar]
- Kern, N. S., Parsons, A. R., Dillon, J. S., et al. 2019, ApJ, 884, 105 [NASA ADS] [CrossRef] [Google Scholar]
- Kern, N. S., Parsons, A. R., Dillon, J. S., et al. 2020, ApJ, 888, 70 [NASA ADS] [CrossRef] [Google Scholar]
- Koribalski, B. S., Staveley-Smith, L., Westmeier, T., et al. 2020, Ap&SS, 365, 118 [Google Scholar]
- Lacy, M., Baum, S. A., Chandler, C. J., et al. 2020, PASP, 132, 035001 [Google Scholar]
- Laing, R. A., Riley, J. M., & Longair, M. S. 1983, MNRAS, 204, 151 [NASA ADS] [CrossRef] [Google Scholar]
- Li, D., Gajjar, V., Wang, P., et al. 2018, IEEE Microwave Mag., 19, 112 [NASA ADS] [CrossRef] [Google Scholar]
- Li, J.-X., Wu, F.-Q., Sun, S.-J., et al. 2021, Res. Astron. Astrophys., 21, 059 [CrossRef] [Google Scholar]
- Li, Y., Wang, Y., Deng, F., et al. 2023, ArXiv e-prints [arXiv:2305.06405] [Google Scholar]
- Lin, Y.-T., Huang, H.-J., & Chen, Y.-C. 2018, AJ, 155, 188 [NASA ADS] [CrossRef] [Google Scholar]
- Maccagni, F. M., Morganti, R., Oosterloo, T. A., & Mahony, E. K. 2014, A&A, 571, A67 [NASA ADS] [CrossRef] [EDP Sciences] [Google Scholar]
- Maccagni, F. M., Morganti, R., Oosterloo, T. A., Geréb, K., & Maddox, N. 2017, A&A, 604, A43 [NASA ADS] [CrossRef] [EDP Sciences] [Google Scholar]
- Mahony, E. K., Morganti, R., Emonts, B. H. C., Oosterloo, T. A., & Tadhunter, C. 2013, MNRAS, 435, L58 [NASA ADS] [CrossRef] [Google Scholar]
- Mahony, E. K., Allison, J. R., Sadler, E. M., et al. 2022, MNRAS, 509, 1690 [Google Scholar]
- Maina, E. K., Mohapatra, A., Józsa, G. I. G., et al. 2022, MNRAS, 516, 2050 [CrossRef] [Google Scholar]
- Meyer, M. J., Zwaan, M. A., Webster, R. L., et al. 2004, MNRAS, 350, 1195 [Google Scholar]
- Morganti, R., & Oosterloo, T. 2018, A&A Rv., 26, 4 [NASA ADS] [Google Scholar]
- Morganti, R., Oosterloo, T. A., Emonts, B. H. C., van der Hulst, J. M., & Tadhunter, C. N. 2003, ApJ, 593, L69 [NASA ADS] [CrossRef] [Google Scholar]
- Murray, C. E., Stanimirović, S., Goss, W. M., et al. 2018, ApJS, 238, 14 [NASA ADS] [CrossRef] [Google Scholar]
- Nan, R., Li, D., Jin, C., et al. 2011, Int. J. Mod. Phys. D, 20, 989 [Google Scholar]
- Nolta, M. R., Wright, E. L., Page, L., et al. 2004, ApJ, 608, 10 [NASA ADS] [CrossRef] [Google Scholar]
- Noterdaeme, P., Petitjean, P., Ledoux, C., & Srianand, R. 2009, A&A, 505, 1087 [NASA ADS] [CrossRef] [EDP Sciences] [Google Scholar]
- Parisi, P., Masetti, N., Rojas, A. F., et al. 2014, A&A, 561, A67 [NASA ADS] [CrossRef] [EDP Sciences] [Google Scholar]
- Prochaska, J. X., Herbert-Fort, S., & Wolfe, A. M. 2005, ApJ, 635, 123 [NASA ADS] [CrossRef] [Google Scholar]
- Rahman, M., Ménard, B., Scranton, R., Schmidt, S. J., & Morrison, C. B. 2015, MNRAS, 447, 3500 [CrossRef] [Google Scholar]
- Sadler, E. M., Moss, V. A., Allison, J. R., et al. 2020, MNRAS, 499, 4293 [NASA ADS] [CrossRef] [Google Scholar]
- Saintonge, A. 2007, AJ, 133, 2087 [NASA ADS] [CrossRef] [Google Scholar]
- Schulz, R., Morganti, R., Nyland, K., et al. 2021, A&A, 647, A63 [NASA ADS] [CrossRef] [EDP Sciences] [Google Scholar]
- Skrutskie, M. F., Cutri, M., Weinberg, M. D., et al. 2006, AJ, 131, 1163 [NASA ADS] [CrossRef] [Google Scholar]
- Smith, S. L., Dunning, A., Smart, K. W., et al. 2017, in 2017 IEEE International Symposium on Antennas and Propagation USNC/URSI National Radio Science Meeting, 2137 [CrossRef] [Google Scholar]
- Stanimirović, S., Murray, C. E., Lee, M.-Y., Heiles, C., & Miller, J. 2014, ApJ, 793, 132 [CrossRef] [Google Scholar]
- Stern, D., Assef, R. J., Benford, D. J., et al. 2012, ApJ, 753, 30 [Google Scholar]
- Struve, C., & Conway, J. E. 2010, A&A, 513, A10 [NASA ADS] [CrossRef] [EDP Sciences] [Google Scholar]
- Su, R., Sadler, E. M., Allison, J. R., et al. 2022, MNRAS, 516, 2947 [CrossRef] [Google Scholar]
- Taylor, G. B. 1996, ApJ, 470, 394 [NASA ADS] [CrossRef] [Google Scholar]
- Tegmark, M. 1997, ApJ, 480, L87 [NASA ADS] [CrossRef] [Google Scholar]
- Van Rossum, G., & Drake, F. L., Jr. 1995, Python Reference Manual (Amsterdam: Centrum voor Wiskunde en Informatica) [Google Scholar]
- Verheijen, M., van Gorkom, J. H., Szomoru, A., et al. 2007, ApJ, 668, L9 [Google Scholar]
- Virtanen, P., Gommers, R., Oliphant, T. E., et al. 2020, Nat. Methods, 17, 261 [Google Scholar]
- Vreeswijk, P. M., Ellison, S. L., Ledoux, C., et al. 2004, A&A, 419, 927 [NASA ADS] [CrossRef] [EDP Sciences] [Google Scholar]
- Wolfe, A. M., Gawiser, E., & Prochaska, J. X. 2005, ARA&A, 43, 861 [NASA ADS] [CrossRef] [Google Scholar]
- Wright, E. L., Eisenhardt, P. R. M., Mainzer, A. K., et al. 2010, AJ, 140, 1868 [Google Scholar]
- Yu, H.-R., Pen, U.-L., Zhang, T.-J., Li, D., & Chen, X. 2017, Res. Astron. Astrophys., 17, 049 [CrossRef] [Google Scholar]
- Zhang, B., Zhu, M., Wu, Z.-Z., et al. 2021, MNRAS, 503, 5385 [NASA ADS] [CrossRef] [Google Scholar]
- Zheng, H., Tegmark, M., Dillon, J. S., et al. 2017, MNRAS, 464, 3486 [NASA ADS] [CrossRef] [Google Scholar]
- Zheng, Z., Li, D., Sadler, E. M., Allison, J. R., & Tang, N. 2020, MNRAS, 499, 3085 [NASA ADS] [CrossRef] [Google Scholar]
- Zwaan, M. A., van Dokkum, P. G., & Verheijen, M. A. W. 2001, Science, 293, 1800 [NASA ADS] [CrossRef] [Google Scholar]
- Zwaan, M. A., Meyer, M. J., Staveley-Smith, L., et al. 2004, MNRAS, 350, 1210 [NASA ADS] [CrossRef] [Google Scholar]
- Zwaan, M. A., van der Hulst, J. M., Briggs, F. H., Verheijen, M. A. W., & Ryan-Weber, E. V. 2005, MNRAS, 364, 1467 [NASA ADS] [CrossRef] [Google Scholar]
All Tables
Some basic physical parameters of radio sources UGC 00613, 3C 293, 4C +27.14, NVSS J231240–052547, and NVSS J053118+315412.
Some basic physical parameters of FAST observations of the H I absorption profiles for UGC 00613, 3C 293 and 4C +27.14.
WISE magnitudes for the WISE counterparts of two new absorbers, NVSS J231240–052547 and NVSS J053118+315412.
All Figures
|
Fig. 1. CRAFTS sky coverage in equatorial coordinates up to January 7, 2022. We carried out our search in the orange regions, and the orange and blue regions were surveyed with CRAFTS. The zenith angle of 40° (maximum zenith angle for FAST) and 26.4° (zenith angle within which FAST has full gain) are shown as black circles and red circles, respectively. |
| In the text | |
|
Fig. 2. Raw frequency spectra for the 19 feeds of the FAST L-band multi-beam receiver feeds. These spectra were obtained by taking the time average of the raw data throughout the whole time of observation. The XX and YY polarisations are shown in the top and bottom panels, respectively. |
| In the text | |
|
Fig. 3. Waterfall plot of the raw data for feed 1 of the FAST L-band multi-beam receiver feeds. The two polarisations are shown in the top and bottom sub-panels, respectively. |
| In the text | |
|
Fig. 4. Estimated completeness of mock absorption for various combinations of parameters, including velocity widths of 15 km s−1 (blue), 30 km s−1 (green), and 60 km s−1 (red), as well as velocity-integrated S/Ns of 5.5 (dashed lines) and 12 (solid lines). |
| In the text | |
|
Fig. 5. Estimated completeness for mock absorption with velocity-integrated S/N ranges from 5.5 to 33.0 at frequencies of 1.30–1.42 GHz. |
| In the text | |
|
Fig. 6. Spectra extracted from different beams at the pointing position closest to UGC 00613. Left: Spectra of the (previously known) H I absorption system UGC 00613. The top, middle, and bottom sub-panels show the detection from Beam 10, Beam 4, and Beam 13, respectively. The left column shows the raw data, and the right column shows the baseline-removed data. The solid red lines in the left column indicate the baselines estimated using medfilt. The solid red lines in the right column depict the best template modelling the H I absorption profile. The vertical orange dashed lines show the central channel position of the template. The S/Ns of the absorption profiles are given as the titles of the sub-figures in the right column. Right: Same as the left sub-panels, but there is no precise detection for neighbouring Beam 3, Beam 11, and Beam 14. The vertical orange dashed lines refer to the frequency position of UGC 00613. |
| In the text | |
|
Fig. 7. Distribution of the beams from which the H I absorption system UGC 00613 was detected. The known H I absorption system UGC 00613 can be detected in the data of Beam 10, Beam 4, and Beam 13, which are labelled in orange. These three beams distribute in a horizontal line along the scanning direction. The 19 beams have been rotated by 23.4 degrees. |
| In the text | |
|
Fig. 8. CRAFTS spectra of the five H I absorber candidates, 4C +27.14 3C 293, NVSS J231240–052547, and NVSS J053118+315412. In each row, the odd- and even-numbered columns show the raw spectra and the baseline-removed spectra, respectively. The vertical lines indicate the frequencies of the absorbers. The solid red lines in the raw spectra show the baseline. The solid red lines in the baseline-removed spectra show the Gaussian fit absorption profile. Spectra of UGC 00613 are shown in Fig. 6. |
| In the text | |
|
Fig. 9. H I absorption feature of UGC 00613. The solid blue line depicts the absorption spectrum, and the solid red line shows the fit with a double-component Gaussian model (components shown as orange and green dashed lines). The magenta dot-dashed vertical line marks the redshift of UGC 00613 as given in the NASA/IPAC Extragalactic Database. The fitting residual is shown as the solid black line at the bottom. The optical depth value for the H I absorption is shown on the right scale. |
| In the text | |
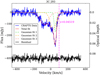 |
Fig. 10. Same as Fig. 9, but for the H I absorption feature of 3C 293. |
| In the text | |
|
Fig. 11. Same as Fig. 9, but for the H I absorption feature of 4C +27.14 obtained by processing the follow-up ON-OFF tracking data. |
| In the text | |
|
Fig. 12. Spectra for Candidates 1, 2, 3, 4, 5, and 4C +27.14 from the follow-up observation. The orange dashed lines show the central frequency position of the H I candidates found via CRAFTS searching (see Fig. 8). |
| In the text | |
|
Fig. 13. Absorption spectrum and images towards NVSS J231240–052547. Left panel: Same as Fig. 9, but for the H I absorption feature towards NVSS J231240–052547. Middle panel: Image centred at NVSS J231240–052547 (or WISEA J231240.69–052548.8) using WISE data at 4.618 microns. Right panel: Radio image centred at NVSS J231240–052547 using VLASS data. The straight cross shows the position of the radio source. |
| In the text | |
|
Fig. 14. Optical image for SDSS J231240.73–052541.1 (central galaxy). Blue circles mark the photometric objects, and the green squares depict the SDSS outlines. |
| In the text | |
|
Fig. 15. Absorption spectrum and images towards NVSS J053118+315412. Left panel: Same as Fig. 9, but for the H I absorption feature of NVSS J053118+315412. Middle panel: Image centred at NVSS J053118+315412 (or WISEA J053118.83+315412.0) using WISE data at 4.618 microns. Right panel: Radio image centred at NVSS J231240–052547 using VLASS data. The straight cross shows the position of the radio source. |
| In the text | |
|
Fig. 16. WISE colour-colour diagram. The WISE colour for the WISE counterparts of UGC 00613, 3C 293, 4C +27.14, NVSS J231240–052547, NVSS J053118+315412, and three associated absorptions (PKS B1740-517, 3C 216, and M1540-1453) from blind surveys. |
| In the text | |
|
Fig. 17. Probability of finding SDSS galaxies within a certain matching radius centred around arbitrary directions. |
| In the text | |
|
Fig. 18. Comoving absorption path length (ΔX) as a function of H I column density sensitivity. The results for the spin temperature to source covering fraction ratios of 100 and 1000 K are depicted as solid and dashed lines, respectively. The comoving absorption paths spanned by our data are labelled in blue (intervening absorption) and red (associated absorption). The predicted results from H I absorption searching in map-making data from the full coverage of the FAST observable sky are presented in green (intervening absorption) and orange (associated absorption). |
| In the text | |
|
Fig. 19. Measured H I column density frequency distribution (f(NH I,X)) or the 95 per cent upper limits on f(NH I,X) for CRAFTS data and previous works. For data used in this work, f(NH I,X) for associated H I absorption (measured using the 4 associated absorption) and intervening H I absorption (the 95 per cent upper limits) are presented as oblique and straight crosses, the distributions for the spin temperature to source covering fraction ratio of 100 K and 1000 K are shown as blue and red crosses. The predicted f(NH I,X) for the H I absorption searching in map-making data from the full coverage of the FAST observable sky are presented as green oblique (associated) and straight (intervening) crosses. The predicted distribution from planned FLASH survey (Allison et al. 2020) (integration time 2 h, 36 antennas, sky area of δ = +10 deg and redshift coverage of z = 0.4 to 1.0), the ALFALFA absorption pilot survey (Darling et al. 2011) and model fits to H I emission-line observations with WSRT (Westerbork Synthesis Radio Telescope) at z = 0 (Zwaan et al. 2005) and DLA systems in SDSS-DR7 at z ∼ 3 (Noterdaeme et al. 2009) are also presented. |
| In the text | |
Current usage metrics show cumulative count of Article Views (full-text article views including HTML views, PDF and ePub downloads, according to the available data) and Abstracts Views on Vision4Press platform.
Data correspond to usage on the plateform after 2015. The current usage metrics is available 48-96 hours after online publication and is updated daily on week days.
Initial download of the metrics may take a while.