Fig. 6.
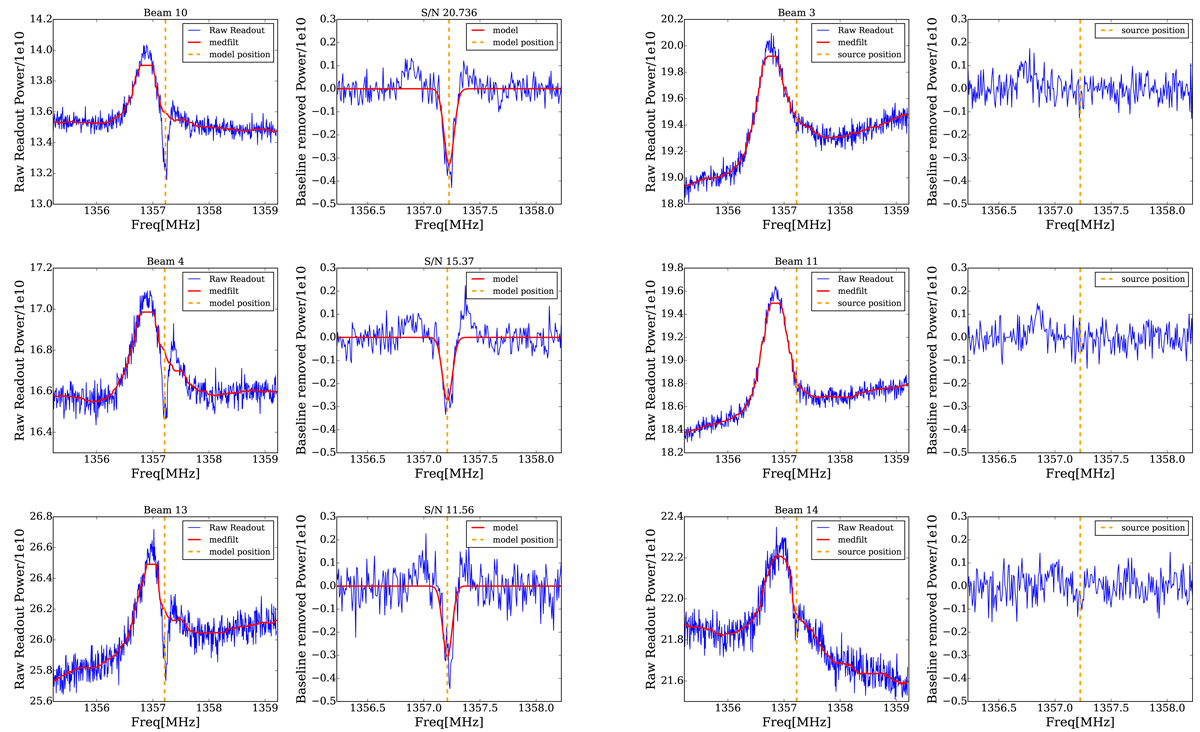
Download original image
Spectra extracted from different beams at the pointing position closest to UGC 00613. Left: Spectra of the (previously known) H I absorption system UGC 00613. The top, middle, and bottom sub-panels show the detection from Beam 10, Beam 4, and Beam 13, respectively. The left column shows the raw data, and the right column shows the baseline-removed data. The solid red lines in the left column indicate the baselines estimated using medfilt. The solid red lines in the right column depict the best template modelling the H I absorption profile. The vertical orange dashed lines show the central channel position of the template. The S/Ns of the absorption profiles are given as the titles of the sub-figures in the right column. Right: Same as the left sub-panels, but there is no precise detection for neighbouring Beam 3, Beam 11, and Beam 14. The vertical orange dashed lines refer to the frequency position of UGC 00613.
Current usage metrics show cumulative count of Article Views (full-text article views including HTML views, PDF and ePub downloads, according to the available data) and Abstracts Views on Vision4Press platform.
Data correspond to usage on the plateform after 2015. The current usage metrics is available 48-96 hours after online publication and is updated daily on week days.
Initial download of the metrics may take a while.