Open Access
Fig. 12.
Download original image
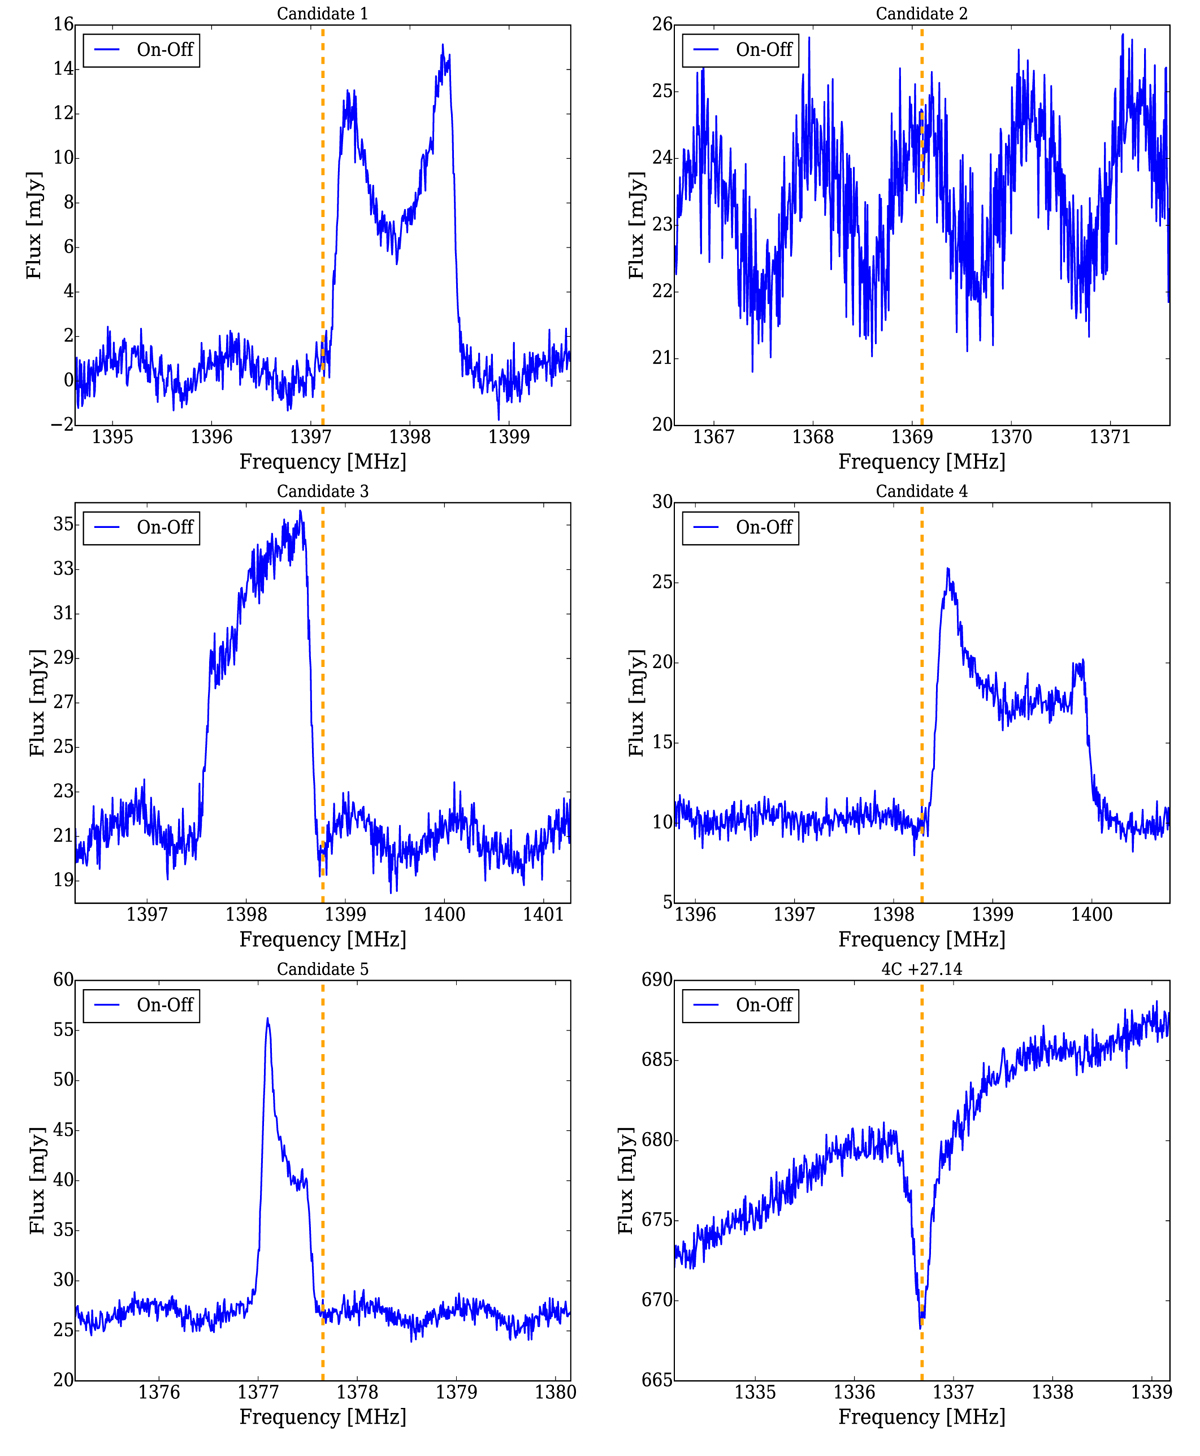
Spectra for Candidates 1, 2, 3, 4, 5, and 4C +27.14 from the follow-up observation. The orange dashed lines show the central frequency position of the H I candidates found via CRAFTS searching (see Fig. 8).
Current usage metrics show cumulative count of Article Views (full-text article views including HTML views, PDF and ePub downloads, according to the available data) and Abstracts Views on Vision4Press platform.
Data correspond to usage on the plateform after 2015. The current usage metrics is available 48-96 hours after online publication and is updated daily on week days.
Initial download of the metrics may take a while.