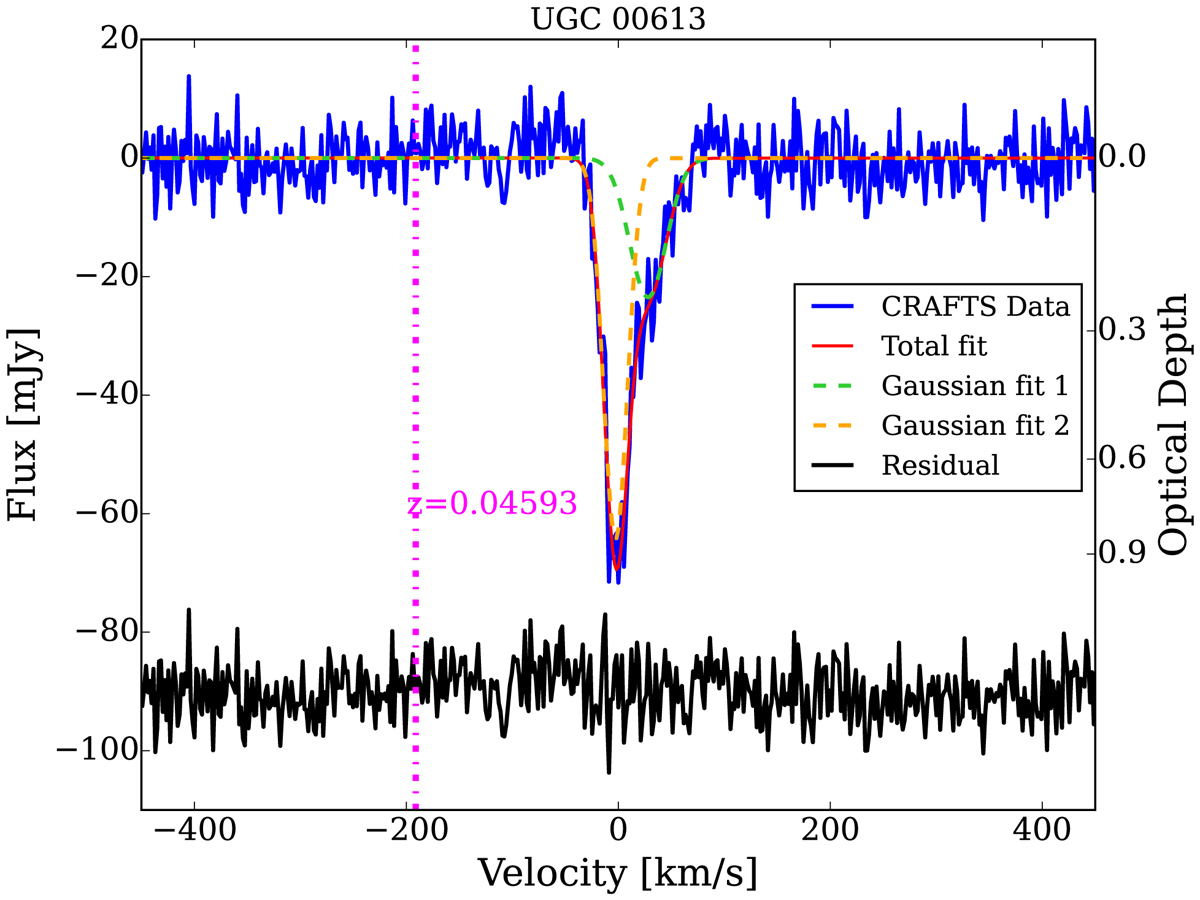
Fig. 9.
Download original image
H I absorption feature of UGC 00613. The solid blue line depicts the absorption spectrum, and the solid red line shows the fit with a double-component Gaussian model (components shown as orange and green dashed lines). The magenta dot-dashed vertical line marks the redshift of UGC 00613 as given in the NASA/IPAC Extragalactic Database. The fitting residual is shown as the solid black line at the bottom. The optical depth value for the H I absorption is shown on the right scale.
Current usage metrics show cumulative count of Article Views (full-text article views including HTML views, PDF and ePub downloads, according to the available data) and Abstracts Views on Vision4Press platform.
Data correspond to usage on the plateform after 2015. The current usage metrics is available 48-96 hours after online publication and is updated daily on week days.
Initial download of the metrics may take a while.