Fig. 19.
Download original image
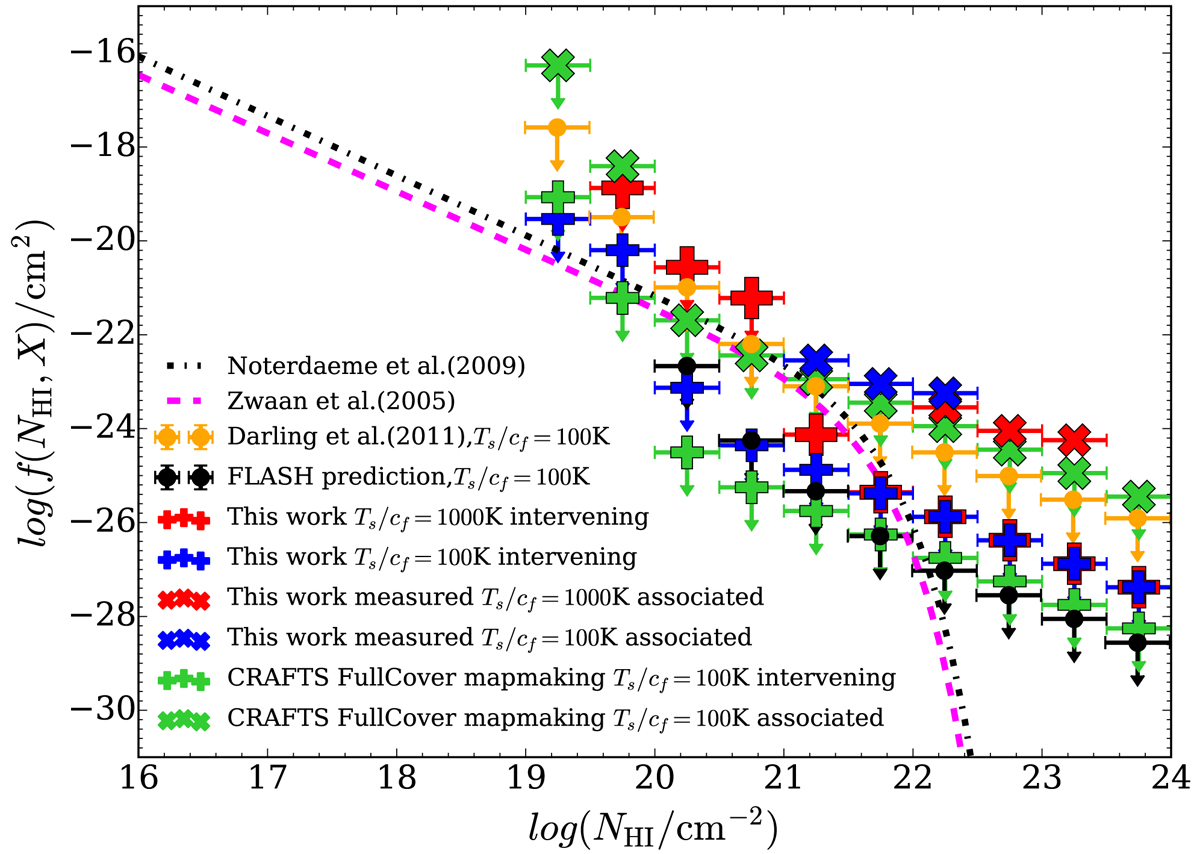
Measured H I column density frequency distribution (f(NH I,X)) or the 95 per cent upper limits on f(NH I,X) for CRAFTS data and previous works. For data used in this work, f(NH I,X) for associated H I absorption (measured using the 4 associated absorption) and intervening H I absorption (the 95 per cent upper limits) are presented as oblique and straight crosses, the distributions for the spin temperature to source covering fraction ratio of 100 K and 1000 K are shown as blue and red crosses. The predicted f(NH I,X) for the H I absorption searching in map-making data from the full coverage of the FAST observable sky are presented as green oblique (associated) and straight (intervening) crosses. The predicted distribution from planned FLASH survey (Allison et al. 2020) (integration time 2 h, 36 antennas, sky area of δ = +10 deg and redshift coverage of z = 0.4 to 1.0), the ALFALFA absorption pilot survey (Darling et al. 2011) and model fits to H I emission-line observations with WSRT (Westerbork Synthesis Radio Telescope) at z = 0 (Zwaan et al. 2005) and DLA systems in SDSS-DR7 at z ∼ 3 (Noterdaeme et al. 2009) are also presented.
Current usage metrics show cumulative count of Article Views (full-text article views including HTML views, PDF and ePub downloads, according to the available data) and Abstracts Views on Vision4Press platform.
Data correspond to usage on the plateform after 2015. The current usage metrics is available 48-96 hours after online publication and is updated daily on week days.
Initial download of the metrics may take a while.