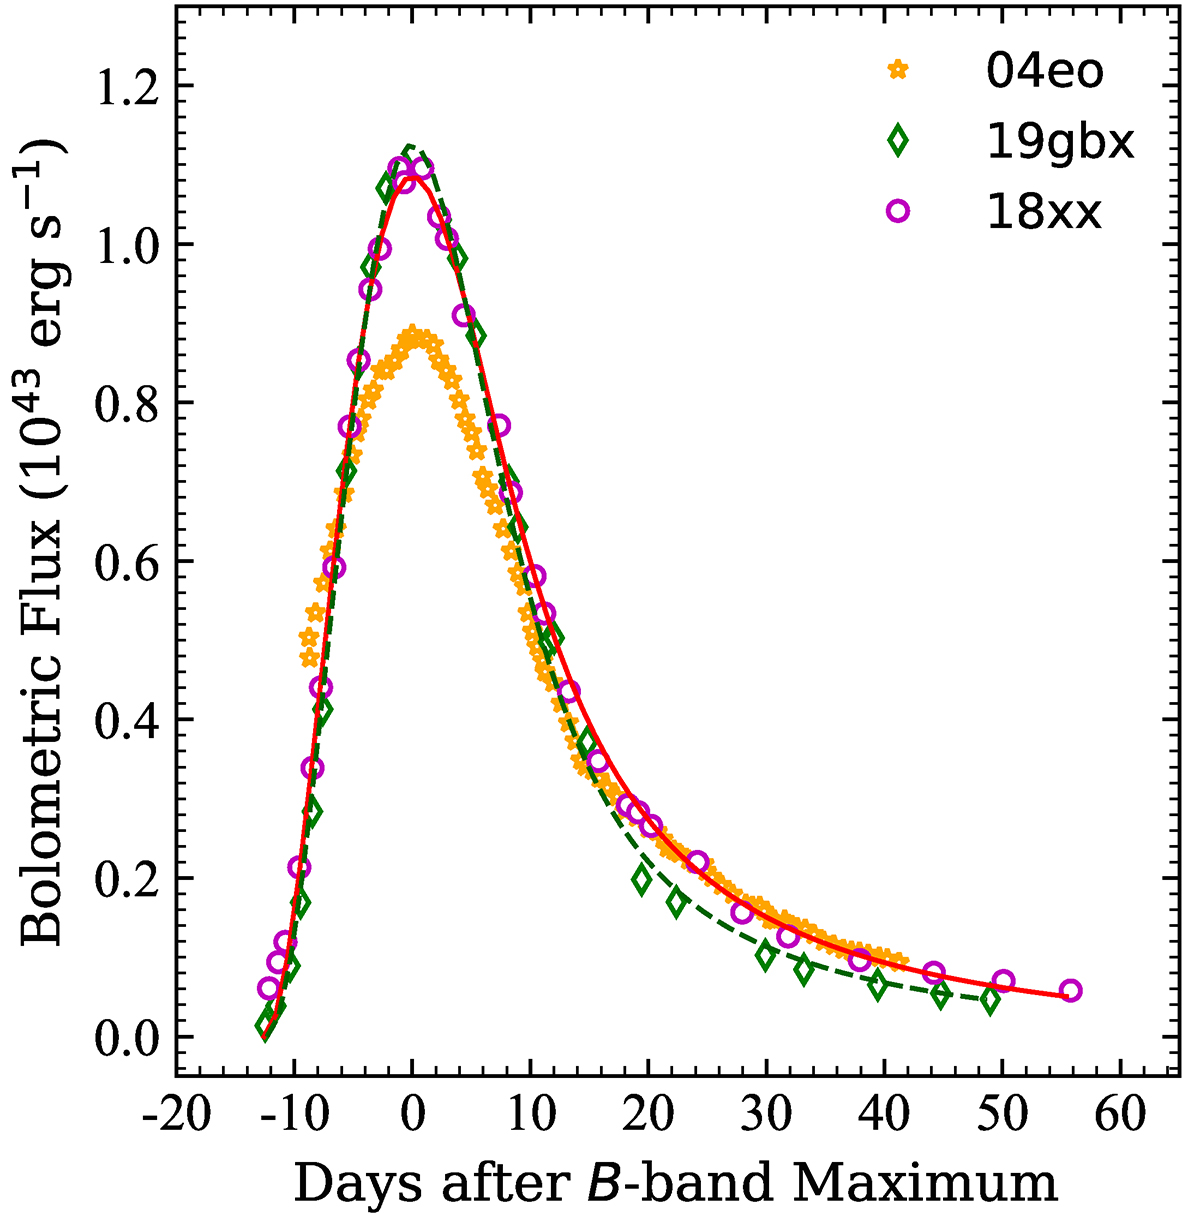
Fig. 7.

Download original image
Quasi-bolometric (UV and optical) light curves for SN 2018xx (magenta circles) and SN 2019gbx (green rhombuses) compared with that of SN 2004eo (orange stars) (Pastorello et al. 2007; Li et al. 2022). The solid red curve and dashed dark green curve represent the Arnett (1982) radiation diffusion model of SN 2018xx and SN 2019gbx, respectively.
Current usage metrics show cumulative count of Article Views (full-text article views including HTML views, PDF and ePub downloads, according to the available data) and Abstracts Views on Vision4Press platform.
Data correspond to usage on the plateform after 2015. The current usage metrics is available 48-96 hours after online publication and is updated daily on week days.
Initial download of the metrics may take a while.


