Open Access
Fig. 6.
Download original image
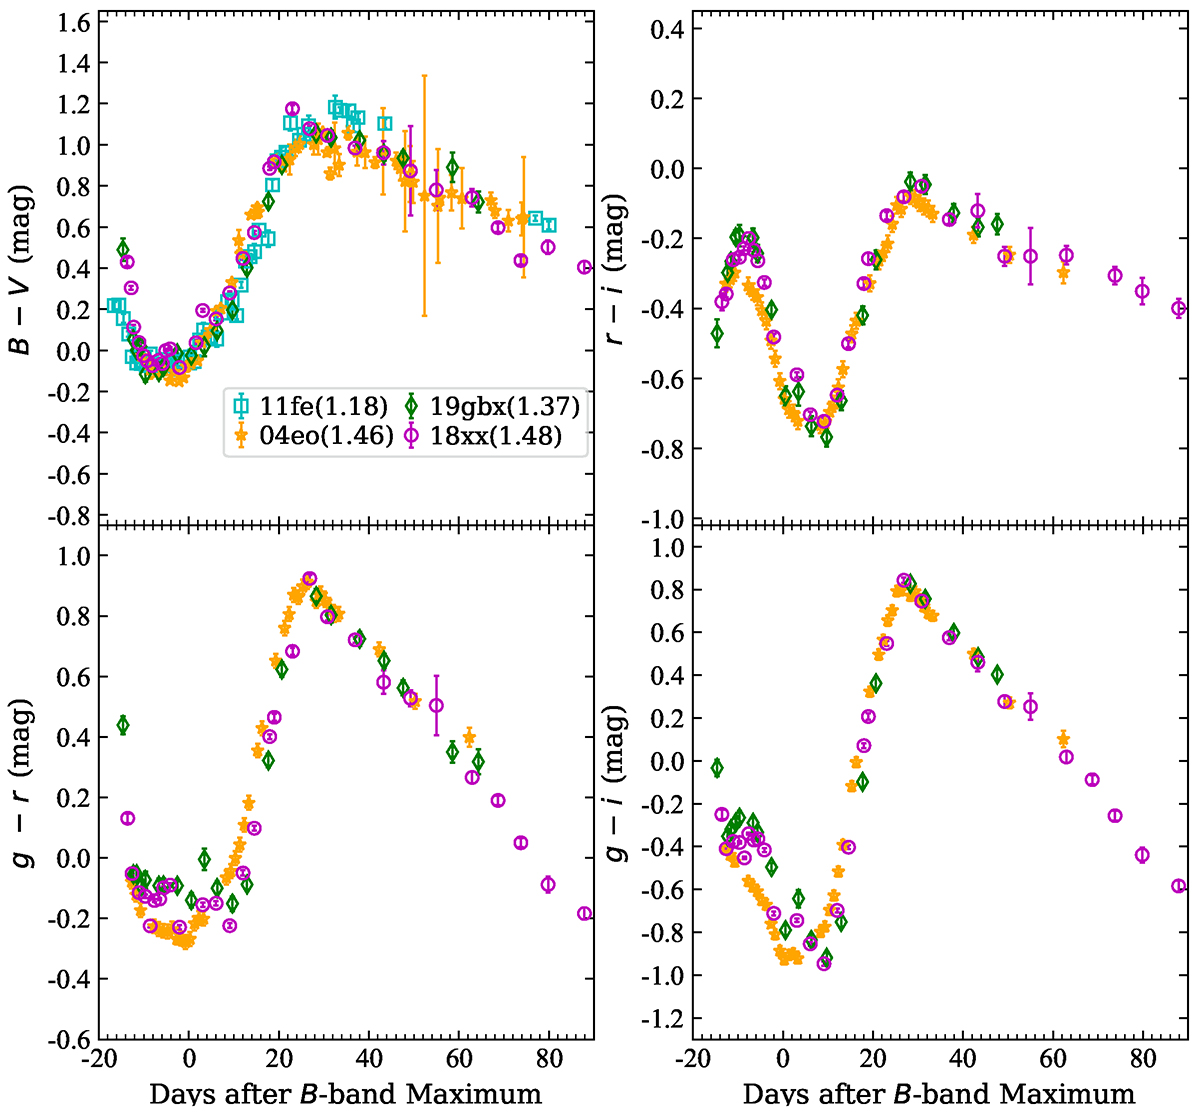
SN 2018xx and SN 2019gbx B − V, r − i, g − r, and g − i color curves compared with those of SN 2004eo (all panels) and SN 2011fe (upper-left panel). All color curves have been corrected for reddening in the Milky Way and the host galaxies using SNooPy2 (Burns et al. 2011, 2014).
Current usage metrics show cumulative count of Article Views (full-text article views including HTML views, PDF and ePub downloads, according to the available data) and Abstracts Views on Vision4Press platform.
Data correspond to usage on the plateform after 2015. The current usage metrics is available 48-96 hours after online publication and is updated daily on week days.
Initial download of the metrics may take a while.