Open Access
Fig. 4.
Download original image
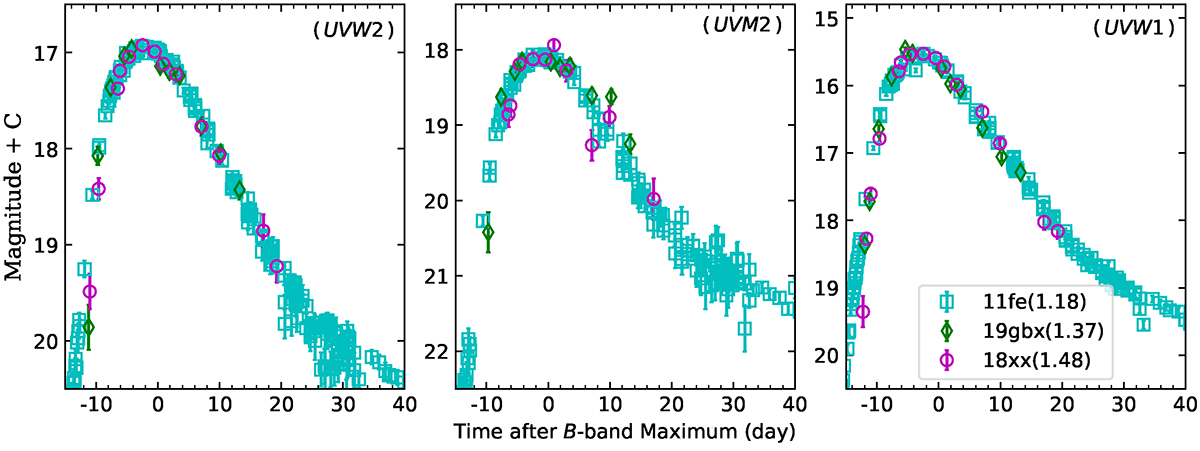
UV light curves of SN 2018xx and SN 2019gbx compared with the well-observed normal SN 2011fe. The rest frame light curves of SN 2019gbx and SN 2011fe have been shifted vertically to match the peak magnitudes of SN 2018xx.
Current usage metrics show cumulative count of Article Views (full-text article views including HTML views, PDF and ePub downloads, according to the available data) and Abstracts Views on Vision4Press platform.
Data correspond to usage on the plateform after 2015. The current usage metrics is available 48-96 hours after online publication and is updated daily on week days.
Initial download of the metrics may take a while.