Open Access
Fig. 2.
Download original image
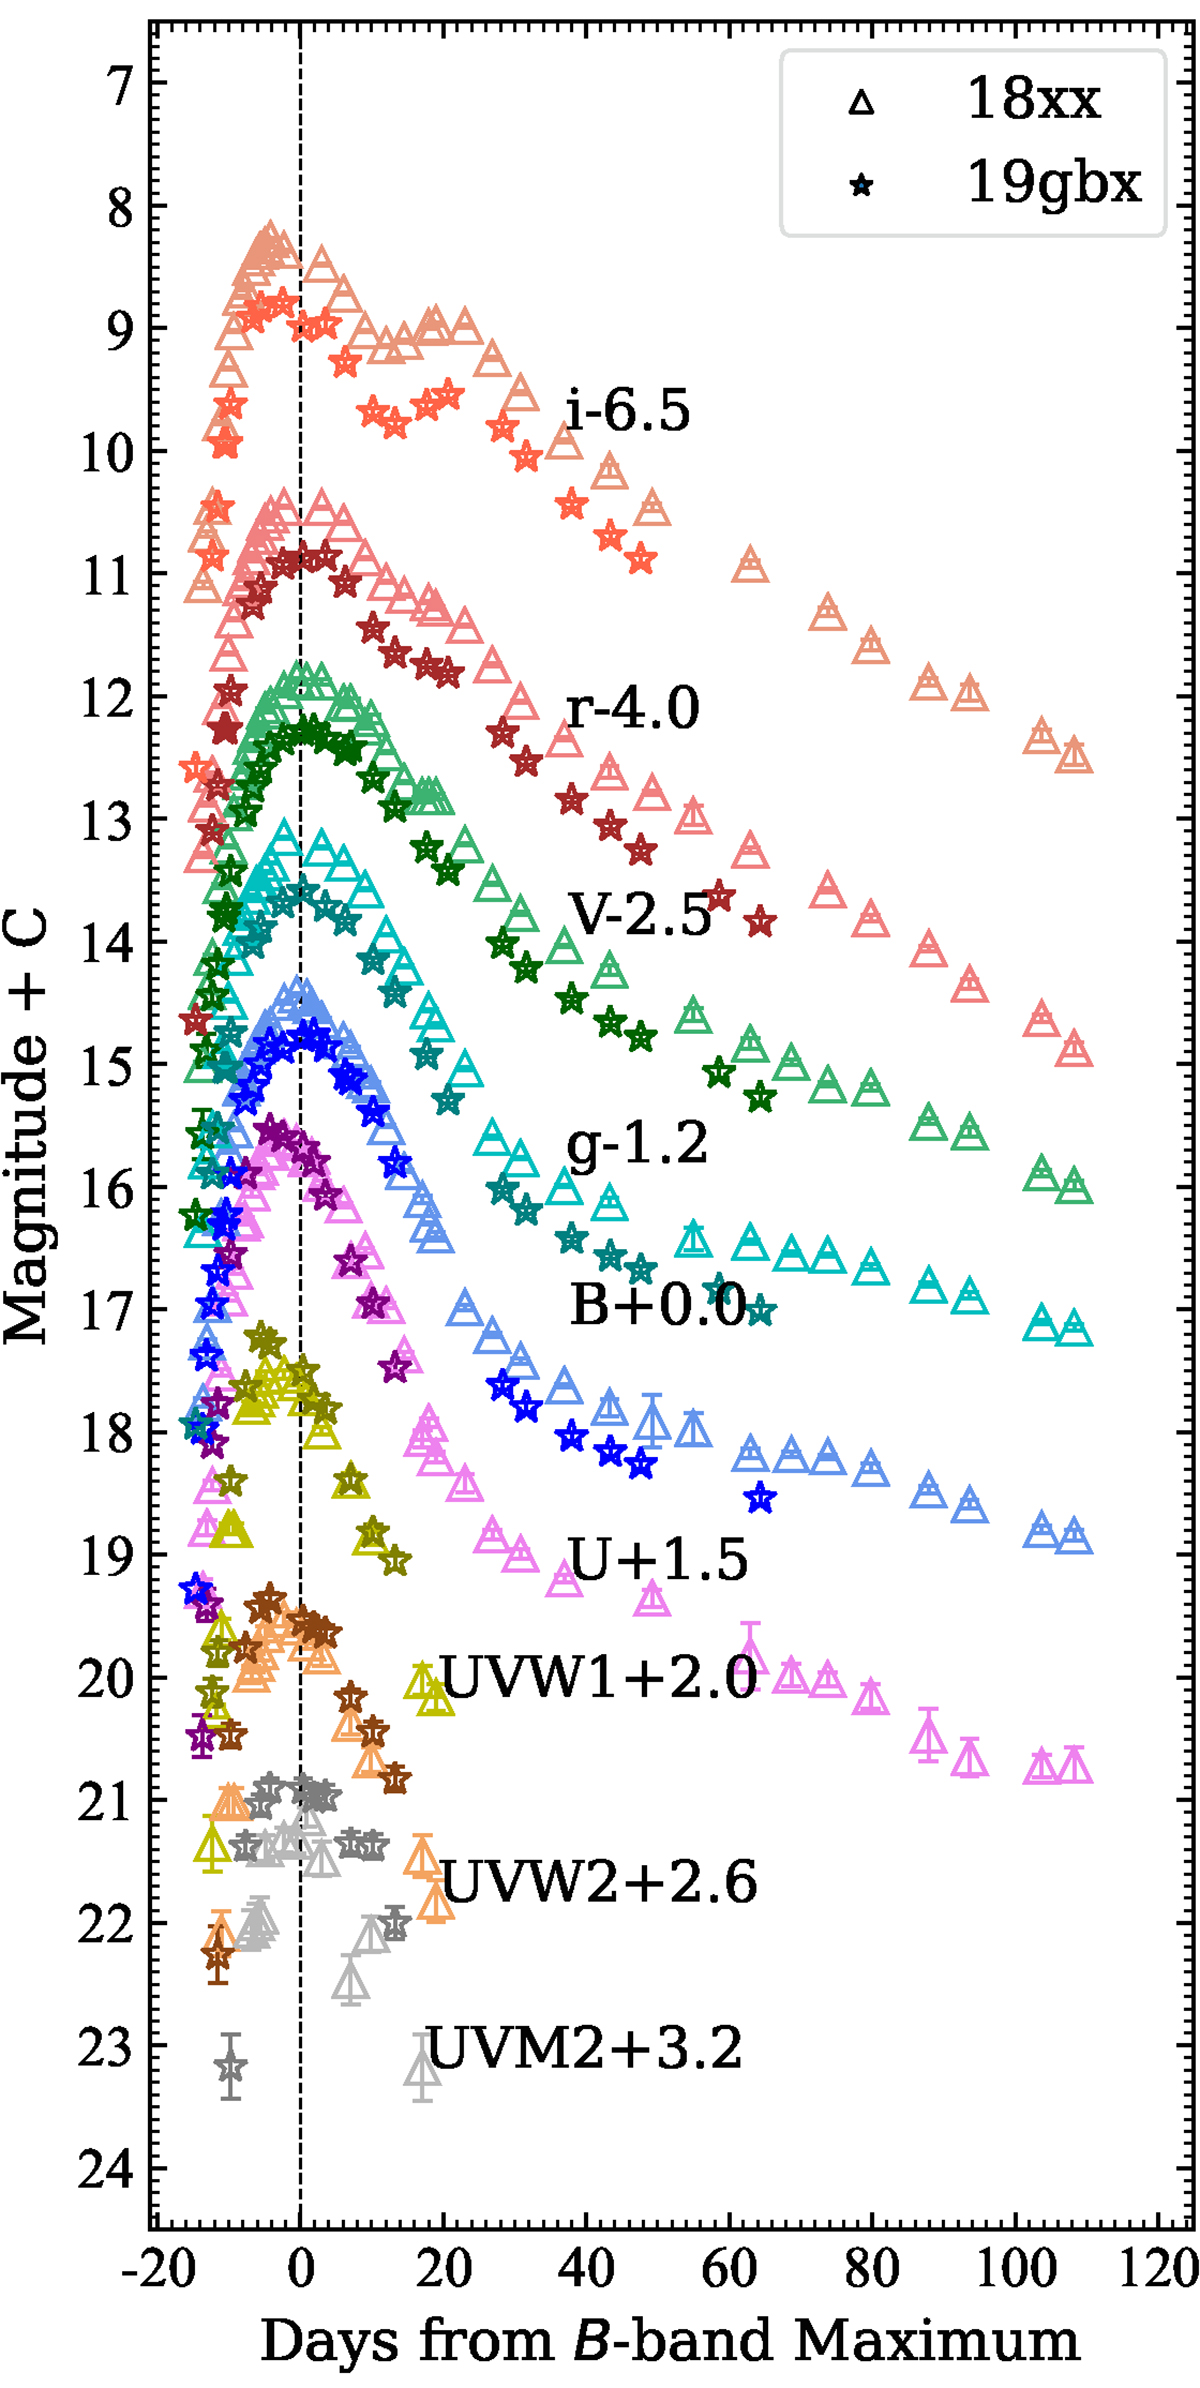
Optical and UV light curves of SN 2018xx (triangles) and 2019gbx (stars). The vertical dashed line indicates the time of the B-band maximum of the two SNe Ia. The phase was measured relative to the maximum brightness. The light curves have been shifted vertically for clarity.
Current usage metrics show cumulative count of Article Views (full-text article views including HTML views, PDF and ePub downloads, according to the available data) and Abstracts Views on Vision4Press platform.
Data correspond to usage on the plateform after 2015. The current usage metrics is available 48-96 hours after online publication and is updated daily on week days.
Initial download of the metrics may take a while.