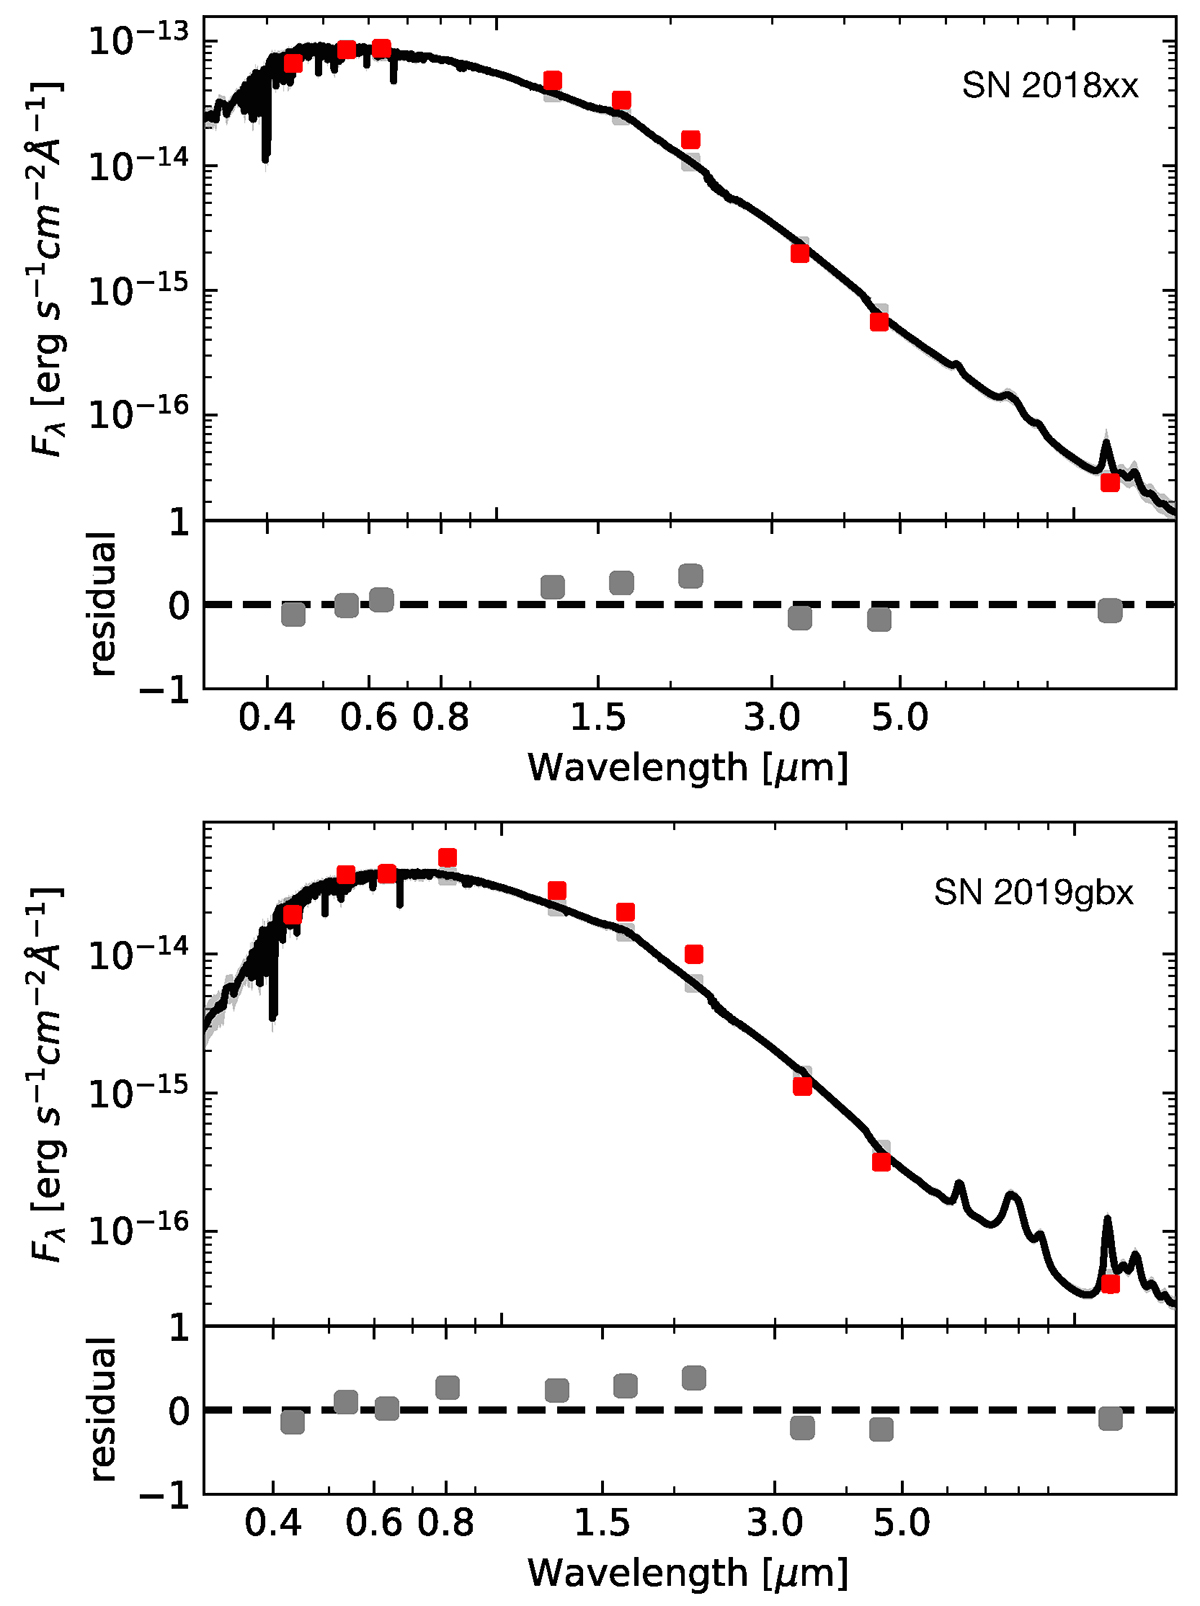
Fig. 12.
Download original image
Flexible Stellar Population Synthesis of piXedfit with MCMC fitting for the SEDs of the host galaxies of SN 2018xx (upper panel) and SN 2019gbx (lower panel). The SED plots represent the observed photometric SED (red squares), the median posterior model photometric SED (light gray squares), and the median posterior model spectra (black curve). In the bottom panels are the residuals of the best-fit (dark gray squares). and the zero residual (horizontal black dashed lines).
Current usage metrics show cumulative count of Article Views (full-text article views including HTML views, PDF and ePub downloads, according to the available data) and Abstracts Views on Vision4Press platform.
Data correspond to usage on the plateform after 2015. The current usage metrics is available 48-96 hours after online publication and is updated daily on week days.
Initial download of the metrics may take a while.