Fig. 11.
Download original image
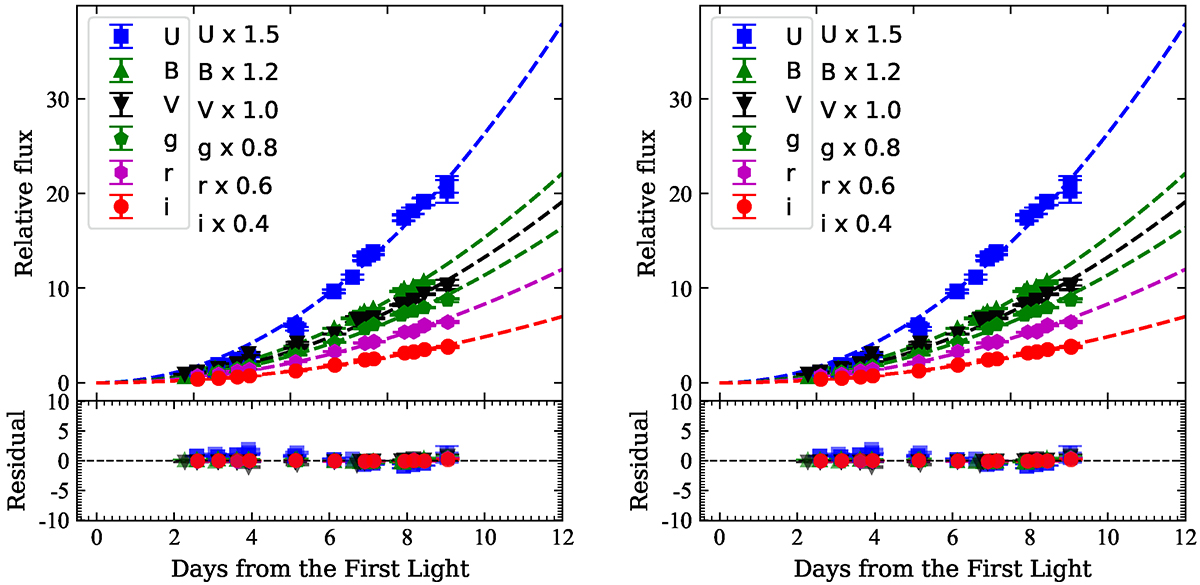
Fit of multiband (UBVgri) early light curves of SN 2018xx (left panel) and SN 2019gbx (right panel). The dashed lines show the expanding fireball model (i.e., f ∝ (t − FLT)2) (Riess et al. 1999) fitting by forcing all six bands to have the same FLT and using the data with t < −7 days. The bottom subpanel in each image displays the residual of the best-fit curves, and the gray dashed horizontal line represents zero residual.
Current usage metrics show cumulative count of Article Views (full-text article views including HTML views, PDF and ePub downloads, according to the available data) and Abstracts Views on Vision4Press platform.
Data correspond to usage on the plateform after 2015. The current usage metrics is available 48-96 hours after online publication and is updated daily on week days.
Initial download of the metrics may take a while.