Open Access
Fig. 10.
Download original image
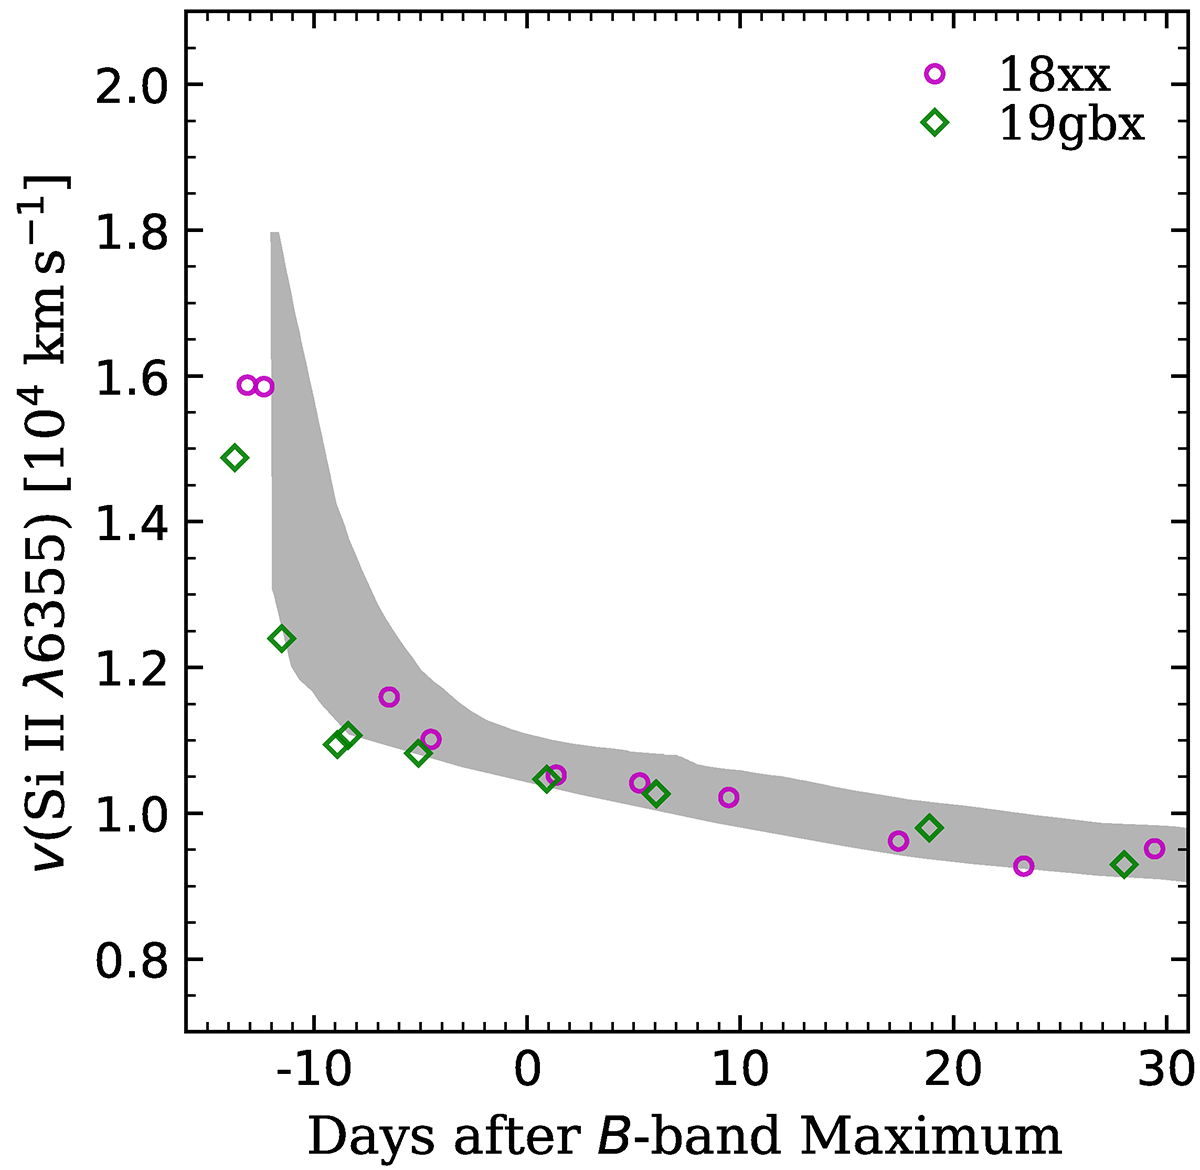
Ejecta velocity evolution of SN 2018xx and SN 2019gbx. The velocities were measured from the minimum of their Si IIλ6355 absorption lines. The shaded region indicates the 1σ uncertainty of the mean velocity curve for NV SNe Ia as derived from Wang et al. (2009).
Current usage metrics show cumulative count of Article Views (full-text article views including HTML views, PDF and ePub downloads, according to the available data) and Abstracts Views on Vision4Press platform.
Data correspond to usage on the plateform after 2015. The current usage metrics is available 48-96 hours after online publication and is updated daily on week days.
Initial download of the metrics may take a while.