| Issue |
A&A
Volume 674, June 2023
|
|
|---|---|---|
| Article Number | A203 | |
| Number of page(s) | 12 | |
| Section | Interstellar and circumstellar matter | |
| DOI | https://doi.org/10.1051/0004-6361/202346446 | |
| Published online | 23 June 2023 | |
The GRAVITY young stellar object survey
X. Probing the inner disk and magnetospheric accretion region of CI Tau★
1
Univ. Grenoble Alpes, CNRS, IPAG,
38100
Grenoble, France
e-mail: This email address is being protected from spambots. You need JavaScript enabled to view it.
2
I. Physikalisches Institut, Universität zu Köln,
Zülpicher Str. 77,
50937
Köln, Germany
3
Max-Planck-Institute for Radio Astronomy,
Auf dem Hügel 69,
53121
Bonn, Germany
4
INAF-Osservatorio Astronomico di Capodimonte,
Salita Moiariello 16,
80131
Napoli, Italy
5
Max Planck Institute for Extraterrestrial Physics,
Giessenbachstr. 1,
85748
Garching, Germany
6
CENTRA – Centro de Astrofísica e Gravitação, IST, Universidade de Lisboa,
1049-001
Lisboa, Portugal
7
Universidade de Lisboa – Faculdade de Ciencias,
Campo Grande,
1749-016
Lisboa, Portugal
8
Max Planck Institute for Astronomy,
Königstuhl 17,
69117
Heidelberg, Germany
9
LESIA, Observatoire de Paris, Université PSL, CNRS, Sorbonne Université, Université de Paris,
5 place Jules Janssen,
92195
Meudon, France
10
Advanced Concepts Team, European Space Agency, TEC-SF, ES-TEC,
Keplerlaan 1,
2201 AZ
Noordwijk, The Netherlands
11
1st Institute of Physics, University of Cologne,
Zülpicher Straße 77,
50937
Cologne, Germany
12
ORIGINS Excellence Cluster,
Boltzmannstraße 2,
85748
Garching, Germany
13
Instituto de Astronomía, Universidad Nacional Autónoma de México,
Apdo. Postal 70264,
Ciudad de México,
04510, Mexico
14
Sterrewacht Leiden, Leiden University,
Postbus 9513,
2300 RA
Leiden, The Netherlands
Received:
17
March
2023
Accepted:
10
April
2023
Abstract
Context. T Tauri stars are known to be the cradle of planet formation. Most exoplanets discovered to date lie at the very inner part of the circumstellar disk (<1 au). The innermost scale of young stellar objects is therefore a compelling region to be addressed, and long-baseline interferometry is a key technique to unveil their mysteries.
Aims. We aim to spatially and spectrally resolve the innermost scale (≤1 au) of the young stellar system CI Tau to constrain the inner disk properties and better understand the magnetospheric accretion phenomenon.
Methods. The high sensitivity offered by the combination of the four 8-m class telescopes of the Very Large Telescope Interferometer (VLTI) allied with the high spectral resolution (R ~ 4000) of the K-band beam combiner GRAVITY offers a unique capability to probe the sub-au scale of the CI Tau system, tracing both dust (continuum) and gas (Brγ line) emission regions. We developed a physically motivated geometrical model to fit the interferometric observables – visibilities and closure phases (CP) – and constrained the physical properties of the inner dusty disk. The continuum-corrected pure line visibilities have been used to estimate the size of the Hydrogen I Brγ emitting region.
Results. From the K-band continuum study, we report a highly inclined (i ~ 70°) resolved inner dusty disk, with an inner edge located at a distance of 21 ± 2 R★ from the central star, which is significantly larger than the dust sublimation radius (Rsub = 4.3 to 8.6 R★). The inner disk appears misaligned compared to the outer disk observed by ALMA and the non-zero closure phase indicates the presence of an asymmetry that could be reproduced with an azimuthally modulated ring with a brighter south-west side. From the differential visibilities across the Brγ line, we resolved the line-emitting region, and measured a size of 4.8- 1.0+ 0.8 R★.
Conclusions. The extended inner disk edge compared to the dust sublimation radius is consistent with the claim of an inner planet, CI Tau b, orbiting close in. The inner-outer disk misalignment may be induced by gravitational torques or magnetic warping. The size of the Brγ emitting region is consistent with the magnetospheric accretion process. Assuming it corresponds to the magnetospheric radius, it is significantly smaller than the co-rotation radius (Rcor= 8.8 ± 1.3 R★), which suggests an unstable accretion regime that is consistent with CI Tau being a burster.
Key words: stars: variables: T Tauri / Herbig Ae/Be / stars: magnetic field / accretion / accretion disks
Based on observations collected at the European Organisation for Astronomical Research in the Southern Hemisphere under ESO programmes 106.212G.004 and 108.228Z.005.
© The Authors 2023
 Open Access article, published by EDP Sciences, under the terms of the Creative Commons Attribution License (https://creativecommons.org/licenses/by/4.0), which permits unrestricted use, distribution, and reproduction in any medium, provided the original work is properly cited.
This article is published in open access under the Subscribe to Open model. This email address is being protected from spambots. You need JavaScript enabled to view it. to support open access publication.
1 Introduction
The power of long baseline near-infrared interferometry to investigate the inner regions of young stellar systems has been amply demonstrated in the past years (Dullemond & Monnier 2010). The inner disk structure (GRAVITY Collaboration 2021), associated outflows (GRAVITY Collaboration 2017), and the accretion process (GRAVITY Collaboration 2020) can all be probed on an angular scale of less than one millisecond of arc (mas), which corresponds to a region extending a few stellar radii around the central star at the distance of the closest star-forming regions. On this scale, accretion in classical T Tauri stars (i.e. Class II young stellar objects with M⋆ < 2 M⊙) occurs along funnel flows due to the strong stellar magnetic field (≈kG) that channels the infalling gas (e.g. Bouvier et al. 2007; Romanova & Owocki 2015; Hartmann et al. 2016). The inner disk is disrupted at the magnetospheric or truncation radius (typically at ~5 R★), where the magnetic pressure of the stellar field balances the thermal and/or ram pressure of the accreting matter (Bessolaz et al. 2008; Blinova et al. 2016; Pantolmos et al. 2020).
The observational evidence for the magnetospheric accretion process in young stars, while quite convincing and widely accepted, has so far been mostly indirect. It relies on measurements of magnetic field strength and topology (e.g. Donati & Landstreet 2009) and mass-accretion rate estimates (e.g. Manara et al. 2021; Alcalá et al. 2021). It is probed through a number of spectral diagnostics, including the emission line spectrum of T Tauri stars that forms, at least in part, in the magnetic funnel flows (e.g. Bouvier et al. 2020a), and the UV continuum excess arising for the accretion shock at the stellar surface (e.g. Espaillat et al. 2022). In recent years, the increased sensitivity of long baseline interferometers has opened a new window to the star-disk interaction region, with results that provide a direct estimate of the extent of the magnetospheric cavity and support the mag-netospheric accretion paradigm (GRAVITY Collaboration 2020, 2023; Bouvier et al. 2020b).
We present here the results from VLTI/GRAVITY observations of the young stellar system CI Tau. CI Tau is a 2 Myr-old (Guilloteau et al. 2014), 0.9 M⊙ (Simon et al. 2019) classical T Tauri star, located at a distance of 160.3 ± 0.4 pc (Gaia Collaboration 2023) in the Taurus molecular cloud. It is known to harbour a strong, mostly poloidal magnetic field up to 3.7 kG and exhibits a variable mass-accretion rate of the order of 2×10⁻⁸ M⊙ yr−1 (Donati et al. 2020). On the large scale, CI Tau is surrounded by a circumstellar disk that extends up to 200 au on millimetre continuum images, and features a succession of dusty rings, with gaps located at radii ~13, 39, and 100 au, suggestive of on-going planet formation (Clarke et al. 2018). CI Tau is indeed the only accreting T Tauri star for which a hot superJupiter (Mp = 11.3 MJup) has been claimed from radial velocity variations (Johns-Krull et al. 2016), although the planetary origin of the radial velocity signal has been questioned (Donati et al. 2020).
Our goal in using these VLTI/GRAVITY observations was to investigate the star-disk interaction region of this intriguing young system, to derive the properties of the dusty inner disk on a scale of 0.1 au or less from continuum K-band visibilities and phases, and to investigate the magnetospheric accretion region through the analysis of differential interferometric quantities measured across the Brγ line profile. Section 2 describes the observations and data reduction; Sect. 3 presents the derivation of the properties of the inner disk and of the Brγ line-emitting region through model-fitting; and Sect. 4 discusses the results in light of the possible existence of CI Tau b, compares the inner disk properties to the outer disk structure, and confronts the interferometric results to magnetospheric accretion models. Conclusions are presented in Sect. 5.
Journal of the VLTI/GRAVITY observations.
2 Observations
We observed CI Tau at two epochs on January 9, 2021, and February 23, 2022, in the K band with the GRAVITY instrument (GRAVITY Collaboration 2017), combining the four unit telescopes (UTs) of the ESO Very Large Telescope Interferometer (VLTI) installed in Paranal, Chile. This programme was part of the GTO large programme dedicated to the young stellar objects (YSO). The maximum baseline accessible with the UTs is 130 m, which corresponds to a maximal angular resolution of λ/2Bmax ≈ 1.5 mas at 2.2 µm. Both epochs were carried out using the single-field on-axis mode, where 50% of the flux was sent to the fringe tracker (FT) and 50% to the scientific instrument (SC): the instrument tracked the fringes on the science target itself to stabilise them at a frequency of 900 Hz (Lacour et al. 2019), enabling a longer integration on the SC, in particular for faint targets. Data were obtained in high spectral resolution mode (R ~ 4000). GRAVITY covers a spectral range from 1.9 to 2.4 µm, including the neutral-hydrogen Brγ line at 2.1661 µm. Weather conditions were excellent during the two nights; we recorded eleven and six 5-min long files on the object in 2021 and 2022, respectively (Table 1). We observed two calibrators before (HD 31464) and after (HD 40003) the observations to accurately estimate the atmospheric transfer function and to calibrate the interferometric observables. We used the Search-Cal tool (Chelli et al. 2016) to establish our calibrator list, which offers a way to search for objects that are single stars, bright, unresolved, and close to the target. Due to technical issues during the first epoch, one of the telescopes (UT2) was down during the observations, which reduced the number of exploitable baselines from six to three.
The data reduction was performed using the ESO GRAVITY pipeline1 (Lapeyrere et al. 2014). For each file, we extracted six (three) complex visibilities and four (one) closure phase measurement(s) in 2022 (2021), dispersed over six spectral channels for the FT and about 1600 for the SC, respectively. With the bluest part of the fringe tracker being contaminated by the metrology laser working at 1.908 µm, we discarded the first channel from our analysis. Finally, we recovered the differential visibilities and phases in the Brγ line region from the SC data. The error bars supplied by the pipeline are known to be underestimated and do not include residual calibration effects (Bouvier et al. 2020b; GRAVITY Collaboration 2021). To be conservative, we refined our uncertainties by computing the total rms over the files for both observables, yielding constant uncertainties of 2% for the visibility and 0.7 degrees for the closure phases. The final uncertainties being similar between the two epochs, we adopted the same error bars for all observations. Normalising uncertainties between our two epochs allowed us to mitigate the effects of different weather conditions and adaptive optics correction, and to attribute the same weight to the 2021 and 2022 data sets.
3 Results
In this section, we report the method used to derive the main properties of the emitting regions both in the K-band continuum and across the Brγ line.
3.1 The inner dusty disk
3.1.1 Geometrical model
To model the continuum complex visibility, we followed the same approach as adopted by Lazareff et al. (2017) and GRAVITY Collaboration (2021), which consists of representing the system as a three-component model: an unresolved point-like star (s) as we were not able to resolve the stellar photosphere, a circumstellar dusty disk (d), and a fully resolved component (h). Each element is represented by a complex visibility function (Vs, Vd, and Vh) and accounted for in the whole system by their flux contributions (Fs, Fd and Fh):
 (1)
(1)
where Vs = 1 for a point source, Vh = 0 for a fully resolved component, and B/λ is the spatial frequency in rad−1 at the different baselines B and Fs + Fd + Fh = 1. We considered wavelength-independent flux contributions (non-chromatic model). The extended component Vh is commonly used to mimic the effect of the scattered light (Pinte et al. 2008), which decreases the visibility at the zero spatial frequency (B/λ = 0). This last component appears to contribute significantly in the case of YSO, such as transitional disks (Lazareff et al. 2017) or T Tauri stars (Anthonioz et al. 2015; GRAVITY Collaboration 2021). As Lazareff et al. (2017), we modelled the dusty disk contribution by a circular ring defined by a radius ar, an inclination i, and a position angle PA. To describe a smooth inner rim radial profile, we convolved the ring model by a 2D Gaussian model. In the following, we present the convolution effect by using the ratio between the Gaussian kernel ak and the half-flux radius a as w = ak/a in percent.
Finally, we added a brightness azimuthal modulation along the ring described by cosine and sine amplitudes c1 and s1. This modulation can be used to represent a non-uniform azimuthal disk profile responsible for a non-zero closure phase signature. In practice, c1 and s1 can vary between -1 and 1, allowing us to drag the brightest portion (if any) around the disk in polar coordinates.
3.1.2 Fitting strategy
For the first epoch, the FT data were not fully exploitable due to a relatively low coherence time (~2–3 ms) that degraded the signal-to-noise ratio significantly. To address this, we used the SC data instead and calculated the observables averaged over 300 spectral channels, which reproduced the spectral resolution of the FT camera (R ~ 30). For the second epoch, the weather conditions were optimal with a coherence time around 7 ms, but we adopted the same approach as in 2021 to get consistent results between the two epochs.
To estimate the properties of the continuum emitting region, we performed the fit over several steps to avoid any local χ2 minima and by robustly estimating the associated uncertainties. Since the circumstellar disk is only partially resolved by the interferometer (V ~ 0.8), its flux contribution Fd and its size ar are partly degenerated (Lazareff et al. 2017). To get an independent estimate of the relative contributions of the disk and the star in the K band, we used the near-infrared veiling measured as described in Sousa et al. (2023). At the time of our 2021 observations, the infrared veiling amounted to aK = 0.83 ± 0.04 (A. Sousa, priv. comm.), yielding an estimate of Fs = 1/(1 + aK) = 55% around 2.2 µm. To consider the star’s intrinsic variability, we adopted a typical error of 5% on this measurement. In addition, we independently evaluated the stellar contribution by fitting the target’s spectral energy distribution. We collected the photometry measurements from EPIC (B, V, and R bands, Howell et al. 2014; Huber et al. 2017), Gaia DR3 (Gbp, G, and Grp bands, Gaia Collaboration 2023), and 2MASS (J, H, and K bands, Skrutskie et al. 2003, 2006). We adopted the stellar parameters and the visual extinction (AV = 0.65) determined by Donati et al. (2020) and used the accurate distance estimate from Gaia DR3 (160.3 ± 0.4 pc, Gaia Collaboration 2023). We thus derived Fs = 55%, which is rather consistent with the veiling measurement. We therefore used this value for the star contribution as a prior during the fitting process, with a 5% tolerance. This additional constraint releases the degeneracy between the ring’s size and its flux contribution.
We carried out an initial parameter search using the Levenberg-Marquardt method2. We estimated the geometrical parameters with and without azimuthal modulation by using the closure phase quantity or not. Given the lower χ2 values obtained with the asymmetric case (1.6 versus 2.1 for the total χ2 value, and 0.5 versus 2.9 when considering the CP only), we adopted this model to fit the data using a Monte-Carlo Markov chain (MCMC) approach3. We used 200 walkers for 2000 iterations and rejected the first 1000 iterations as the burn-in time. The 1-σ uncertainty associated with each parameter was computed from the final distribution of walkers using the 16, 50, and 84% percentiles.
3.1.3 Inner disk properties
For the 2021 data set, the model converges towards an elongated thin ring model with an inner rim radius of ar = 0.20 ± 0.02 au. We estimate a width-to-radius ratio w smaller than 28%, indicating a resolved inner gap. The major-to-minor axis elongation corresponds to a relatively high inclination of i = 71 ± 1° at a position angle of PA = 148 ± 1° counted from north to east. The dusty disk contribution is constant between the two epochs (Fd = 36 ± 2%) and the halo contribution remains between 8 and 10%. For the second epoch, the limited time of observation (~ 1 h) corresponds accordingly to a short range of spatial frequencies (30 versus 75 arcsec−1, see Figs. A.1 and A.3). This prevents us from resolving the inner gap (w close to 1), and from constraining the orientation of the system in a unambiguous way. In order to derive the lower limit of the system’s inclination for the second epoch, we performed a χ2-minimum search (see Appendix B for details). The inner dusty disk properties are presented in Table 2. The values of inclination and position angle for the second epoch correspond to those obtained from the χ2 search (Fig. B.1). The MCMC-posterior distribution obtained for the second epoch converges to a very high inclination (close to 90°, Fig. C.2) that prevents us from determining the asymmetric modulation (cj, Sj compatible with zero). The inner rim radius estimate from the 2022 data set appears significantly smaller than the one derived for the 2021 data set. With the inner gap being unresolved in 2022, the inner disk size could be underestimated.
Figure 1 displays the best-fit model image as determined by GRAVITY in 2021. The non-zero closure phases are consistent with the presence of an asymmetry in the inner rim located in the south-west part. The data-model comparison and the MCMC distributions are presented and discussed in Appendices A and C.
3.2 The Brγ line-emitting region
GRAVITY’s high spectral resolution allowed us to resolve the Brγ line profile at 2.1661 µm. This spectral feature is the privileged tracer of the star–disk interaction, attributed to the magnetospheric accretion process (Hartmann et al. 1994). Following Weigelt et al. (2007), Kraus et al. (2008), and GRAVITY Collaboration (2023), we computed the continuum-subtracted observables, the so-called pure line visibilities, by using the emission line profile provided by GRAVITY. This differential observable is only sensitive to the Brγ emitting region and it removes all contributions from the star and disk, assuming no photospheric absorption is present in the line region, which is adequate for cooler T Tauri stars. The pure line visibility Vline(λ) was computed as follows:
 (2)
(2)
where FL/C denotes the total line-to-continuum flux ratio as taken from the normalised spectrum (Fig. 2), VCont is the visibility computed in the continuum, and VTot is the total complex quantities measured by GRAVITY.
In order to enhance the signal across the Brγ line, we combined the 11 files available for the first epoch in 2021. The u–v plane rotation occurring during the observational sequence remained relatively small (<10 degrees) and thus the files could be combined without degrading the scientific signal significantly. Unfortunately, the data quality in 2022 was not sufficient to reach the required signal-to-noise ratio to detect the differential signal. Figure 2 presents the Brγ emission line profile, the total differential visibility, and the extracted pure line visibility. A significant signal was only detected for the most extended baseline (UT1-UT4, 126.16 m) with a 3-σ detection in the visibility amplitude. We did not detect any significant differential phase signals for either epochs or baselines.
The pure line visibilities across the Brγ line profile range from 0.90 to 0.93, indicating a more compact emitting region than the inner disk seen in the continuum. In order to estimate the characteristic size of the Brγ emitting region, we averaged the five pure line visibilities over the spectral channels and derived a unique visibility measurement of VBrγ = 0.92 ± 0.03. Based on a simple geometric Gaussian disk model (Berger & Segransan 2007), we extracted the half-flux radius – or half width half maximum (HWHM) – corresponding to VBrγ. Figure 3 presents the visibility curve of a 2D Gaussian model compared to the extracted pure line visibility. The visibility uncertainty of 0.03 is directly reported on the visibility curve model (blue shaded area), which yields asymmetric errors on the half-flux radius estimate. We thus derived a Brγ emission region radius of  mas, which corresponds to
  au at the distance of CI Tau, or
  for a stellar radius of 2R⊙. The Brγ emitting region is thus significantly more compact than the continuum disk radius.
Best-fit parameters of the K-band continuum VLTI/GRAVITY data of CI Tau obtained in 2021 and 2022 with 1σ error bars.
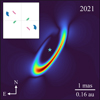 |
Fig. 1 Model image of CI Tau’s inner disk in 2021. The position of the star is depicted and has been removed to show the disk structure. The upper-left inset shows the u–υ coverage. The colour circles represent the baselines: UT1–UT3 (pink), UT3–UT4 (green), and UT1–UT4 (blue). |
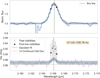 |
Fig. 2 Brγ line observables. Top: normalised spectral line profile averaged over the four telescopes with GRAVITY. Bottom: differential visibilities from the UT1-UT4 baseline of the CI Tau observation in 2021. The small blue dots and error bars represent the total visibility. The larger coloured dots indicate the pure line visibilities after the subtraction of the continuum contribution (see Eq. (2)). The continuum estimate and the associated uncertainty are shown as red dashed lines. The Gaussian model used to fit the total visibility is represented as a blue line. |
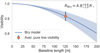 |
Fig. 3 Comparison between the observed Brγ visibility (orange dot) and a visibility curve predicted for a Gaussian disk model of the emitting region (blue curve). The blue shaded area depicts the uncertainty on the size relative to the visibility error. |
3.3 Mass-accretion rate and truncation radius
To estimate the instantaneous mass-accretion rate at the time of GRAVITY observations, we computed the Brγ line luminosity and used the line-to-accretion luminosity relations from Alcalá et al. (2017). We measured the equivalent width of the Brγ line on the GRAVITY spectrum, EWBrγ, and estimated the extinction-corrected nearby continuum flux from the 2MASS K-band magnitude (Skrutskie et al. 2006). With EWBrγ = 7.9 ± 0.4 Å and a continuum flux of 3.3 × 10⁻¹³ Wm−2 µm−1, we derived a line luminosity of (2.07 ± 0.10) × 10−4 L⊙ at 160.3 ± 0.4pc.
The accretion luminosity could then be derived from the following empirical relationship (Alcalá et al. 2017):
 (3)
(3)
with a = 1.19 ± 0.10 and b = 4.02 ± 0.51. Finally, the accretion luminosity could be converted into an instantaneous mass-accretion rate using the following relation (Hartmann et al. 1998):
 (4)
(4)
which assumes that the energy released by the infalling material confined within the magnetosphere is entirely converted into accretion luminosity. Adopting the GRAVITY size of the Brγ emitting region RBrγ = 4.8 R⋆ for the magnetosphere radius, we derived a mass-accretion rate of  .
.
The size of the magnetospheric accretion region, characterised by the magnetic truncation radius Rtr, is driven by the strength of the magnetic field and the mass-accretion rate (Hartmann et al. 2016):
 (5)
(5)
where B is the surface field strength of the dipolar magnetic field at the stellar equator in kG, R2 is the stellar radius in units of 2R⊙, M0.5 is the stellar mass in units of 0.5M⊙, and M−8 is the mass-accretion rate in units of 10−8 M⊙ yr−1.
Using the stellar parameters of CI Tau reported by Donati et al. (2020) for a magnetic field of 0.85 kG4, a stellar radius of 2.0 ± 0.3 R⊙, a mass of 0.90 ± 0.02 M⊙ (Simon et al. 2019), and the mass-accretion rate derived from Eq. (4), we computed a truncation radius Rtr = 3.6 ± 1.5R⋆, in agreement with the interferometric half-flux radius derived above for the Brγ line-emitting region. We therefore conclude that most of the Brγ emission originates from the magnetospheric accretion region.
4 Discussion
The high spatial and spectral resolution of GRAVITY allowed us to detect and characterise the inner region of the CI Tau system with an unprecedented precision. Figure 4 illustrates the characteristic sizes of the system. In this section, we discuss how the GRAVITY results shed light on the global structure of the inner system.
4.1 The inner dust cavity
The continuum analysis of the two epochs of observation yields an inner dusty rim located between 14 and 21 R⋆ from the central star. This direct measurement appears to be significantly higher than the estimate of the dust sublimation radius. The K-band emission of T Tauri stars is supposed to be dominated by the directly irradiated front of the dusty disk rim (Dullemond & Monnier 2010). For a given stellar luminosity, we assessed the radius corresponding to the thermal equilibrium of the dust grains to remain under the sublimation temperature at 1500 K for silicates. We used the relation from Monnier & Millan-Gabet (2002) to determine the sublimation radius (Rsub) in au:
 (6)
(6)
with QR being the absorption efficiency ratio of the dust between the incident and re-emitted field, and Tsub the sublimation temperature. Monnier & Millan-Gabet (2002) determined that the absorption efficiency QR depends on the dust properties and the effective temperature of the central star. For an effective temperature of 4200 K (Donati et al. 2020) and a typical grain size distribution ranging from 0.03 to 1 µm, QR ranges from one to four. For a stellar luminosity of 1.26 L⊙ (Donati et al. 2020), the 1500 K sublimation radius ranges from 0.04 to 0.08 au, that is 4.3–8.6 R⋆. The inner disk rim location we derived is therefore at least two times farther than the sublimation radius (see Fig. 4), when considering a sublimation temperature of 1500 K.
One potential explanation for an extended inner dust cavity is the presence of a hypothetical close-in planet. CI Tau is so far the only Class II pre-main sequence star claimed to host a hot Jupiter, CI Tau b, with a mass of ~ 11.3 Jupiter mass (Johns-Krull et al. 2016; Flagg et al. 2019). If such a planet exists, it could significantly affect the inner region of the disk. Muley & Dong (2021) demonstrate that a massive candidate planet orbiting at 0.08 au leads to the formation of an inner gap ranging from 0.1 to 0.2 au depending on the eccentricity of the planet, which is fully compatible with our observation.
4.2 The inner and outer disk misalignment
Young stellar objects such as the CI Tau system harbour a large outer disk structure. Clarke et al. (2018) retrieved the geometrical properties of CI Tau’s outer disk on a scale from 1 to 100 au using the Atacama Large Millimeter/Submillimeter Array (ALMA). The outer disk consists of multiple rings seen at an inclination of iout = 50° and a position angle of PAout ≃ 11° from north to east. In comparison, the inner disk orientation we derived from GRAVITY features iin ≃ 70° and PAin = 148°. The two disks thus appear significantly misaligned. Such a misalignment has been recently reported on a few targets among a large sample of YSO (Bohn et al. 2022).
Following Min et al. (2017) and Bohn et al. (2022), we could thus measure the misalignment angle between the inner and outer disks as follows:
![Mathematical equation: $\matrix{ {{\rm{\Delta }}\theta \left( {{i_{{\rm{in}}}},{\rm{P}}{{\rm{A}}_{{\rm{in}}}},{i_{{\rm{out}}}},{\rm{P}}{{\rm{A}}_{{\rm{out}}}}} \right) = \arccos \left[ {\sin \left( {{i_{{\rm{in}}}}} \right)\sin \left( {{i_{{\rm{out}}}}} \right)} \right.} \hfill \cr {\,\,\,\,\,\,\,\,\,\,\,\,\,\,\,\,\,\,\,\,\,\,\,\,\,\,\,\,\,\,\,\,\,\,\,\,\,\,\,\,\,\,\,\,\,\,\,\,\,\,\,\,\,\,\,\,\,\,\,\,\,\,\,\, \times \cos \left( {{\rm{P}}{{\rm{A}}_{{\rm{in}}}} - {\rm{P}}{{\rm{A}}_{{\rm{out}}}}} \right)} \hfill \cr {\,\,\left. {\,\,\,\,\,\,\,\,\,\,\,\,\,\,\,\,\,\,\,\,\,\,\,\,\,\,\,\,\,\,\,\,\,\,\,\,\,\,\,\,\,\,\,\,\,\,\,\,\,\,\,\,\,\,\,\,\,\,\,\,\,\, + \cos \left( {{i_{in}}} \right)\cos \left( {{i_{{\rm{out}}}}} \right)} \right].} \hfill \cr } $](/articles/aa/full_html/2023/06/aa46446-23/aa46446-23-eq17.png) (7)
(7)
The misalignment angle Δθ corresponds to the angle between the two normal vectors defined by the planes of the inner and outer disk. Additionally, we do not know which side of the inner disk is closest to the observer. Two misalignment angles could therefore be calculated, namely Δθ1 ~ 109 or Δθ2 ~ 42° for CI Tau. In both cases, the inner and outer disks appear to be significantly misaligned. While such a significant misalignment may induce a shadow projected onto the outer disk (Bohn et al. 2022), such a shadow is not detected in scattered light images of CI Tau’s disk (Garufi et al. 2022).
Various physical processes can induce a substantial misalignment between the inner and the outer disks. Gravitational torques caused by the presence of low-mass (Arzamasskiy et al. 2018) or high-mass (Xiang-Gruess & Papaloizou 2013) planets can force the precession of the inner disk, and physically disconnect it from the outer disk. For the massive case (>1 MJup), if the companion’s angular momentum is significantly greater than the disk one, the inner disk can gain a warped inner structure with an inclination of up to ≃20° relative to the outer part. Recent 3D simulations reinforce this assumption for planets massive enough to carve gaps (Nealon et al. 2018). Inner-outer disk misalignments are not only observed as a consequence of massive companions. Differential angular momentum across the disk can induce a tilt between the spin vectors of the various components (star, inner and outer disks; Epstein-Martin et al. 2022). The magnetic star–disk interaction can also warp the close-in region and be responsible for an inclined inner disk, up to 40° inclination, with respect to the stellar-spin axis (Romanova et al. 2021). Finally, an external infall of gaseous material could affect the outer disk region and induce a misalignment (Kuffmeier et al. 2021). A detailed review of the misalignment processes and shadowing effects is provided in Benisty et al. (2022).
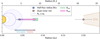 |
Fig. 4 Schematic view of the innermost region of the CI Tau system. The sizes and their uncertainties derived from the GRAVITY observations are represented for the Brγ emitting region (blue circle) and for the K-band continuum (orange circle). The purple circle (and shaded area) depicts the truncation radius and its uncertainty derived from the GRAVITY Brγ emission line (Sect. 3.3). Additional characteristic scales associated with YSO are depicted: the sublimation radius (Rsub, pink line) for a range of absorption QR from one to four and the co-rotation radius (Rcor, green line). The stable-unstable magnetospheric accretion regimes are indicated with a boundary around 70% of the Rcor (Blinova et al. 2016). |
4.3 The magnetospheric accretion region
From the exquisite precision of the differential visibilities achievable with GRAVITY, we were able to spatially resolve the characteristic size of the Brγ line-emitting region. With a half-flux radius of  au, a large fraction of the Brγ line emission appears to originate from a region extending over
  around the star.
A quantitative comparison between the Brγ half-flux radius and the co-rotation radius can be used as a simple criterion to determine the physical origin of the observed Brγ line emission. If the Brγ emission appears as a compact source, smaller than the co-rotation radius, the origin is consistent with the magne-tospheric accretion scenario. In contrast, if the Brγ emission is significantly larger than the co-rotation radius, other mechanisms such as disk winds or outflows are likely to contribute to the observed Brγ profile (GRAVITY Collaboration 2020). The co-rotation radius is defined as the one where the angular velocity of the rotating disk matches the angular velocity of the star:
 (8)
(8)
For a rotational period of Prot = 9.00 ± 0.05 days (Donati et al. 2020) and a mass of 0.90 ± 0.02 M⊙ (Simon et al. 2019), we computed a co-rotation radius of Rcor = 8.8 ± 1.3R⋆.
We find here that the Brγ half-flux radius is significantly smaller than the co-rotation radius, which argues in favour of most of the line flux arising from the magnetospheric accretion process. Furthermore, based on spectro-polarimetric magnetic field measurements, Donati et al. (2020) estimated a range of values between 3.7 and 6.3 R⋆ for the magnetospheric truncation radius of CI Tau, which is consistent with our GRAVITY measurement of 3.6 ± 1.5 R⋆. We caution, however, that the interferometric Brγ half-flux radius derived from a 2D Gaussian model may underestimate the full extent of the magnetospheric accretion region (Tessore et al. 2023).
From our truncation radius estimate (Sect. 3.3), we derived a ratio of Rtr/Rcor = 0.41 ± 0.18 and the system will likely be in an unstable accretion regime (Rtr/Rcor≲ 0.7, Blinova et al. 2016). In magnetic star-disk interactions, unstable accretion is the outcome of an interchange instability where the gas penetrates the stellar magnetosphere through equatorial tongues (Romanova et al. 2008) in addition to the stable funnel flows (i.e. stable accretion). Such accretion tongues are expected to deposit matter at random places on the stellar surface, usually close to the stellar equator, a feature that can possibly explain the stochastic photometric behaviour of the system known as a burster (Roggero et al. 2021; Cody et al. 2022).
5 Conclusion
We have used the VLTI/GRAVITY instrument to probe the innermost scales of the young system CI Tau. Investigating the K-band spectral domain at high spectral resolution has allowed us to study the system in the continuum to probe dust emission and within the Brγ line to trace gas emission simultaneously. Below, we summarise our major results.
(i) From the continuum analysis, we report the detection of a highly inclined resolved inner disk, whose inner edge is located at a distance of 21 ± 2 R⋆ from the central star. The measured inner rim position seems to be significantly farther than the theoretical sublimation radius (4–8 R⋆ for a typical sublimation temperature of silicates of 1500 K), a result which might support the presence of a close-in massive planetary companion.
(ii) The inner disk exhibits a strong misalignment relative to the outer disk seen at submillimetre wavelengths with ALMA. Such a misalignment could be induced by magnetic warping or by gravitational torques induced by a close-in massive companion.
(iii) We constrained the half-flux radius of the Brγ emitting region to be at a distance of 4.8 R⋆ from the central star, which is consistent with the magnetospheric accretion paradigm. The Brγ size is significantly smaller than the co-rotation radius, which leads to an unstable accretion regime, presumably at the origin of the stochastic photometric variability of the system.
The interferometric precision achievable today with GRAVITY at the VLTI has allowed us to characterise the inner scales of the CI Tau system with an unprecedented sensitivity. Given the high variability of this system, a temporal follow-up represents the most promising opportunity to investigate the dynamics of the star-disk interaction process, and to ascertain the origin of the Brγ emission. This work represents a first step to understand the star-planets-disk interactions occurring on sub-au scales in YSO.
Acknowledgements
We acknowledge support from the European Research Council (ERC) under the European Union’s Horizon 2020 research and innovation programme (grant agreement no. 742095; SPIDI: Star-Planets-Inner Disk-Interactions, http://www.spidi-eu.org). We thank A. Sousa for providing the infrared veiling measurements. We thank M. Benisty for the fruitful discussion about the disk misalignment and for confirming the misalignment values. We thank A. Wojtczak for the pure line derivation and the benchmark of our algorithms. We thank in particular the SPIDI crew for providing ideas and triggering discussions on the accretion phenomenon (B. Tessore, R. Manick). A.C.G. has been supported by PRIN-INAF MAIN-STREAM 2017 “Protoplanetary disks seen through the eyes of new-generation instruments” and PRIN-INAF 2019 “Spectroscopically tracing the disk dispersal evolution (STRADE)”. This work has made use of data from the European Space Agency (ESA) mission Gaia (https://www.cosmos.esa.int/gaia), processed by the Gaia Data Processing and Analysis Consortium (DPAC, https://www.cosmos.esa.int/web/gaia/dpac). This research made use of NASA’s Astrophysics Data System; SCIPY (Virtanen et al. 2020); NUMPY (Harris et al. 2020); MATPLOTLIB (Hunter 2007); and Astropy, a community-developed core Python package for Astronomy (Astropy Collaboration 2018). This research has made use of the Jean-Marie Mariotti Center LITpro (http://www.jmmc.fr/litpro), Aspro2 (http://www.jmmc.fr/aspro2) and SearchCal (https://www.jmmc.fr/searchcal) services, co-developped by CRAL, IPAG and LAGRANGE.
Appendix A Data-model comparison
In this appendix, we present the results and data-model comparisons of the MCMC posterior determination of the K-band continuum geometrical model for the two epochs of observations. Figures A.1, A.2, A.3 and A.4 show the comparison between the best-fitted model and the data for the squared visibilities and closure phases, respectively. The visibilities indicate a resolved structure (V2 < 0.8), while the non-zero closure phase (< 2°) points to an asymmetric environment. The small tilt of the shortest baseline compared to the middle-range baseline suggests an inclined object, as retrieved by our image model (Fig. 1).
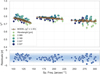 |
Fig. A.1 Comparison of the best-fitted model with the squared visibilities for epoch 1. The colours illustrate the wavelengths of the four spectral channels used to fit the K-band continuum. The model is presented in orange. The lower panel shows the residuals compared to l-σ, 2-σ, and 3-σ relative errors. |
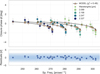 |
Fig. A.2 Comparison of the best-fitted model with the closure phases for epoch 1. Same description as in Fig. A.1. It is important to note that we present only one closure phase triangle due to the missing UT2 during the observations. |
Appendix B χ2 -search uncertainty refinement
Figure B.1 shows the χ2 data-comparison values for a range of inclination (i) and the position angle (PA). This conservative method allows us to give a lower limit on the inclination parameters, not well constrained by the MCMC-posterior estimation due to the limited range of spatial frequencies covered during the second epoch (30 versus 75 arcsec−1 in 2021). The two u-v coverages are presented in Figure B.2 and B.3. When using the reduced χ2 as a limiting factor, we considered fully correlated error bars on the data. This method tends to overestimate the errors associated with the physical parameters we aim to constrain. In our case, the system orientation is consistent with a high inclination (i > 70°) at a position angle in agreement with our 2021 estimate.
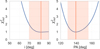 |
Fig. B.1 χ2-curve search around the MCMC-posterior results of the second epoch in 2022. Left: Inclination between 50 and 90°. Right: Position angle between 120 and 170°. The orange vertical line denotes the posterior mean value. The orange shaded area represents the 1-σ uncertainty corresponding to |

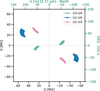 |
Fig. B.2 Fourier coverage obtained for the 2021 epoch. |
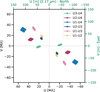 |
Fig. B.3 Fourier coverage obtained for the 2022 epoch. |
Appendix C MCMC posterior distribution
Figure C.1 and C.2 show the final posterior distribution of walkers corresponding to 200,000 individual iterations. The MCMC fit converges towards a unique model of an inclined thin disk for the first epoch (2021). The parameters estimations are presented in Table 2. In 2022, the posterior distribution did not allow us to determine the system inclination or the width-radius ratio (w) unambiguously. The one-hour time range observation available in 2022 does not offer sufficient rotation of the u-v coverage to derive these two parameters accurately, contrary to the three-hour range time achieved in 2021. The ratio w close to one indicates that we are not able to constrain the gap size reported in 2021. Additionally, the modulation parameters cj and sj are compatible with zero. Nevertheless, we are able to deliver strong constraints on the half-flux radius of the disk, the position angle, and components’ contributions (see Table 2).
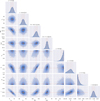 |
Fig. C.1 Final distribution of parameter values deduced from the MCMC computation for the 2021 data. The standard percentiles were used to derive the mean values and the uncertainties. |
References
- Alcalá, J. M., Manara, C. F., Natta, A., et al. 2017, A&A, 600, A20 [NASA ADS] [CrossRef] [EDP Sciences] [Google Scholar]
- Alcalá, J. M., Gangi, M., Biazzo, K., et al. 2021, A&A, 652, A72 [NASA ADS] [CrossRef] [EDP Sciences] [Google Scholar]
- Anthonioz, F., Ménard, F., Pinte, C., et al. 2015, A&A, 574, A41 [NASA ADS] [CrossRef] [EDP Sciences] [Google Scholar]
- Arzamasskiy, L., Zhu, Z., & Stone, J. M. 2018, MNRAS, 475, 3201 [NASA ADS] [CrossRef] [Google Scholar]
- Astropy Collaboration (Price-Whelan, A. M., et al.) 2018, AJ, 156, 123 [Google Scholar]
- Benisty, M., Dominik, C., Follette, K., et al. 2022, ArXiv e-prints [arXiv:2203.09991] [Google Scholar]
- Berger, J. P., & Segransan, D. 2007, New Astron. Rev., 51, 576 [CrossRef] [Google Scholar]
- Bessolaz, N., Zanni, C., Ferreira, J., Keppens, R., & Bouvier, J. 2008, A&A, 478, 155 [NASA ADS] [CrossRef] [EDP Sciences] [Google Scholar]
- Blinova, A. A., Romanova, M. M., & Lovelace, R. V. E. 2016, MNRAS, 459, 2354 [Google Scholar]
- Bohn, A. J., Benisty, M., Perraut, K., et al. 2022, A&A, 658, A183 [NASA ADS] [CrossRef] [EDP Sciences] [Google Scholar]
- Bouvier, J., Alencar, S. H. P., Harries, T. J., Johns-Krull, C. M., & Romanova, M. M. 2007, in Protostars and Planets V, eds. B. Reipurth, D. Jewitt, & K. Keil (Tucson: University of Arizona Press), 479 [Google Scholar]
- Bouvier, J., Alecian, E., Alencar, S. H. P., et al. 2020a, A&A, 643, A99 [EDP Sciences] [Google Scholar]
- Bouvier, J., Perraut, K., Le Bouquin, J. B., et al. 2020b, A&A, 636, A108 [NASA ADS] [CrossRef] [EDP Sciences] [Google Scholar]
- Chelli, A., Duvert, G., Bourgès, L., et al. 2016, A&A, 589, A112 [NASA ADS] [CrossRef] [EDP Sciences] [Google Scholar]
- Clarke, C. J., Tazzari, M., Juhasz, A., et al. 2018, ApJ, 866, L6 [NASA ADS] [CrossRef] [Google Scholar]
- Cody, A. M., Hillenbrand, L. A., & Rebull, L. M. 2022, AJ, 163, 212 [NASA ADS] [CrossRef] [Google Scholar]
- Donati, J. F., & Landstreet, J. D. 2009, ARA&A, 47, 333 [Google Scholar]
- Donati, J. F., Bouvier, J., Alencar, S. H., et al. 2020, MNRAS, 491, 5660 [Google Scholar]
- Dullemond, C. P., & Monnier, J. D. 2010, ARA&A, 48, 205 [NASA ADS] [CrossRef] [Google Scholar]
- Epstein-Martin, M., Becker, J., & Batygin, K. 2022, ApJ, 931, 42 [NASA ADS] [CrossRef] [Google Scholar]
- Espaillat, C. C., Herczeg, G. J., Thanathibodee, T., et al. 2022, AJ, 163, 114 [NASA ADS] [CrossRef] [Google Scholar]
- Flagg, L., Johns-Krull, C. M., Nofi, L., et al. 2019, ApJ, 878, L37 [NASA ADS] [CrossRef] [Google Scholar]
- Foreman-Mackey, D., Hogg, D. W., Lang, D., & Goodman, J. 2013, PASP, 125, 306 [Google Scholar]
- Gaia Collaboration (Vallenari, A., et al.) 2023, A&A, 674, A1 [NASA ADS] [CrossRef] [EDP Sciences] [Google Scholar]
- Garufi, A., Dominik, C., Ginski, C., et al. 2022, A&A, 658, A137 [NASA ADS] [CrossRef] [EDP Sciences] [Google Scholar]
- GRAVITY Collaboration (Abuter, R., et al.) 2017, A&A, 602, A94 [NASA ADS] [CrossRef] [EDP Sciences] [Google Scholar]
- GRAVITY Collaboration (Garcia Lopez, R., et al.) 2017, A&A, 608, A78 [NASA ADS] [CrossRef] [EDP Sciences] [Google Scholar]
- GRAVITY Collaboration (Garcia Lopez, R., et al.) 2020, Nature, 584, 547 [Google Scholar]
- GRAVITY Collaboration (Perraut, K., et al.) 2021, A&A, 655, A73 [NASA ADS] [CrossRef] [EDP Sciences] [Google Scholar]
- GRAVITY Collaboration (Wojtczak, J. A., et al.) 2023, A&A, 669, A59 [Google Scholar]
- Guilloteau, S., Simon, M., Piétu, V., et al. 2014, A&A, 567, A117 [NASA ADS] [CrossRef] [EDP Sciences] [Google Scholar]
- Harris, C. R., Millman, K. J., van der Walt, S. J., et al. 2020, Nature, 585, 357 [NASA ADS] [CrossRef] [Google Scholar]
- Hartmann, L., Hewett, R., & Calvet, N. 1994, ApJ, 426, 669 [Google Scholar]
- Hartmann, L., Calvet, N., Gullbring, E., & D’Alessio, P. 1998, ApJ, 495, 385 [Google Scholar]
- Hartmann, L., Herczeg, G., & Calvet, N. 2016, ARA&A, 54, 135 [Google Scholar]
- Howell, S. B., Sobeck, C., Haas, M., et al. 2014, PASP, 126, 398 [Google Scholar]
- Huber, D., Bryson, S. T., et al. 2017, VizieR Online Data Catalog: IV/34 [Google Scholar]
- Hunter, J. D. 2007, Comput. Sci. Eng., 9, 90 [NASA ADS] [CrossRef] [Google Scholar]
- Johns-Krull, C. M., McLane, J. N., Prato, L., et al. 2016, ApJ, 826, 206 [Google Scholar]
- Kraus, S., Hofmann, K. H., Benisty, M., et al. 2008, A&A, 489, 1157 [NASA ADS] [CrossRef] [EDP Sciences] [Google Scholar]
- Kuffmeier, M., Dullemond, C. P., Reissl, S., & Goicovic, F. G. 2021, A&A, 656, A161 [NASA ADS] [CrossRef] [EDP Sciences] [Google Scholar]
- Lacour, S., Dembet, R., Abuter, R., et al. 2019, A&A, 624, A99 [NASA ADS] [CrossRef] [EDP Sciences] [Google Scholar]
- Lapeyrere, V., Kervella, P., Lacour, S., et al. 2014, SPIE Conf. Ser., 9146, 91462D [Google Scholar]
- Lazareff, B., Berger, J. P., Kluska, J., et al. 2017, A&A, 599, A85 [NASA ADS] [CrossRef] [EDP Sciences] [Google Scholar]
- Manara, C. F., Frasca, A., Venuti, L., et al. 2021, A&A, 650, A196 [NASA ADS] [CrossRef] [EDP Sciences] [Google Scholar]
- Min, M., Stolker, T., Dominik, C., & Benisty, M. 2017, A&A, 604, A10 [Google Scholar]
- Monnier, J. D., & Millan-Gabet, R. 2002, ApJ, 579, 694 [Google Scholar]
- Muley, D., & Dong, R. 2021, ApJ, 921, L34 [NASA ADS] [CrossRef] [Google Scholar]
- Nealon, R., Dipierro, G., Alexander, R., Martin, R. G., & Nixon, C. 2018, MNRAS, 481, 20 [Google Scholar]
- Pantolmos, G., Zanni, C., & Bouvier, J. 2020, A&A, 643, A129 [NASA ADS] [CrossRef] [EDP Sciences] [Google Scholar]
- Pinte, C., Ménard, F., Berger, J. P., Benisty, M., & Malbet, F. 2008, ApJ, 673, L63 [NASA ADS] [CrossRef] [Google Scholar]
- Roggero, N., Bouvier, J., Rebull, L. M., & Cody, A. M. 2021, A&A, 651, A44 [NASA ADS] [CrossRef] [EDP Sciences] [Google Scholar]
- Romanova, M. M., & Owocki, S. P. 2015, Space Sci. Rev., 191, 339 [Google Scholar]
- Romanova, M. M., Kulkarni, A. K., & Lovelace, R. V. E. 2008, ApJ, 673, L171 [Google Scholar]
- Romanova, M. M., Koldoba, A. V., Ustyugova, G. V., et al. 2021, MNRAS, 506, 372 [NASA ADS] [CrossRef] [Google Scholar]
- Simon, M., Guilloteau, S., Beck, T. L., et al. 2019, ApJ, 884, 42 [NASA ADS] [CrossRef] [Google Scholar]
- Skrutskie, M. F., Cutri, R. M., Stiening, R., et al. 2003, VizieR Online Data Catalog: VII/233 [Google Scholar]
- Skrutskie, M. F., Cutri, R. M., Stiening, R., et al. 2006, AJ, 131, 1163 [NASA ADS] [CrossRef] [Google Scholar]
- Sousa, A. P., Bouvier, J., Alencar, S. H. P., et al. 2023, A&A, 670, A142 [NASA ADS] [CrossRef] [EDP Sciences] [Google Scholar]
- Tessore, B., Soulain, A., Pantolmos, G., et al. 2023, A&A, 671, A129 [NASA ADS] [CrossRef] [EDP Sciences] [Google Scholar]
- Virtanen, P., Gommers, R., Oliphant, T. E., et al. 2020, Nat. Methods, 17, 261 [Google Scholar]
- Weigelt, G., Kraus, S., Driebe, T., et al. 2007, A&A, 464, 87 [NASA ADS] [CrossRef] [EDP Sciences] [Google Scholar]
- Xiang-Gruess, M., & Papaloizou, J. C. B. 2013, MNRAS, 431, 1320 [Google Scholar]
Available with scipy (Virtanen et al. 2020).
Available with emcee (Foreman-Mackey et al. 2013).
We used the polar magnetic field value of 1.7 kG divided by two to retrieve the value at the equator.
All Tables
Best-fit parameters of the K-band continuum VLTI/GRAVITY data of CI Tau obtained in 2021 and 2022 with 1σ error bars.
All Figures
|
Fig. 1 Model image of CI Tau’s inner disk in 2021. The position of the star is depicted and has been removed to show the disk structure. The upper-left inset shows the u–υ coverage. The colour circles represent the baselines: UT1–UT3 (pink), UT3–UT4 (green), and UT1–UT4 (blue). |
| In the text | |
|
Fig. 2 Brγ line observables. Top: normalised spectral line profile averaged over the four telescopes with GRAVITY. Bottom: differential visibilities from the UT1-UT4 baseline of the CI Tau observation in 2021. The small blue dots and error bars represent the total visibility. The larger coloured dots indicate the pure line visibilities after the subtraction of the continuum contribution (see Eq. (2)). The continuum estimate and the associated uncertainty are shown as red dashed lines. The Gaussian model used to fit the total visibility is represented as a blue line. |
| In the text | |
|
Fig. 3 Comparison between the observed Brγ visibility (orange dot) and a visibility curve predicted for a Gaussian disk model of the emitting region (blue curve). The blue shaded area depicts the uncertainty on the size relative to the visibility error. |
| In the text | |
|
Fig. 4 Schematic view of the innermost region of the CI Tau system. The sizes and their uncertainties derived from the GRAVITY observations are represented for the Brγ emitting region (blue circle) and for the K-band continuum (orange circle). The purple circle (and shaded area) depicts the truncation radius and its uncertainty derived from the GRAVITY Brγ emission line (Sect. 3.3). Additional characteristic scales associated with YSO are depicted: the sublimation radius (Rsub, pink line) for a range of absorption QR from one to four and the co-rotation radius (Rcor, green line). The stable-unstable magnetospheric accretion regimes are indicated with a boundary around 70% of the Rcor (Blinova et al. 2016). |
| In the text | |
|
Fig. A.1 Comparison of the best-fitted model with the squared visibilities for epoch 1. The colours illustrate the wavelengths of the four spectral channels used to fit the K-band continuum. The model is presented in orange. The lower panel shows the residuals compared to l-σ, 2-σ, and 3-σ relative errors. |
| In the text | |
|
Fig. A.2 Comparison of the best-fitted model with the closure phases for epoch 1. Same description as in Fig. A.1. It is important to note that we present only one closure phase triangle due to the missing UT2 during the observations. |
| In the text | |
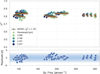 |
Fig. A.3 Same description as in Fig. A.1, but for the 2022 data set. |
| In the text | |
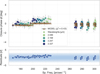 |
Fig. A.4 Same description as in Fig. A.2, but for the 2022 data set. |
| In the text | |
|
Fig. B.1 χ2-curve search around the MCMC-posterior results of the second epoch in 2022. Left: Inclination between 50 and 90°. Right: Position angle between 120 and 170°. The orange vertical line denotes the posterior mean value. The orange shaded area represents the 1-σ uncertainty corresponding to |
| In the text | |
|
Fig. B.2 Fourier coverage obtained for the 2021 epoch. |
| In the text | |
|
Fig. B.3 Fourier coverage obtained for the 2022 epoch. |
| In the text | |
|
Fig. C.1 Final distribution of parameter values deduced from the MCMC computation for the 2021 data. The standard percentiles were used to derive the mean values and the uncertainties. |
| In the text | |
 |
Fig. C.2 Same as Fig. C.1, but for the second epoch in 2022. |
| In the text | |
Current usage metrics show cumulative count of Article Views (full-text article views including HTML views, PDF and ePub downloads, according to the available data) and Abstracts Views on Vision4Press platform.
Data correspond to usage on the plateform after 2015. The current usage metrics is available 48-96 hours after online publication and is updated daily on week days.
Initial download of the metrics may take a while.