Fig. 2
Download original image
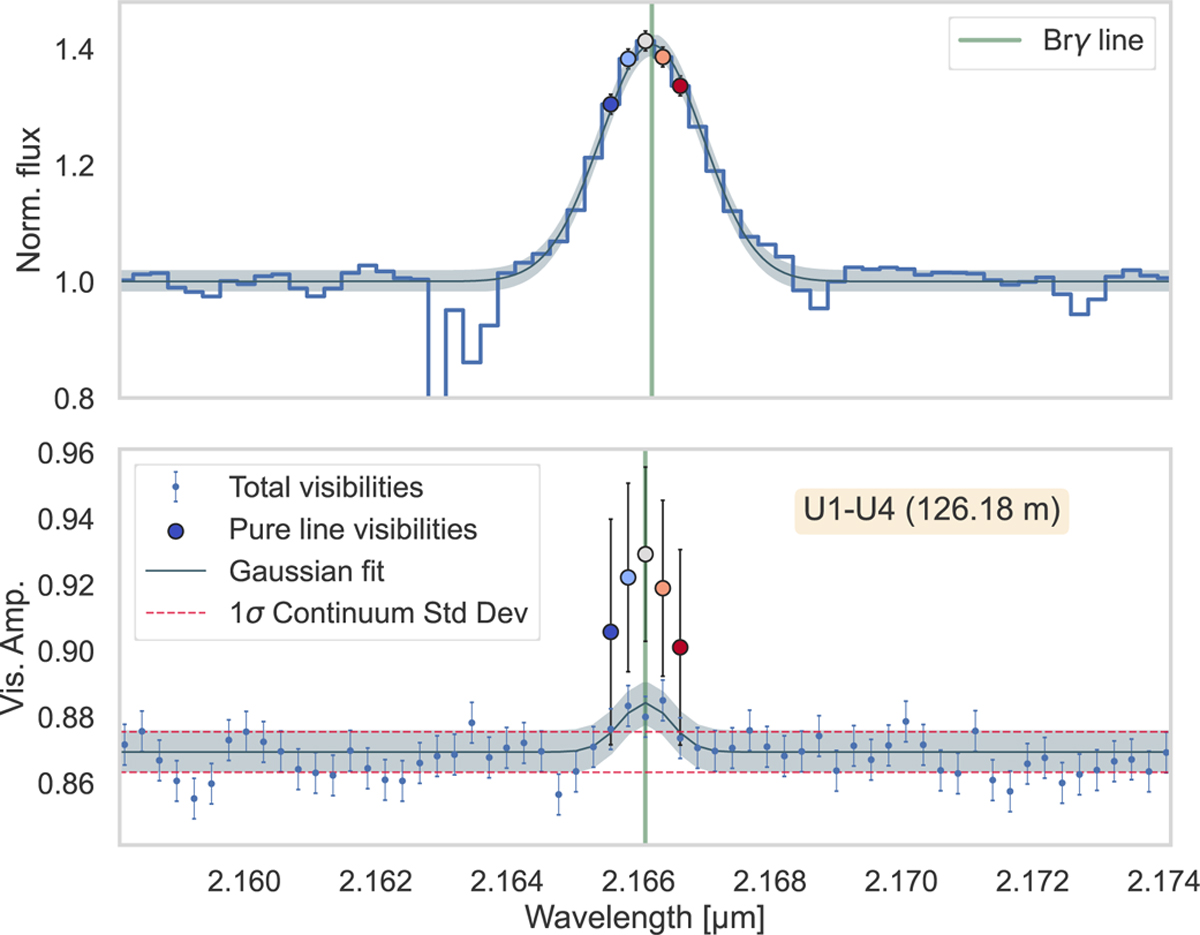
Brγ line observables. Top: normalised spectral line profile averaged over the four telescopes with GRAVITY. Bottom: differential visibilities from the UT1-UT4 baseline of the CI Tau observation in 2021. The small blue dots and error bars represent the total visibility. The larger coloured dots indicate the pure line visibilities after the subtraction of the continuum contribution (see Eq. (2)). The continuum estimate and the associated uncertainty are shown as red dashed lines. The Gaussian model used to fit the total visibility is represented as a blue line.
Current usage metrics show cumulative count of Article Views (full-text article views including HTML views, PDF and ePub downloads, according to the available data) and Abstracts Views on Vision4Press platform.
Data correspond to usage on the plateform after 2015. The current usage metrics is available 48-96 hours after online publication and is updated daily on week days.
Initial download of the metrics may take a while.