Open Access
Fig. 3
Download original image
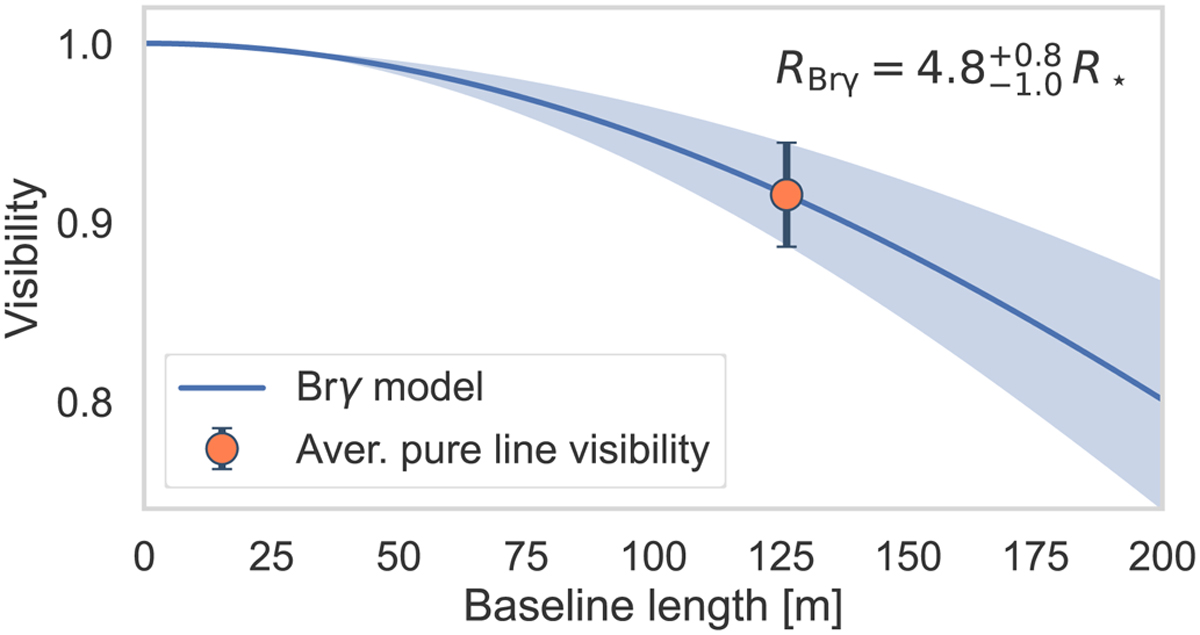
Comparison between the observed Brγ visibility (orange dot) and a visibility curve predicted for a Gaussian disk model of the emitting region (blue curve). The blue shaded area depicts the uncertainty on the size relative to the visibility error.
Current usage metrics show cumulative count of Article Views (full-text article views including HTML views, PDF and ePub downloads, according to the available data) and Abstracts Views on Vision4Press platform.
Data correspond to usage on the plateform after 2015. The current usage metrics is available 48-96 hours after online publication and is updated daily on week days.
Initial download of the metrics may take a while.