Open Access
Fig. 1
Download original image
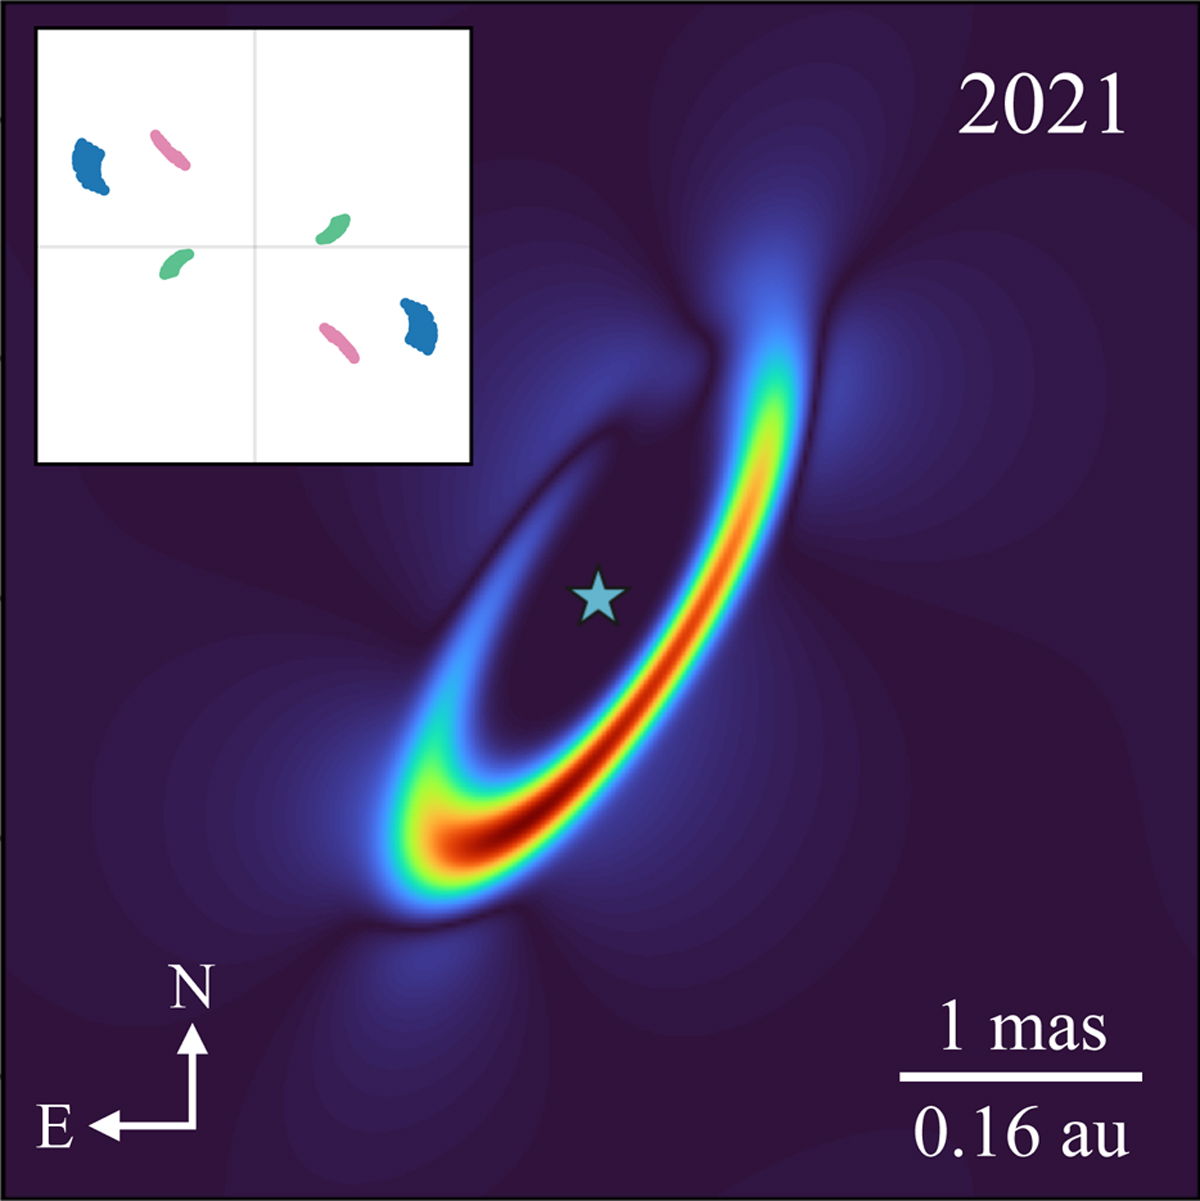
Model image of CI Tau’s inner disk in 2021. The position of the star is depicted and has been removed to show the disk structure. The upper-left inset shows the u–υ coverage. The colour circles represent the baselines: UT1–UT3 (pink), UT3–UT4 (green), and UT1–UT4 (blue).
Current usage metrics show cumulative count of Article Views (full-text article views including HTML views, PDF and ePub downloads, according to the available data) and Abstracts Views on Vision4Press platform.
Data correspond to usage on the plateform after 2015. The current usage metrics is available 48-96 hours after online publication and is updated daily on week days.
Initial download of the metrics may take a while.