| Issue |
A&A
Volume 674, June 2023
|
|
|---|---|---|
| Article Number | L5 | |
| Number of page(s) | 8 | |
| Section | Letters to the Editor | |
| DOI | https://doi.org/10.1051/0004-6361/202346271 | |
| Published online | 06 June 2023 | |
Letter to the Editor
Neutral outflows in high-z QSOs
1
Institut de Radioastronomie Millimétrique (IRAM), 300 rue de la Piscine, 38400 Saint-Martin-d’Hères, France
e-mail: This email address is being protected from spambots. You need JavaScript enabled to view it.
2
Leiden Observatory, Leiden University, PO Box 9513 2300 RA Leiden, The Netherlands
3
Sorbonne Université, UPMC Université Paris 6 and CNRS, UMR 7095, Institut d’Astrophysique de Paris, 98b boulevard Arago, 75014 Paris, France
Received:
28
February
2023
Accepted:
20
April
2023
Abstract
The OH+(11 − 10) absorption line is a powerful tracer of inflowing and outflowing gas in the predominantly atomic diffuse and turbulent halo surrounding galaxies. In this Letter, we present observations of OH+(11 − 10), CO(9-8) and the underlying dust continuum in five strongly lensed z ∼ 2 − 4 quasi-stellar objects (QSOs), using the Atacama Large Millimeter/submillimeter Array (ALMA) to detect outflowing neutral gas. Blue-shifted OH+(11 − 10) absorption is detected in three out of five QSOs and tentatively detected in a fourth. Absorption at systemic velocities is also detected in one source also displaying blue-shifted absorption. OH+(11 − 10) emission is observed in three out of five QSOs at systemic velocities and the OH+(21 − 10) transition is also detected in one source. CO(9-8) is detected in all five QSOs at high S/N, providing information on the dense molecular gas within the host galaxy. We compare our sample to high-z far-infrared (FIR) luminous star-forming and active galaxies from the literature. We find no difference in OH+ absorption line properties between active and star-forming galaxies with both samples roughly following the same optical depth-dust temperature relation. This suggests that these observables are driven by the same mechanism in both samples. Similarly, star-forming and active galaxies both follow the same OH+ emission–FIR relation. Obscured QSOs display broader (> 800 km s−1) emission than the unobscured QSOs and all but one of the high-z star-forming galaxies (likely caused by the warm molecular gas reservoir obscuring the accreting nucleus). Broader CO(9-8) emission (> 500 km s−1) is found in obscured versus unobscured QSOs, but overall they cover a similar range in line widths as the star-forming galaxies and follow the CO(9-8)–FIR luminosity relation found in low-z galaxies. We find that outflows traced by OH+ are only detected in extreme star-forming galaxies (indicated by broad CO(9-8) emission) and in both types of QSOs, which, in turn, display no red-shifted absorption. This suggests that diffuse neutral outflows in galaxy halos may be associated with the most energetic evolutionary phases leading up to and following the obscured QSO phase.
Key words: galaxies: active / galaxies: high-redshift / galaxies: starburst / quasars: general
© The Authors 2023
 Open Access article, published by EDP Sciences, under the terms of the Creative Commons Attribution License (https://creativecommons.org/licenses/by/4.0), which permits unrestricted use, distribution, and reproduction in any medium, provided the original work is properly cited.
This article is published in open access under the Subscribe to Open model. This email address is being protected from spambots. You need JavaScript enabled to view it. to support open access publication.
1. Introduction
Feedback and outflows play a key role in the evolution, regulation, and demise of galaxies throughout cosmic time. Much of the gas accreted onto dark matter halos (and, consequently, their central galaxies, where it condenses to form new stars or feed supermassive black hole growth) is ejected back out of the galaxy via the energetic mechanisms associated with these phenomena. The removal of gas regulates the fuel available for galaxy growth, as well as transporting mass and angular momentum to higher galactic radii (Governato et al. 2010), via fountain flows, or, in more powerful cases, polluting the circumgalactic and intergalactic medium with enriched gas (Travascio et al. 2020). At z ∼ 1 − 3, the star formation rate density and black hole accretion peaks in the universe (Madau & Dickinson 2014) and, as a result, feedback and outflows must do so as well.
Outflows are complex multi-phase phenomena, in which the warmer ionised phase is found to dominate the kinetic energy, whilst the cooler neutral and molecular phases dominate the mass and momentum budget of the outflow (Fluetsch et al. 2021). The cooler phases are of particular interest as they remove the direct fuel for star formation, but they have only become available for observation at high-z relatively recently with new and upgraded facilities, such as ALMA and the NOrthern Extended Millimeter Array (NOEMA).
Low-z studies have commonly made use of high-velocity line wings of bright emission lines to detect outflows (Feruglio et al. 2010), however, at high-z, detecting these weak signals from CO or [C II] becomes difficult (e.g., Fan et al. 2018; Ginolfi et al. 2020). Blue-shifted molecular absorption lines have thus become a popular and reliable way of tracing cool gas outflows both at cosmic noon (e.g., OH+:Butler et al. 2021; Riechers et al. 2021; Shao et al. 2022; CH+: Falgarone et al. 2017) and dawn (e.g., OH 119 μm: Spilker et al. 2018, 2020; Butler et al. 2023; H2O: Jones et al. 2019).
One molecule of note here is OH+, which traces the extended turbulent halo of predominantly atomic and diffuse gas surrounding galaxies (Indriolo et al. 2018). Moreover, the proximity of OH+(11 − 10) with the CO(9-8) emission line means that we can simultaneously observe the warm molecular gas, providing additional information on the physical properties within the galaxy (Berta et al. 2021; Riechers et al. 2021). Currently, observations are limited to star-forming galaxies (Butler et al. 2021, and in prep.; Riechers et al. 2021; Berta et al. 2021; Indriolo et al. 2018; Shao et al. 2022), with only a few observations achieved in active galaxies (Stanley et al. 2021; Shao et al. 2019, 2022).
In this Letter, we present OH+(11 − 10), CO(9-8), and dust continuum observations in five z ∼ 2 − 4 far-infrared (FIR) bright quasi-stellar objects (QSOs). Throughout this work, we adopt a flat ΛCDM cosmology with Ωm = 0.307 and H0 = 67.7 km s−1 Mpc−1 (Planck Collaboration XIII 2016).
2. Sample and observations
The data were obtained in the Cycle 7 ALMA project 2019.1.01802.S (P.I.: K.M. Butler), targeting five FIR-bright QSOs at z ∼ 2 − 4 (Tables 1 and 2). The five quasars were selected based on their 500 μm continuum flux densities from a sample of 104 gravitationally lensed QSOs presented in Stacey et al. (2018). The sources are listed in both the CASTLES survey (Kochanek et al. 1999) and Sloan Digital Sky Survey Quasar Lens Search catalogue (Inada et al. 2012), which have since been followed up with Herschel/SPIRE observations (Stacey et al. 2018), providing accurate estimates of their FIR–luminosities and dust temperatures (Table 2). The selected sample covers about two decades in dust temperature, of about order of magnitude in LFIR and including one quasar with a jet-dominated radio emission, MG J01414+0534 (Stacey et al. 2018).
Observed properties of the dust continuum and the OH+(11 − 10) and CO(9-8) lines.
Derived QSO host galaxy properties and values from the literature.
All sources were observed with ALMA band 7, except PSS J2322+1944, which was observed in band 5. The receivers were tuned such that two overlapping spectral windows cover the OH+(11 − 10) and CO(9-8) lines in one sideband, with the two remaining spectral windows placed in the second sideband to detect the underlying dust continuum at high S/N (Fig. A.1). No calibration issues were found and the observations were all made during good or adequate weather conditions.
The raw data were reduced using CASA (McMullin et al. 2007). The calibrated data were non-interactively imaged using a robust weighting of 0.5 and noise threshold of 1σ with the tclean routine. We did not subtract the continuum and we separated the sidebands into two cubes, leaving the frequency resolution the same as that of the receiver channels (15.624 MHz) (Table A.1).
3. Spectra and spectral fitting
We present both sidebands of the ALMA spectra for each source in Fig. A.1. The spectra were created and fitted twice: first by summing over all spaxels with an underlying dust continuum level ≥3σ, estimated from a first guess of the line-free channels. We then identified and fit the spectral components and used them to identify any spaxel containing a channel value ≥3σ within the FWHM of one or more of the CO(9-8) components. These spaxels are then included in the spatially integrated spectra and fitted a second time. We fit the spectra with a combination of Gaussian spectral components and a linear continuum slope simultaneously, leaving the central frequencies, line widths, intensities, and continuum gradient as free parameters. We used the same line parameters to describe the OH+(11 − 10) and OH+(21 − 10) transitions. The final best-fit parameters are presented in Tables 1 and B.1.
4. Results
Here, we present the best-fit parameters of the OH+ absorption, emission and CO(9-8) emission lines in our sample of strongly lensed high-z obscured (MG J0414+0534) and unobscured (HE 1104−1805, PSS J2322+1944, RX J0911+0551 and WFI J2026−4536) QSOs. We compared our results with high-z sources from the literature with comparable FIR luminosities, including obscured (W0410−0913 z = 3.592, Stanley et al. 2021) and unobscured (SDSS J231038.88+185519.7 z = 6.0031, Shao et al. 2022) QSOs, and DSFGs (HerBS-89a z = 2.95 Berta et al. 2021 and the sample of Riechers et al. 2021). The central velocity of the CO(9-8) emission (Table 1) was used as the systemic velocity when calculating the Doppler-shifted velocities of the OH+ lines.
4.1. Fitted line properties
Blue-shifted OH+ absorption is detected in three out of the five QSOs, as well as at systemic velocities in the one obscured and jetted QSO, MG J0414+0534 (Fig. A.1, Table 1). We include RX J0911+0551 as a tentative detection as it appears in both the OH+(11 − 10) and OH+(21 − 10) transitions; however, we stress that these values are uncertain. No red-shifted absorption was found, unlike some of the sources reported in Riechers et al. (2021) or in the case of HerBS-89a Berta et al. (2021). Blue-shifted velocities and linewidths are not boosted with respect to the DSFGs. The QSOs show a trend between faster outflow velocity and broader full-width half maximum (FWHM). A larger sample is needed to confirm this finding.
OH+ emission is found in three out of the five QSOs at systemic velocities, unlike in the case of the DSFGs presented in Riechers et al. (2021), which display a large spread in velocity offsets between the OH+ and CO(9-8) emission. The obscured QSO MG J0414+0534 displays the broadest OH+ emission line in the QSO sample.
Strong CO(9-8) emission is observed in all five QSOs. The two obscured QSOs (MG J0414+0534 and W0410−0913) display significantly broader CO(9-8) line widths than the unobscured QSOs. The DSFGs span a wide range of CO(9-8) line widths (Riechers et al. 2021). However, the eight sources with blue-shifted OH+ absorption all display broad (FWHM > 500 km s−1) CO(9-8) line widths, similarly to the obscured QSOs and wider than all the unobscured QSOs.
4.2. Derived line properties
From the fitted line properties, we derive integrated OH+ absorption optical depths:
 (1)
(1)
where Strans is the transmitted flux and Scont is the unobscured continuum flux level fitted at the central velocity of the line. The OH+ emission and CO(9-8) line luminosities were derived using the expressions given by Solomon et al. (1992) (Table 2).
The integrated OH+ absorption optical depths (∫τOH+, A) of the QSO sample lie at the low end of the DSFG sample (Fig. 2a), roughly following the ∫τOH+, A vs. dust temperature relation found by Riechers et al. (2021). The QSOs similarly follow the positive OH+ emission line luminosity ( )–LFIR relation set by the DSFGs. Interestingly, the scatter in this relation is greatly reduced when only considering the DSFGs with detected blue-shifted OH+ absorption.
Our sample of high-z QSOs follow the  –LFIR correlation found in low-z galaxies (Liu et al. 2015), with MG J0414+0534 falling the farthest from the relation towards lower
  ratios (Fig. 2c). Riechers et al. (2021) found that their sample of high-z DSFGs systematically deviates from this trend towards higher
  ratios, a deviation not seen in other high-z star-forming galaxies from the literature.
5. Discussion
5.1. OH+ absorption
The OH+(11 − 10) absorption line has proven to be a reliable tracer of turbulent, diffuse, and predominantly atomic gas surrounding galaxies (e.g., Indriolo et al. 2018) revealing both inflowing (Berta et al. 2021; Riechers et al. 2021) and outflowing gas moving through the CGM at high-z (Indriolo et al. 2018; Butler et al. 2021; Riechers et al. 2021; Shao et al. 2022). OH+ absorption and emission are detected at similar rates (∼75% and ∼65%, respectively) in the high-z DSFGs and QSOs samples; however, Riechers et al. (2021) reported similar numbers of red- and blue-shifted OH+ absorption in their DSFG sample, although current numbers of high-z sources showing clear evidence of infalling gas remain sparse (Berta et al. 2021; Riechers et al. 2021, and references therein). We did not find any occurrences of red-shifted absorption (Fig. 1), however, our selection of mostly Type 1 AGN systems (4/5 sources) may bias our results, as gas is more likely to infall perpendicularly to the opening of the active nucleus, where counter-acting radiation can escape most efficiently from the host galaxy (see, e.g., Shao et al. 2022). Furthermore, we cannot rule out red-shifted absorption in WFI J2026−4536, where this frequency range is not covered. Alternatively, this could be a real difference between DSFGs and QSOs, indicating that feeding from the CGM has been suppressed or halted by feedback in QSO hosts. The OH+ absorption in the QSO sample does not otherwise display faster or broader lines (Fig. 1) and approximately follows the relation in optical depth with dust temperature set by the DSFGs (Fig. 2). This suggests that the ejection of gas traced by OH+ absorption is not significantly affected by the presence of an active galactic nucleus, nor by whether the nucleus is obscured or not.
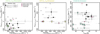 |
Fig. 1. Comparison of the line properties of OH+ and CO(9-8) between the QSO sample of this work with other high-z QSOs (Stanley et al. 2021; Shao et al. 2022) and DSFGs (Berta et al. 2021; Riechers et al. 2021) from the literature. In all panels, we colour the sources from Riechers et al. (2021) with blue-shifted OH+ absorption in black and colour the rest of the sample in grey. Left: OH+ absorption FWHM vs. velocity w.r.t. the CO(9-8) emission. Middle: OH+ emission FWHM vs. velocity w.r.t. the CO(9-8) emission. Right: dust temperature vs. CO(9-8) emission FWHM (of only the broadest CO component in each literature source). FWHMs are derived by multiplying the velocity dispersions in Table 1 by a factor of |

5.2. OH+ emission
In emission, OH+ traces environments with high electron density (e.g., Gerin et al. 2016), which can arise in the dense hot gas in both photon- and X-ray-dominated regions (PDRs, XDRs) and has thus been detected in both active (van der Werf et al. 2010; Stanley et al. 2021; Shao et al. 2022) and star-forming galaxies (Stanley et al. 2021; Riechers et al. 2021; Butler et al., in prep.).
The two obscured AGNs, MG J0414+0534 (see Fig. A.1) and W0410−0913 (Stanley et al. 2021), display very broad (> 1000 km s−1) OH+ emission, with only one source in the DSFG sample of Riechers et al. (2021) with a comparable linewidth. The remaining DSFGs and unobscured QSOs lie in similar ranges. A greater contribution from XDRs, a higher prevalence of both XDRs and PDRs or the presence of a wind component in the obscuring molecular gas reservoir directly surrounding the active nucleus in obscured QSOs may be responsible for their broader emission lines. We did not see a boost in the OH+ emission line luminosity with respect to the LFIR of any of the QSOs, instead finding good agreement with the DSFG relation. Considerable AGN contributions to the LFIR may be expected in the obscured active systems (Schneider et al. 2015; Duras et al. 2017), however, MG J0414+0534 and W0410−0913 do not display n offset towards lower  ratios. This may indicate that the central QSO is also contributing to the
  , such that the
  ratio is maintained.
5.3. CO(9-8) emission
The CO(9-8) line is predominantly excited by mechanisms associated with warm dense molecular gas in star-forming regions. AGN can contribute to the CO(9-8) emission when present but typically do not dominate until higher J transitions (e.g., Li et al. 2020).
Whilst overall the QSO and DSFG samples cover similar ranges in CO(9-8) line width, the obscured systems (MG J0414+0534 and W0410−0913 Stanley et al. 2021) show significantly broader CO(9-8) emission than the unobscured QSOs. This is in agreement with Stacey et al. (2022), who showed that red, obscured QSOs (including MG J0414+0534) display broader (≳500 km s−1) high-J CO lines than their unobscured counterparts. Comparing high-J line widths with that of bulk gas tracers (i.e., low-J CO transitions or [CI]), they show that the high-J transitions in reddened sources displayed excess flux at high velocities. They attribute this emission to molecular gas winds driven by radiation pressure trapped by the obscuring material around the active nuclei. Narrow CO(9-8) emission observed in unobscured QSOs thus indicates a phase after which the obscuring material has been ejected and radiation from the central AGN can efficiently escape.
Blue-shifted OH+ absorption is detected in QSOs displaying both broad and narrow CO(9-8) emission but only in DSFGs displaying broad CO(9-8) emission. This may simply be due to the higher S/N of the QSO spectra, thus requiring larger samples at high S/N to be confirmed. If confirmed, this may indicate that neutral outflows in galaxy halos require extreme galaxies, namely, those displaying broad CO(9-8) emission or harbouring an AGN). Following the evolutionary picture where heavily star-forming galaxies evolve into quiescent galaxies via a short-lived QSO phase (Simpson et al. 2012), blue-shifted OH+ absorption may be indicative of the energetic phases building up to an obscured QSO, and into the unobscured QSO phase (Petter et al. 2023). This is consistent with the absence of red-shifted OH+ absorption in the QSO sample. Larger samples targeting QSOs at all evolutionary stages are needed to test this hypothesis.
Riechers et al. (2021) suggest a higher prevalence of shock excitation causes the systematic deviation of their high-z DSFG sample from the low- relation. At low-z, sources categorised into Class I, II, and III in order of increasing CO excitation, showed trends of falling above, on, and both above and below the relation with greater scatter, respectively (Rosenberg et al. 2015, Fig. 2). Riechers et al. (2021) noted that their sample fall into a similar offset range as half the Class III sources located below the relation. Additionally, the highest
  ratio was found in the binary active galactic nucleus NGC 6240, believed to be driven by shock excitation (Meijerink et al. 2013). Also citing OH+ emission as an indicator of shocks, Riechers et al. (2021) suggested that shock heating drives the shift towards higher
  ratios in their sample.
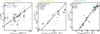 |
Fig. 2. Derived line property trends with host galaxy properties. Left: integrated OH+ optical depth vs. dust temperature. The individual absorption components of MG J0414+0534 are indicated by smaller green points. Middle: OH+ emission line luminosity vs. LFIR. Right: CO(9-8) emission line luminosity vs. LFIR. In this panel, we include the nearby star-forming galaxy sample studied by Rosenberg et al. (2015), categorised into classes of lowest (class I) to highest (class III) CO excitation. We compare our QSO sample with other high-z QSOs (W0410−0913 Stanley et al. 2021 and SDSS J2310+1955 Shao et al. 2022) and DSFGs (HerBS-89a Berta et al. 2021, the Eyelash Indriolo et al. 2018, HLock-01 Scott et al. 2011 and the sample from Riechers et al. 2021) from the literature. In all panels, we colour the sources from Riechers et al. (2021) with blue-shifted OH+ absorption in black and colour the rest of the sample in grey. |
With the presence of both intense star formation and an AGN, shocks may be expected to be even more prevalent in the high-z QSO sample, particularly in the obscured sources. MG J0414+0534, however, displays the lowest  ratio in our sample with the other high-z sources from the literature, falling tightly on the low-z relation. Furthermore, OH+ emission traces regions of high electron density (PDRs/XDRs) but not necessarily shocked gas and, in any case, the QSOs follow the same
  trend found by Riechers et al. (2021), indicating that the deviation between samples in the
  plane is unrelated.
AGN contributions to the LFIR may be expected in the QSO sample, accounting for the upwards vertical offset from the DSFG sample in Fig. 2. Considerable evidence for this is found in obscured QSOs (Duras et al. 2017; Schneider et al. 2015), however, studies of unobscured QSOs at high-z do not find evidence for significant AGN contributions (Venemans et al. 2018, 2020; Butler et al. 2023). Furthermore, this deviation is not found between our sample and the high-z DSFGs from the literature that were not studied by Riechers et al. (2021). Therefore, we suggest that the systematic deviation of the DSFGs studied by Riechers et al. (2021) towards higher  ratios is a characteristic of that sample and not representative of high-z DSFGs in general.
5.4. Spatial offsets and differential lensing
Differing spatial distributions between separate components (i.e., gas and dust) in a gravitationally lensed source will result in differential lensing. Whilst optical depth, central velocity, and line width are not impacted by gravitational lensing, the relative magnification of line and dust emission is; this leads to the shifting of sources seen in Figs. 2c,d. The S/N of our observations are not sufficient to reliably disentangle the blended emission and absorption lines on a spaxel-by-spaxel base, however, the sample’s agreement with unlensed low-z FIR scaling relations suggests that differential lensing is not substantial. Furthermore, the majority of the high-z comparison sample is strongly lensed, thus making differential lensing an unlikely cause of the offset found in the sample of Riechers et al. (2021). Therefore, we do not believe differential lensing has significantly impacted the conclusions presented below for this study.
6. Conclusions
We present ALMA observations targeting the OH+(11 − 10) and CO(9-8) transitions in five z ∼ 2 − 4 far-infrared luminous QSOs. The OH+(11 − 10) absorption and emission are seen at similar rates in star-forming and active galaxies at high-z. However, OH+ absorption is found only at systemic or blue-shifted velocities in the QSO sample, unlike in DSFGs, where red-shifted absorption has also been detected (Berta et al. 2021; Riechers et al. 2021) – although red-shifted absorption cannot be ruled out in one QSO, WFI J2026−4536. We do not find significant differences in the OH+ absorption line properties between active and star-forming samples, suggesting that the central QSO plays a minor role in the ejection of diffuse gas in the halo but may still stop or suppress inflowing gas from the CGM.
Obscured QSOs display broader OH+ emission lines compared with unobscured QSOs and DSFGs, likely due to a higher prevalence of XDRs, PDRS, or molecular winds in the obscuring reservoir. Obscured QSOs similarly display broader CO(9-8) emission than unobscured sources, likely due to massive molecular outflows typical of the blow-out phase currently underway in the obscured QSOs (Stacey et al. 2022). Despite differences found in the emission lines of the obscured vs unobscured QSOs, we find no differences in the outflow properties traced by OH+ absorption but we do note that only DSFGs with (FWHMCO(9 − 8) > 500 km s−1) CO(9-8) emission have blue-shifted OH+ absorption detected. This may indicate that diffuse, neutral outflows in the CGM are driven by the most extreme sources (i.e., AGNs or displaying broad emission lines). We therefore suggest that blue-shifted OH+ absorption may be indicative of the energetic phases leading up to the obscured QSO phase and into the unobscured phase where infalling gas has been halted (red-shifted absorption).
Acknowledgments
The authors would like the thank the anonymous referee for their suggestions that helped improve this Letter. This paper makes use of the following ALMA data: ADS/JAO.ALMA#2019.1.01802.S. ALMA is a partnership of ESO (representing its member states), NSF (USA) and NINS (Japan), together with NRC (Canada), MOST and ASIAA (Taiwan), and KASI (Republic of Korea), in cooperation with the Republic of Chile. The Joint ALMA Observatory is operated by ESO, AUI/NRAO and NAOJ. This work benefited from the support of the project Z-GAL ANR-AAPG2019 of the French National Research Agency (ANR).
References
- Berta, S., Young, A. J., Cox, P., et al. 2021, A&A, 646, A122 [CrossRef] [EDP Sciences] [Google Scholar]
- Butler, K. M., van der Werf, P. P., Rybak, M., et al. 2021, ApJ, 919, 5 [NASA ADS] [CrossRef] [Google Scholar]
- Butler, K. M., van der Werf, P. P., Topkaras, T., et al. 2023, ApJ, 944, 134 [NASA ADS] [CrossRef] [Google Scholar]
- Duras, F., Bongiorno, A., Piconcelli, E., et al. 2017, A&A, 604, A67 [NASA ADS] [CrossRef] [EDP Sciences] [Google Scholar]
- Falgarone, E., Zwaan, M. A., Godard, B., et al. 2017, Nature, 548, 430 [NASA ADS] [CrossRef] [Google Scholar]
- Fan, L., Knudsen, K. K., Fogasy, J., & Drouart, G. 2018, ApJ, 856, L5 [Google Scholar]
- Feruglio, C., Maiolino, R., Piconcelli, E., et al. 2010, A&A, 518, L155 [NASA ADS] [CrossRef] [EDP Sciences] [Google Scholar]
- Fluetsch, A., Maiolino, R., Carniani, S., et al. 2021, MNRAS, 505, 5753 [NASA ADS] [CrossRef] [Google Scholar]
- Gerin, M., Neufeld, D. A., & Goicoechea, J. R. 2016, ARA&A, 54, 181 [NASA ADS] [CrossRef] [Google Scholar]
- Ginolfi, M., Jones, G. C., Béthermin, M., et al. 2020, A&A, 633, A90 [NASA ADS] [CrossRef] [EDP Sciences] [Google Scholar]
- Governato, F., Brook, C., Mayer, L., et al. 2010, Nature, 463, 203 [NASA ADS] [CrossRef] [Google Scholar]
- Inada, N., Oguri, M., Shin, M.-S., et al. 2012, AJ, 143, 119 [Google Scholar]
- Indriolo, N., Bergin, E. A., Falgarone, E., et al. 2018, ApJ, 865, 127 [NASA ADS] [CrossRef] [Google Scholar]
- Jones, G. C., Maiolino, R., Caselli, P., & Carniani, S. 2019, A&A, 632, L7 [NASA ADS] [CrossRef] [EDP Sciences] [Google Scholar]
- Kochanek, C. S., Falco, E. E., Impey, C. D., et al. 1999, in After the Dark Ages: When Galaxies were Young (the Universe at 2 < Z < 5), eds. S. Holt, & E. Smith, AIP Conf. Ser., 470, 163 [Google Scholar]
- Li, J., Wang, R., Riechers, D., et al. 2020, ApJ, 889, 162 [NASA ADS] [CrossRef] [Google Scholar]
- Liu, D., Gao, Y., Isaak, K., et al. 2015, ApJ, 810, L14 [NASA ADS] [CrossRef] [Google Scholar]
- Madau, P., & Dickinson, M. 2014, ARA&A, 52, 415 [Google Scholar]
- McMullin, J. P., Waters, B., Schiebel, D., Young, W., & Golap, K. 2007, in Astronomical Data Analysis Software and Systems XVI, eds. R. A. Shaw, F. Hill, & D. J. Bell, ASP Conf. Ser., 376, 127 [Google Scholar]
- Meijerink, R., Kristensen, L. E., Weiß, A., et al. 2013, ApJ, 762, L16 [Google Scholar]
- Petter, G. C., Hickox, R. C., Alexander, D. M., et al. 2023, ApJ, 946, 27 [NASA ADS] [CrossRef] [Google Scholar]
- Planck Collaboration XIII 2016, A&A, 594, A13 [NASA ADS] [CrossRef] [EDP Sciences] [Google Scholar]
- Riechers, D. A., Cooray, A., Pérez-Fournon, I., & Neri, R. 2021, ApJ, 913, 141 [NASA ADS] [CrossRef] [Google Scholar]
- Rosenberg, M. J. F., van der Werf, P. P., Aalto, S., et al. 2015, ApJ, 801, 72 [Google Scholar]
- Schneider, R., Bianchi, S., Valiante, R., Risaliti, G., & Salvadori, S. 2015, A&A, 579, A60 [NASA ADS] [CrossRef] [EDP Sciences] [Google Scholar]
- Scott, K. S., Lupu, R. E., Aguirre, J. E., et al. 2011, ApJ, 733, 29 [NASA ADS] [CrossRef] [Google Scholar]
- Shao, Y., Wang, R., Carilli, C. L., et al. 2019, ApJ, 876, 99 [NASA ADS] [CrossRef] [Google Scholar]
- Shao, Y., Wang, R., Weiss, A., et al. 2022, A&A, 668, A121 [NASA ADS] [CrossRef] [EDP Sciences] [Google Scholar]
- Simpson, J. M., Smail, I., Swinbank, A. M., et al. 2012, MNRAS, 426, 3201 [Google Scholar]
- Solomon, P. M., Downes, D., & Radford, S. J. E. 1992, ApJ, 398, L29 [Google Scholar]
- Spilker, J. S., Aravena, M., Béthermin, M., et al. 2018, Science, 361, 1016 [NASA ADS] [CrossRef] [Google Scholar]
- Spilker, J. S., Aravena, M., Phadke, K. A., et al. 2020, ApJ, 905, 86 [Google Scholar]
- Stacey, H. R., McKean, J. P., Robertson, N. C., et al. 2018, MNRAS, 476, 5075 [NASA ADS] [CrossRef] [Google Scholar]
- Stacey, H. R., McKean, J. P., Powell, D. M., et al. 2021, MNRAS, 500, 3667 [Google Scholar]
- Stacey, H. R., Costa, T., McKean, J. P., et al. 2022, MNRAS, 517, 3377 [NASA ADS] [CrossRef] [Google Scholar]
- Stanley, F., Knudsen, K. K., Aalto, S., et al. 2021, A&A, 646, A178 [NASA ADS] [CrossRef] [EDP Sciences] [Google Scholar]
- Travascio, A., Zappacosta, L., Cantalupo, S., et al. 2020, A&A, 635, A157 [NASA ADS] [CrossRef] [EDP Sciences] [Google Scholar]
- van der Werf, P. P., Isaak, K. G., Meijerink, R., et al. 2010, A&A, 518, L42 [NASA ADS] [CrossRef] [EDP Sciences] [Google Scholar]
- Venemans, B. P., Decarli, R., Walter, F., et al. 2018, ApJ, 866, 159 [Google Scholar]
- Venemans, B. P., Walter, F., Neeleman, M., et al. 2020, ApJ, 904, 130 [Google Scholar]
Appendix A: ALMA Observation Details
Here, we provide details of the ALMA observations in A.1 and data products in Fig. A.1.
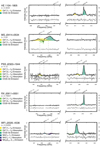 |
Fig. A.1. Spatially integrated spectra, fits and residuals of the 5 QSOs. Observed frequencies are displayed on the horizontal axis and the expected redshifted rest frequencies of the spectral lines, using the redshifts in Table 2, are indicated by vertical dashed lines. |
ALMA observations
Appendix B: Additional lines in WFI J2026-4536
We present the fitted and derived values of the spectral fits to the tentative detections of NH and NH2 in WFI J2026-4536 in Table B.1. The tentaive NH(10 − 11) absorption and NH2(22, 0 − 21, 1) emission lines are blended, resulting in poorly constrained best-fit parameters for these lines. Flux, velocity, and velocity dispersion are all left as free parameters in the fitting of the three lines.
Observed and derived line properties of NH and NH2
All Tables
Observed properties of the dust continuum and the OH+(11 − 10) and CO(9-8) lines.
All Figures
|
Fig. 1. Comparison of the line properties of OH+ and CO(9-8) between the QSO sample of this work with other high-z QSOs (Stanley et al. 2021; Shao et al. 2022) and DSFGs (Berta et al. 2021; Riechers et al. 2021) from the literature. In all panels, we colour the sources from Riechers et al. (2021) with blue-shifted OH+ absorption in black and colour the rest of the sample in grey. Left: OH+ absorption FWHM vs. velocity w.r.t. the CO(9-8) emission. Middle: OH+ emission FWHM vs. velocity w.r.t. the CO(9-8) emission. Right: dust temperature vs. CO(9-8) emission FWHM (of only the broadest CO component in each literature source). FWHMs are derived by multiplying the velocity dispersions in Table 1 by a factor of |
| In the text | |
|
Fig. 2. Derived line property trends with host galaxy properties. Left: integrated OH+ optical depth vs. dust temperature. The individual absorption components of MG J0414+0534 are indicated by smaller green points. Middle: OH+ emission line luminosity vs. LFIR. Right: CO(9-8) emission line luminosity vs. LFIR. In this panel, we include the nearby star-forming galaxy sample studied by Rosenberg et al. (2015), categorised into classes of lowest (class I) to highest (class III) CO excitation. We compare our QSO sample with other high-z QSOs (W0410−0913 Stanley et al. 2021 and SDSS J2310+1955 Shao et al. 2022) and DSFGs (HerBS-89a Berta et al. 2021, the Eyelash Indriolo et al. 2018, HLock-01 Scott et al. 2011 and the sample from Riechers et al. 2021) from the literature. In all panels, we colour the sources from Riechers et al. (2021) with blue-shifted OH+ absorption in black and colour the rest of the sample in grey. |
| In the text | |
|
Fig. A.1. Spatially integrated spectra, fits and residuals of the 5 QSOs. Observed frequencies are displayed on the horizontal axis and the expected redshifted rest frequencies of the spectral lines, using the redshifts in Table 2, are indicated by vertical dashed lines. |
| In the text | |
Current usage metrics show cumulative count of Article Views (full-text article views including HTML views, PDF and ePub downloads, according to the available data) and Abstracts Views on Vision4Press platform.
Data correspond to usage on the plateform after 2015. The current usage metrics is available 48-96 hours after online publication and is updated daily on week days.
Initial download of the metrics may take a while.