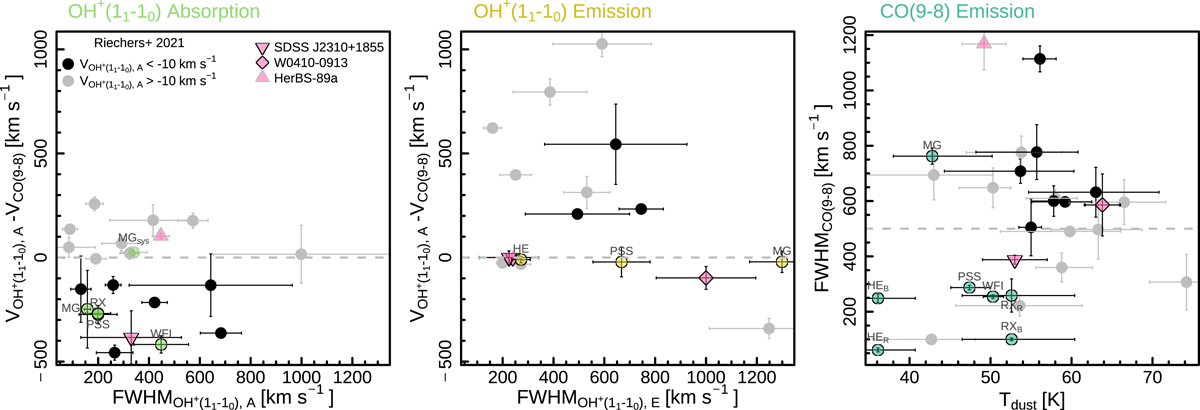
Fig. 1.
Download original image
Comparison of the line properties of OH+ and CO(9-8) between the QSO sample of this work with other high-z QSOs (Stanley et al. 2021; Shao et al. 2022) and DSFGs (Berta et al. 2021; Riechers et al. 2021) from the literature. In all panels, we colour the sources from Riechers et al. (2021) with blue-shifted OH+ absorption in black and colour the rest of the sample in grey. Left: OH+ absorption FWHM vs. velocity w.r.t. the CO(9-8) emission. Middle: OH+ emission FWHM vs. velocity w.r.t. the CO(9-8) emission. Right: dust temperature vs. CO(9-8) emission FWHM (of only the broadest CO component in each literature source). FWHMs are derived by multiplying the velocity dispersions in Table 1 by a factor of ![]() .
.
Current usage metrics show cumulative count of Article Views (full-text article views including HTML views, PDF and ePub downloads, according to the available data) and Abstracts Views on Vision4Press platform.
Data correspond to usage on the plateform after 2015. The current usage metrics is available 48-96 hours after online publication and is updated daily on week days.
Initial download of the metrics may take a while.