| Issue |
A&A
Volume 674, June 2023
|
|
|---|---|---|
| Article Number | A202 | |
| Number of page(s) | 12 | |
| Section | Interstellar and circumstellar matter | |
| DOI | https://doi.org/10.1051/0004-6361/202245032 | |
| Published online | 23 June 2023 | |
The Effelsberg survey of FU Orionis and EX Lupi objects
II. H2O maser observations★
1
Max-Planck-Institut für Radioastronomie,
Auf dem Hügel 69,
53121
Bonn, Germany
e-mail: This email address is being protected from spambots. You need JavaScript enabled to view it.
2
Scottish Universities Physics Alliance (SUPA), School of Physics and Astronomy, University of St Andrews,
North Haugh,
St Andrews
KY16 9SS, UK
3
Konkoly Observatory, Research Centre for Astronomy and Earth Sciences, Eötvös Loránd Research Network (ELKH),
Konkoly-Thege Miklós út 15–17,
1121
Budapest, Hungary
4
CSFK, MTA Centre of Excellence, Budapest,
Konkoly Thege Miklós út 15–17,
1121
Hungary
5
INAF - Osservatorio Astrofisico di Arcetri,
Largo E. Fermi 5,
50125
Firenze, Italy
6
ELTE Eötvös Loránd University, Institute of Physics,
Pázmány Péter sétány 1/A,
1117
Budapest, Hungary
7
Max-Planck-Institut für Astronomie,
Königstuhl 17,
69117
Heidelberg, Germany
Received:
21
September
2022
Accepted:
28
April
2023
Abstract
Context. FU Orionis (FUor) and EX Lupi (EXor) type objects are two groups of peculiar and rare pre-main sequence low-mass stars that are undergoing powerful accretion outbursts during their early stellar evolution. Although water masers are widespread in star-forming regions and serve as powerful probes of mass accretion and ejection on small scales, little is known about the prevalence of water masers toward FUors and EXors.
Aims. We aim to perform the first systematic search for the 22.2 GHz water maser line in FUors and EXors in order to determine its overall incidence in these eruptive variables and to facilitate high angular-resolution follow-up observations.
Methods. We used the Effelsberg 100-m radio telescope to observe the H2O (616 – 523) transition at 22.2GHz toward a sample of 51 eruptive young stellar objects.
Results. We detected a total of five water masers in our survey; three are associated with eruptive stars, equivalent to a detection rate of ~6% for our sample of eruptive sources. These detections include one EXor, V512 Per (also known as SVS 13 or SVS 13A), and two FUors, Z CMa, and HH 354 IRS. This is the first reported detection of water maser emission towards HH 354 IRS. We also detected water maser emission in our pointing towards the FUor binary RNO 1B/1C, which most likely originates from the nearby deeply embedded source IRAS 00338+6312 (~4″ from RNO 1B/1C). Emission was also detected from H2O(B), (also known as SVS 13C), a Class 0 source ~30″ from the EXor V512 Per. The peak flux density of H2O(B) in our observations, 498.7 Jy, is the highest observed to date, indicating that we have serendipitously detected a water maser flare in this source. In addition to the two non-eruptive Class 0 sources (IRAS 00338+6312 and H2O(B)/SVS 13C), we detected maser emission towards one Class 0/I (HH 354 IRS) and two Class I (V512 Per/SVS 13A and Z CMa) eruptive stars.
Conclusions. Despite the low detection rate, we demonstrate the presence of 22.2 GHz water maser emission in both FUor and EXor systems, paving the way to radio interferometric observations to study the environments of these eruptive stars on small scales. Comparisons of our data with historical observations spanning several decades suggest that multiple water maser flares have occurred in both V512 Per and H2O(B).
Key words: stars: pre-main sequence / stars: low-mass / stars: formation / masers
The data behind the figures are available at https://zenodo.org/record/7898867
Member of the International Max Planck Research School (IMPRS) for Astronomy and Astrophysics at the Universities of Bonn and Cologne.
© The Authors 2023
 Open Access article, published by EDP Sciences, under the terms of the Creative Commons Attribution License (https://creativecommons.org/licenses/by/4.0), which permits unrestricted use, distribution, and reproduction in any medium, provided the original work is properly cited.
This article is published in open access under the Subscribe to Open model.
Open Access funding provided by Max Planck Society.
1 Introduction
Low-mass young stellar objects (YSOs) are stars in the early stages of stellar evolution, specifically, protostars and pre-main sequence (PMS) stars, which can undergo accretion-driven episodic outbursts. Studies of outbursting objects provide crucial information on the formation and the evolution of Sun-like stars. Amongst PMS stars, there are two small, but rather spectacular classes of outbursting low-mass YSOs: FU Orionis and EX Lupi-type stars (FUors and EXors, respectively). Members of both classes show major increases in their optical and near-infrared (NIR) brightnesses. FUors can brighten by up to 5-6 magnitudes in the optical, triggered by enhanced accretion from the accretion disk onto the protostar (Herbig 1989; Hartmann & Kenyon 1996). This phase can last for several decades, or even centuries (e.g. the recent review by Fischer et al. 2022, and references therein). For example, the prototype of the FUor class, FU Orionis, went into outburst in 1936 (Wachmann 1954) and it remains in a highly active state. After a few other objects were observed to experience similar outbursts, Herbig (1977) defined the FUor class, which continues to increase in size as new FUor-type objects are identified (e.g. Audard et al. 2014; Szegedi-Elek et al. 2020) and currently contains more than a dozen objects. The EXor class was defined by Herbig (1989), based on the properties of the prototype star EX Lupi, and currently also includes more than a dozen objects (e.g. Audard et al. 2014; Park et al. 2022). EXors can brighten by up to 1-5 magnitudes in the optical and remain in a bright state for a few months or a few years (see e.g. Jurdana-Šepić et al. 2018). Furthermore, their outbursts are known to be recurring (e.g. Audard et al. 2014; Cruz-Sáenz de Miera et al. 2022).
Interstellar masers are powerful tools for studying the physics of star formation on small scales, frequently probing regions of enhanced density and temperature (e.g. Elitzur 1992; Reid & Honma 2014). Masers have been widely used to probe both low- and high-mass star formation regions (e.g. Abraham et al. 1981; Omodaka et al. 1999; Furuya et al. 2001, Furuya et al. 2003; Hirota et al. 2011), yet there is sparse information available on masers in FUors or EXors. Pioneering studies have found compact maser emission in the 1720 MHz hyperfine structure line of hydroxyl (OH) toward the archetypal FUor V1057 Cyg (Lo & Bechis 1973). This emission, which comes from the immediate vicinity of the star (Lo & Bechis 1974) and is highly time-variable (Winnberg et al. 1981), is unique in the literature. The 22.2 GHz transition of water (H2O) is the most widespread interstellar maser (see, e.g. Gray 2012, and references therein). It has been detected towards numerous low- to high-mass star-forming regions in the Milky Way (see e.g. Ladeyschikov et al. 2022). Pumping models indicate that 22.2 GHz water masers are excited at elevated temperatures (∼500 K) and densities (108–9 cm−3), which are typically found in the compressed post-shock regions of jets and outflows from YSOs (Elitzur et al. 1989; Elitzur & Fuqua 1989; Gray 2012; Gray et al. 2022). With very-long-baseline interferometry (VLBI), multi-epoch observations of water masers associated with protostellar outflows can be used to study mass accretion and ejection (see e.g. Burns et al. 2016; Moscadelli et al. 2019). This suggests that water masers could potentially serve as valuable probes of mass accretion and ejection in FUors and EXors.
Despite the fact that water masers are closely associated with mass accretion and ejection in protostars, a systematic search for 22.2 GHz H2O masers in FUors/EXors has not yet been performed. Hence, the overall incidence of 22.2 GHz water masers in these classes of eruptive objects is unknown. In this paper, we present the first dedicated 22.2 GHz water maser survey of low-mass young eruptive stars, using the Effelsberg 100-m telescope. Our single-dish survey is a first step in investigating water masers in low-mass outbursting systems, aimed at investigating the existence and prevalence of water masers in these objects and identifying targets for follow-up interferometric observations. This work is the second in a series (the first being Szabó et al. 2023) presenting radio and (sub)millimeter observations of FUors and EXors and their natal environments. The paper organized as follows. In Sect. 2, we summarise our observations. In Sect. 3, we present our results, focusing on sources with water maser detections. In Sect. 4, we discuss our results. In Sect. 5, we provide a summary of our most important findings.
2 Observations
The H2O  transition (rest frequency 22235.0798 MHz, from the JPL Molecular Spectroscopy database1, Pickett et al. 1998) was observed simultaneously with the three lowest metastable NH3 transitions ((J, K) = (1, 1), (2, 2) and (3, 3)), presented in Szabó et al. 2023 (Paper I).
The observations were carried out on 2021 November 18, November 23, and 2022 January 25 using the Effelsberg 100-m telescope in Germany2 (project id: 95–21, PI: Szabó). The sample consisted of 51 sources: 33 FUors, 13 EXors, and 5 Gaia alerts. Gaia alert sources were chosen from the variable sources identified by the Gaia Photometric Science Alerts system (Hodgkin et al. 2021) based on light curve characteristics and luminosities similar to those of FUors and EXors. Five Gaia alert sources in our sample are yet to be classified; there is only one source, Gaia18dvy, listed with its Gaia alert name (Table B.1), but counted as a FUor based on its classification by Szegedi-Elek et al. (2020).
Our observations were performed in position-switching mode with an off-position at an offset of 5′ east of our targets in azimuth. During our observations, the 1.3 cm double beam and dual polarization secondary focus receiver was employed as the frontend, while the fast Fourier transform spectrometers (FFTSs) were used as the backend. Each FFTS provides a bandwidth of 300 MHz and 65536 channels, which gives a channel width of 4.6 kHz, corresponding to a velocity spacing of 0.06 km s−1 at 22.2 GHz. The actual spectral resolution is coarser by a factor of 1.16 (Klein et al. 2012).
At the beginning of each observing session, pointing and focus were verified towards NGC 7027. On 2021 November 18 we also targeted W75N, known for its H2O and NH3 emission, to make sure that the system was working properly (see Appendix A). Pointing was regularly checked on nearby continuum sources and was found to be accurate to about 5″. NGC 7027 was also used as our flux calibrator, assuming a flux density of ∼5.6 Jy at 22.2 GHz (Ott et al. 1994). The on-source integration time was 2.5 min per spectrum, and during each observing epoch, four spectra per source were obtained.
The majority of our sources were observed on 2021 November 18 and 23, and we detected H2O maser emission toward V512 Per (SVS 13A), RNO 1B/1C, and HH 354 IRS on November 18 (see Tables 1, 2 and B.1). On 2021 November 18, we detected H2O maser emission toward V512 Per (SVS 13A), RNO 1B/1C, and HH 354 IRS. To study the time variability of the maser emission, we re-observed detected sources in as many subsequent epochs as possible (see Table 2), within the constraints of our allocated observing sessions. For Z CMa, which was known to have water maser emission (Moscadelli et al. 2006) but could not be observed in November 2021 due to time constraints, we searched for short-term maser variability by observing this source for two 4×2.5min blocks separated by 2.5 h in January 2022. No variability was detected on this timescale, so all eight spectra of Z CMa were averaged for the subsequent analysis. We note that due to the weak detection of the water maser in HH 354 IRS, the spectrum was spectrally smoothed by a factor of 2 using the smooth built-in function in CLASS. The smoothed spectrum is presented throughout this paper. Having detected unusually high-amplitude (factor of -4 with respect to the previous observation) and rapid variability in the H2O maser spectra towards V512 Per (SVS 13A; see Sect. 3.2), we also carried out nine-point observations and 1′×1′ on-the-fly (OTF) mapping of this source on 2022 February 5 to investigate whether emission from nearby sources in the telescope sidelobes could be contributing to the observed emission. Consequently, we serendipitously detected strong water maser emission toward H2O(B) (SVS 13C), which is 30″ from V512 Per (SVS 13A; see Sects. 3.2 and 3.3.1). We also performed single-pointing observations towards H2O(B) during this epoch.
We adopted the method introduced by Winkel et al. (2012) for our spectral calibration which resulted in a calibration uncertainty of about 15%. The half-power beam width (HPBW) was about 40″ at 22 GHz and the main beam efficiency was 60.2% at 22 GHz. The conversion factor from flux density, Sν, to main beam brightness temperature, Tmb, was Tmb/Sν = 1.73 KJy−1. Typical RMS noise levels for the observations of detected sources are given in Table 2 and the 3σ upper limits for non-detections are given in Table B.1.
The data were reduced using the GILDAS/CLASS package developed by the Institut de Radioastronomie Millimétrique (IRAM3; Pety 2005; Gildas Team 2013). For each target, spectra observed on the same day were averaged to improve the signal-to-noise ratio prior to subtracting a linear baseline. Velocities are presented with respect to the local standard of rest (LSR) throughout this paper.
Basic information about the sources towards which water maser emission was detected at 22.2 GHz.
3 Results
Of our 51 targets, we detected >3σ water maser emission towards two FUors (Z CMa and HH 354 IRS) and one EXor (V512 Per/SVS 13A), corresponding to a detection rate of ~6% towards eruptive stars. We also serendipitously detected water maser emission towards two non-eruptive embedded protostars (discussed in Sects. 3.3.1 and 3.3.2). The basic parameters of sources with maser detections, including types, coordinates, distances, and evolutionary classifications are listed in Table 1. Altogether, we detected water masers in two non-eruptive Class 0 sources (IRAS 00338+6312 and H2O(B)/SVS 13C) and in one Class 0/I (HH 354 IRS) and two Class I (V512 Per/SVS 13A and Z CMa) eruptive objects, using the standard classification scheme (see e.g. Greene et al. 1994; Evans et al. 2009).
For sources with water maser detections, we fit each velocity component with a Gaussian to obtain its LSR velocity (υLSR), line width (Δυ), and peak flux density (S ν), which are given in Table 2. The peak flux densities of detected water masers vary from 0.11 Jy to 498.7 Jy, spanning over three orders of magnitude. The observed maser velocities are within 10 km s−1 of the systemic cloud velocities measured from NH3 emission. While shock velocities of ≳50 km s−1 are expected in theoretical models (e.g. Elitzur et al. 1989), the modest velocity offsets between water masers and dense gas observed in our sample are generally consistent with observations of water masers towards highmass YSOs (e.g. Urquhart et al. 2009; Cyganowski et al. 2013, Figs. 4 and 16, respectively). Isotropic H2O maser luminosities,  were calculated as (e.g. Anglada et al. 1996; Urquhart et al. 2011; Cyganowski et al. 2013):
![Mathematical equation: $\left[ {{{{L_{{{\rm{H}}_2}{\rm{O}}}}} \over {{L_ \odot }}}} \right] = 2.3 \times {10^{ - 8}}\left[ {{{\int {{S_v}{\rm{d}}\upsilon } } \over {{\rm{Jy}}\,{\rm{km}}\,{{\rm{s}}^{ - {\rm{1}}}}}}} \right]\,{\left[ {{D \over {{\rm{kpc}}}}} \right]^2},$](/articles/aa/full_html/2023/06/aa45032-22/aa45032-22-eq3.png) (1)
(1)
where D is the distance to the target (see Table 1). Estimating the isotropic H2O maser luminosities of individual velocity components separately, we find a range of  of 7.9×1О−10 L⊙ to 6.1 × 10⁻⁷ L⊙ (see Table 2).
In the following subsections, we discuss our results for sources with detected water masers. Our non-detections are presented in Appendix B, where Table B.1 lists the targeted sources along with their types, coordinates, 3σ upper limits, whether they were previously searched to find their 22.2 GHz maser emission, and, if so: the reference, the date of observation in the current survey, their classification and reference, and distances. For 31 sources in our sample, no previous observations of the 22.2 GHz water maser line have been reported in the literature.
3.1 FUors
3.1.1 Z CMa
Z CMa consists of an FUor (southwest component) and a Herbig Ae/Be star (northeast component) that are only 0.1″ apart (Koresko et al. 1991; Bonnefoy et al. 2017). Figure 1 shows the H2O maser spectrum observed toward Z CMa, the only source among those detected observed at only one epoch (Sect. 2). As shown in Fig. 1, there is only one bright maser feature, at υLSR = 7.82 km s−1, blueshifted by ~6 km s−1 with respect to the thermal NH3 emission. Although Z CMa has been observed in many previous water maser studies (Blitz & Lada 1979; Thum et al. 1981; Deguchi et al. 1989; Scappini et al. 1991; Palla & Prusti 1993; Moscadelli et al. 2006; Sunada et al. 2007; Bae et al. 2011; Kim et al. 2018), maser emission was detected only on 2003 March 14 (Moscadelli et al. 2006), with a flux density of ~2Jy at υLSR = 14.3 km s−1. The maser component at υLSR = 7.82 km s−1 is reported here for the first time.
3.1.2 HH 354 1RS
HH 354 IRS, also known as IRAS 22051+5848 and L1165-SMM1 (e.g. Visser et al. 2002), was classified as a FUor based on its CO first-overtone bandhead feature at ~2.3 µm (Reipurth & Aspin 1997; Connelley & Reipurth 2018). This FUor was searched for H2O maser emission multiple times between 1985 and 2005 (Wouterloot et al. 1993; Persi et al. 1994; Sunada et al. 2007), but no maser emission was reported.
As shown in Fig. 2, we detected weak H2O maser emission (peak flux densities <0.2Jy, Table 2) towards HH 354 IRS in two epochs. These are the first detections of water maser emission towards this source. On 2021 November 18, we detected a weak H2O maser at υLSR = 1.18 km s−1. On 2022 January 25 we detected two features at υLSR = −10.51 and υLSR = 5.04 km s−1 but the 1.18 km s−1 feature had disappeared. This variability is consistent with the findings of Claussen et al. (1996), namely, that water maser features associated with low-mass YSOs can have lifetimes of ≲2 months.
Properties of observed water maser features.
3.2 EXors – V512 Per (SVS 13A)
Located in the low-mass star-forming region NGC 1333, the source V512 Per (commonly known as SVS 13 or SVS 13A, e.g. Plunkett et al. 2013) has been the subject of extensive multiwavelength studies, resulting in a complex nomenclature. The source was discovered during an infrared survey (SVS76 NGC 1333 13A; Strom et al. 1976). An optical outburst was detected in the late 1980’s (Mauron & Thouvenot 1991) and observations by Eisloeffel et al. (1991) confirmed it showed EXor properties. The variable name V512 Per was assigned in the 71st Name-List of Variable Stars by Kazarovets et al. (1993), who noted SVS 13 and V512 Per were the same source. A radio counterpart of the optical/near-infrared source, named VLA 4, was first detected by Rodríguez et al. (1997) and later resolved into a binary (VLA 4A and 4B; Anglada et al. 2000). Rodríguez et al. (2002) noted that SVS 13 (therefore V512 Per) and VLA 4 are the same source, which is consistent with other studies (see, e.g. Goodrich 1986; Fujiyoshi et al. 2015). The source is also commonly known as SVS 13A (see, e.g. Plunkett et al. 2013, and references therein) and is associated with several Herbig/Haro objects (HH 7–11; e.g. Rodríguez et al. 1997; Bachiller et al. 2000). In this paper, we refer to the source as V512 Per, noting that this name might be more familiar to the variable star community (e.g. Kazarovets et al. 1993; Audard et al. 2014), while SVS 13, VLA 4, or SVS 13A may be more familiar to the radio astronomy community (e.g. Rodríguez et al. 2002; Plunkett et al. 2013).
Figure 3 shows the spectra obtained towards V512 Per in 2021 November. On 2021 November 18, we detected at least six maser features towards V512 Per (see Fig. 3), with the brightest one being 20.2 Jy. Here we note that only five of them are shown in Table 2, since the additional feature on the main component at 6.31 km s−1 cannot result in a reliable Gaussian fit. Five days later, two velocity features, at 6.3 km s−1 and 8.4 km s−1, had increased in flux density by factors of ~3 and ~4, respectively. Previous H2O maser observations of the V512 Per region revealed three maser positions, H2O(A), H2O(B), and H2O(C), (Haschick et al. 1980). H2О(А) is associated with V512 Per. H2О(В), also known as HH 7–11(B), VLA 2, SVS 13C, or MMS3, is a Class 0 source located ~0.5′, to the southwest (Cesaroni et al. 1988; Chen et al. 2013; Plunkett et al. 2013; Segura-Сох et al. 2018), while H2О(C) is ~2.5′ southeast of V512 Per (Haschick et al. 1980).
To investigate which of the observed velocity components may be associated with V512 Per, we carried out a nine-point grid of observations centred on V512 Per on 2022 February 5 (with pointings separated by 20″)· The results indicate that the strong water maser features at 5-10 km s−1 are brightest at an offset position (−20″,−20″), rather than toward V512 Per (0″,0″), suggesting that these maser features do not arise mainly from V512 Per. The ~ 12 km s−1 component, in contrast, is strongest towards V512 Per and is likely associated with the eruptive source (Fig. 4, see also Fig. 5).
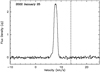 |
Fig. 1 H2O maser spectrum of Ζ CMa observed on 2022 January 25. The dashed vertical line indicates the υLSR of 13.8 km s−1 from the NH3 (1,1) transition (Szabó et al. 2023). |
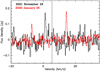 |
Fig. 2 Spectrally smoothed line profile of H2O maser emission observed in HH 354 1RS on 2021 November 18 and 2022 January 25. The dashed vertical line indicates the average υLSR of −1.47 km s−1 derived from the NH3 (1,1) and (2,2) transitions (Szabó et al. 2023). |
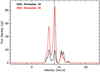 |
Fig. 3 H2O maser spectra toward V512 Per in November 2021: the two epochs are indicated at upper left. The dashed line indicates the average υLSR of 8.39 km s−1 derived from the NH3 (1,1), (2,2), and (3,3) transitions (Szabó et al. 2023). |
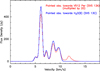 |
Fig. 4 Pointed H2O maser spectra towards V512 Per and H2O(B) observed on 2022 February 5. The spectrum of V512 Per is multiplied by 20 to better match the spectrum of H2O(B). |
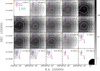 |
Fig. 5 Channel maps of H2O masers in H2O(B) (SVS 13C) and V512 Per (SVS 13A). The contours start at 0.5 Jy, and then increase by a factor of two. The plus signs represent the positions of the two H2O masers (orange and green) previously detected by Haschick et al. (1980) and YSOs (purple; e.g. Plunkett et al. 2013). Based on previous observations (Plunkett et al. 2013; Podio et al. 2021), the outflow directions are indicated by red and blue arrows. The beam size is shown in the lower right corner of the last panel. The colour bar represents the flux density in units of Jy. |
3.3 Serendipitous detections towards Class 0 protostars
3.3.1 A water maser flare in H2O(B)
In addition to the nine-point map described above (Sect. 3.2), we also performed OTP mapping towards V512 Per and H2O(B), shown in Fig. 5. As illustrated by the channel maps in Fig. 5, spectral features at υLSR ≤ 11 km s−1 peak around H2O(B) while spectral features at υLSR >ll кm s−1 peak around V512 Per. Figure 4 compares our pointed observations toward V512 Per and H2O(B) on 2022 February 5: the spectra show very similar profiles between 4 km s−1 and ~ 10 km s−1 but the intensities are different by a factor of ~20. This similarity suggests that our pointed observations of V512 Per, including those shown in Fig. 3, have significant contributions from H2O(B). We estimate this contribution for our 2022 February 5 observations assuming a perfect Gaussian beam pattern with a beam size of 40″. A source at an offset of 38.7″ (the angular separation between V512 Per and H2O(B) derived from our observations, see Table 1) will fall at the 7.5% response level of the beam, or between the 3.7–14% levels assuming a typical pointing error of 5″. Thus H2O(B), with a flux density of 498.7 Jy, would contribute 18.4–69.8 Jy to the spectrum observed towards V512 Per, comparable to the observed value of 21.3 Jy (Table 2).
Notably, in our pointed 2022 February 5 observations, the peak flux density of the water maser in H2O(B) is 498.7 Jy at υLSR = 6.1 km s−1. This is the highest flux density reported for this source to-date (cf. Haschick et al. 1980; Lyo et al. 2014), indicative of a maser flare (see also Sect. 4.1).
3.3.2 RNO 1 В/1 С and IRAS 00338+6312
RNO IB/1С (V710 Cas) is a double FUor system, with both RNO IB and 1С classified as FUors (Staude & Neckel 1991; Kenyon et al. 1993). The binary is part of a cluster of deeply embedded YSOs (e.g. Quanz et al. 2007) that has been targeted by numerous water maser studies (e.g. Fiebig 1995; Furuya et al. 2003; Sunada et al. 2007; Bae et al. 2011, and references therein). Previous VLA observations of the clustered region suggest that the water masers between ìLSR 30 km s−1 and υLSR 5 km s−1 originate from the deeply embedded Class 0 object IRAS 00338+6312, rather than RNO IB or RNO 1С (see, e.g. Fiebig 1995; Fiebig et al. 1996, and references therein). IRAS 00338+6312 is only ~4″ northeast of RNO 1С, but is a separate object (e.g. Mookerjea et al. 1999; Quanz et al. 2007). The blueshifted and redshifted masers are thought to arise from the bipolar outflow or an accretion disk (Fiebig et al. 1996).
In our pointing towards RNO 1B/1С, we detected water maser emission in four epochs, as shown in Fig. 6. During our first observations on 2021 November 18, we detected two maser features at υLSR = −28.78 km s−1 and υLSR = −15.79 km s−1; five days later the flux densities and LSR velocities of the two maser features were nearly unchanged. The source was observed again on 2022 January 25 and February 5: in these observations, the υLSR∼ −15.8 km s−1 feature had disappeared and the blueshifted maser was weaker and had slightly shifted in velocity to υLSR ∼ −28.48 km s−1. The Зет upper limits for the υLSR ~ −15.8 km s−1 feature are 0.12 Jy and 0.15 Jy for the observations on 2022 January 25 and February 5, respectively. We also note that the υLSR ∼ −28 km s−1 feature has the largest velocity offset with respect to the cloud among our detections, ~ 10 km s−1 (see Table 2). Based on comparing our results to the literature, the water maser features detected in our survey are most likely to originate from IRAS 00338+6312 rather than RNO 1B/1C. The velocities of our detected masers are similar to those of the masers associated with IRAS 00338+6312 in the VLA observations (Fiebig 1995; Fiebig et al. 1996) and also match the velocity range of the molecular outflow (about −30 km s−1 to −5 km s−1; Snell et al. 1990; Yang et al. 1991) driven by IRAS 00338+6312 (Henning et al. 1992; Wouterloot et al. 1993; Anglada et al. 1994; Furuya et al. 2003; Bae et al. 2011). We therefore do not count the water maser emission in our RNO IB/1С pointing as a detection towards an eruptive star and the Зσ upper limits are given in Table B.1.
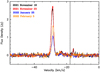 |
Fig. 6 H2O maser observed in IRAS 00338+6312 at four epochs in 2021 November, 2022 January and February. The dashed vertical line indicates the systemic υLSR оſ−17.8Зкms−1 derived from the NH3 (1,1), (2,2), and (3,3) transitions (Szabó et al. 2023). |
4 Discussion
4.1 Long-term time variation
Water maser flares have been recognised in star-forming regions for decades (e.g. Boboltz et al. 1998; Kramer et al. 2018), with recent observations suggesting that water maser flares can accompany ejection events associated with accretion bursts in massive and intermediate-mass stars (e.g. MacLeod et al. 2018; Brogan et al. 2018; Chen et al. 2021; Bayandina et al. 2022). Hence, it is reasonable to expect such water maser flares from FUors or EXors. Thus, we investigated whether our targets have experienced water maser flares.
Figure 7 presents long-term time series for the water masers detected in our survey, which show that these masers are quite variable in both flux density and LSR velocity. Based on data from the literature, Ζ CMa appears to be in a relatively active phase, with the flux density of 2.4 Jy seen during our observations the highest observed to date (cf. Blitz & Lada 1979; Thum et al. 1981; Deguchi et al. 1989; Scappini et al. 1991; Palla & Prusti 1993; Moscadelli et al. 2006; Sunada et al. 2007; Bae et al. 2011; Kim et al. 2018). For HH 354 IRS, no water maser emission was detected by previous observations (Wouterloot et al. 1993; Persi et al. 1994; Sunada et al. 2007). We report the first water maser detection toward this source. Since the upper limits of previous observations are comparable to the detected flux densities (see Fig. 7), we cannot conclude whether the maser was in its active or quiescent phase during our observations. For V512 Per, Fig. 7 compares the velocity component in our observations that likely arises from V512 Per (see Sect. 3.2) to archival data that include both single-dish and interferomet-ric measurements (Haschick et al. 1980; Claussen et al. 1996; Rodríguez et al. 2002; Furuya et al. 2ООЗ).Wе note that in the case of the Claussen et al. (1996) data, the results were measured from the published figures. Based on this comparison, we identify three water maser flares, in 1978, 1992, and 1998, which reached peak flux densities of ~3l·0Jy, 660 Jy, and 244 Jy on 1978 February 17, 1992 November 28, and 1998 June 22, respectively. The observations spanning these dates were performed with single-dish telescopes with large beams (>1′), so H2O(B) could potentially contribute to the observed flux densities (see Sect. 3.2). Claussen et al. (1996) noted, however, that the maser features detected in their 1991–1992 observations all had velocities consistent with those of H2O(A)/V512 Per, suggesting that this flare was associated with the eruptive star.
For H2O(B), we find no suggestion in the literature of this source being an eruptive variable at optical or near-infrared wavelengths, but our comparison with previous water maser observations (Fig. 7; Haschick et al. 1980; Lyo et al. 2014) shows three maser flares with peak flux densities of >100 Jy, on 1975 November 30, 2012 May 28, and 2022 February 5. As for V512 Per, Fig. 7 compares the velocity components in our observations that likely arise from H2O(B), (Sects. 3.2 and 3.3.1) with historical data. Again, the large single dish beams encompass both H2O(B) and V512 Per, meaning that we cannot rule out a contribution from V512 Per to the historical flares. For instance, the observations of Lyo et al. (2014) had a HPBW of 120″. As noted in Sect. 3.3.1, the water maser flare detected in our observations on 2022 February 5 is the brightest to date, with a peak flux density of 498.7 Jy.
For IRAS 00338+6312, there is similarly no suggestion in the literature of this being an eruptive source in the optical or near-infrared, but Fig. 7 suggests its water maser emission was in an active phase in 1998 and 2004 (Cesaroni et al. 1988; Henning et al. 1992; Wouterloot et al. 1993; Persi et al. 1994; Fiebig 1995; Codella et al. 1995; Furuya et al. 2003; Sunada et al. 2007; Bae et al. 2011), but relatively quiescent during our observations. The highest flux density reached was ~31 Jy on 1998 January 5 (Furuya et al. 2003).
Periodic variations have been reported in some velocity components of the 22.2 GHz H2O (and the 6.7 GHz Class II CH3OH) masers associated with the intermediate-mass YSO G107.298+5.639. Cyclic accretion instabilities have been invokedto explain this peculiarbehavior(Szymczaketal. 2016). Low-mass stars such as FUors and EXors might also experience cyclic accretion events, but we do not find evidence for periodic variations in Fig. 7.
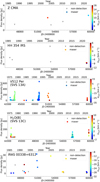 |
Fig. 7 Long-term variations in flux density of detected water masers. The colour-coded dots and grey triangles represent flux densities for maser detections, colour-coded by velocity (see colour-bar at right), and upper limits for non-detections, respectively. References for archival data are given in Sect. 4.1. |
4.2 Scarcity of water masers in selected eruptive systems
Our water maser detection rate of 6% in FUors and EXors is perhaps surprising in light of the close connection between water maser emission and mass accretion and ejection in protostars (see Sect. 1). In this section, we consider possible explanations for the low detection rate.
First, the low detections could be caused by an evolutionary effect. Previous observations indicate that the water maser detection rate decreases from Class 0 to Class II objects (e.g. Furuya et al. 2001). Since the selected FUors and EXors are mainly Class I and Class II objects (see Tables 1 and B.1), we would expect a lower detection rate compared to Class 0 objects. Furthermore, our detection rate is comparable to that (6.3%) for Class I objects in Furuya et al. (2001). We do not detect any water masers toward Class II objects, which further supports the evolutionary trend proposed by Furuya et al. (2001).
Second, water masers have relatively low luminosities in low-mass star formation regions. Statistical studies have shown that the maser luminosities are correlated with bolometric luminosities (e.g. Fig. 16 in Urquhart et al. 2011). This suggests lower maser luminosities in low-mass star formation regions, so lower flux densities would be expected. This could contribute to our low detection rate toward low-mass eruptive stars. This is supported by previous water maser surveys toward the Serpens South and Orion molecular clouds (Kang et al. 2013; Ortiz-León et al. 2021), which give detection rates of ≲2% for low-mass protostars.
Third, water masers show rapid time variations. The time variability of water masers is evident in our study (see also Figs. 2, 4 and 7). Water masers can be in a quiescent phase for about five years (Claussen et al. 1996), meaning that maser emission would not be detected during that time even for sources known to be associated with water masers. This is consistent with the fact that several water masers reported by previous studies are not detected in our observations (see Table B.1). It is possible that non-detection of water masers is due to their inactive state. Indeed, when including historical detections, the detection rate of water masers in eruptive stars in our sample is ~15% (excluding the unclassified Gaia alerts), which is higher than our survey detection rate of 6%. This suggests that previously detected water masers were in an inactive phase during our observations.
5 Conclusions
In this paper, we present the results of the first dedicated water maser survey towards FUors and EXors, two classes of low-mass young eruptive stars. We detected H2O masers toward five objects, of which three are young eruptive stars: Z CMa (FUor; Class I), HH 354 IRS (FUor; Class 0/I), V512 Per (EXor; Class I), IRAS 00338+6312 (Class 0), and H2O(B) (Class 0). Our detection is the first report of water maser emission in HH 354 IRS. Our observations reveal the highest peak flux density yet reported towards H2O(B) (498.7 Jy), indicative of a recent H2O maser flare. Overall, our observations reveal a detection rate of ~6% for young eruptive stars. An analysis of the long-term time series of the water masers suggests that V512 Per and H2O(B) have experienced multiple water maser flares.
Despite the low detection rate, our observations confirm the presence of 22.2 GHz water maser emission in FUors and EXors, meaning that follow-up radio interferometric observations can be used to probe the environments of eruptive stars on small scales (see, e.g. Haschick et al. 1980; Rodríguez et al. 2002). If water masers are generally weak in FUors and EXors (Sect. 4.2), deeper observations would also be potentially able to find more of them. Expanding on optical and near-infrared knowledge of FUors/EXors with more radio observations, especially future VLBI measurements, will be crucial to improve our understanding of the underlying physics (e.g. mass accretion and ejection) of such peculiar objects, as well as the eventual formation of Sun-like stars.
Acknowledgements
We thank the referee for their valuable comments and suggestions which improved the quality of the manuscript. Based on observations (Project ID: 95–21, PI: Szabó) with the 100-m telescope of the MPIfR (Max-Planck-Institut für Radioastronomie) in Effelsberg. Zs.M.Sz. acknowledges funding from a St Leonards scholarship from the University of St Andrews. For the purpose of open access, the author has applied a Creative Commons Attribution (CC BY) licence to any Author Accepted Manuscript version arising. This project has received funding from the European Research Council (ERC) under the European Union’s Horizon 2020 research and innovation programme under grant agreement no. 716155 (SACCRED). This work has made use of the database for astrophysical masers (https://maserdb.net/) (Ladeyschikov et al. 2022). O.B. acknowledges financial support from the Italian Ministry of University and Research - Project Proposal CIR01_00010. We acknowledge ESA Gaia, DPAC and the Photometric Science Alerts Team (http://gsaweb.ast.cam.ac.uk/alerts). This work presents results from the European Space Agency (ESA) space mission Gaia. Gaia data are being processed by the Gaia Data Processing and Analysis Consortium (DPAC). Funding for the DPAC is provided by national institutions, in particular the institutions participating in the Gaia MultiLateral Agreement (MLA). The Gaia mission website is https://www.cosmos.esa.int/gaia. The Gaia archive website is https://archives.esac.esa.int/gaia.
Appendix A W75N
During our initial observing run on 2021 November 18, our setup was verified by observing W75N, a well-known massive star-forming region showing bright water masers (Lekht & Sorochenko 1984; Hunter et al. 1994; Kim et al. 2013, and references therein). Although our survey focused on low- and intermediate-mass young stars, here we briefly present the W75N maser spectrum to make it available for potential future studies of maser variability in this region. Figure A.1 shows the water maser spectrum observed toward W75N on 2021 November 18. The dashed vertical line indicates the average centroid υLSR of 9.43 km s−1 derived from the NH3 (1,1), (2,2), and (3,3) transitions. In Table A.1, we list the properties of the water maser features, along with the υLSR results from the NH3 transitions.
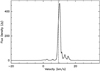 |
Fig. A.1 H2O maser spectrum observed toward W75N on 2021 November 18. The dashed line indicates the centroid LSR velocity of 9.43 km s−1 from the NH3 (1,1), (2,2), and (3,3) transitions. |
H2O maser velocity components and NH3 LSR velocities from observations of W75N on 2021 November 18.
Appendix B Non-detections in our survey
In total, our survey consisted of 51 objects: 33 Fuors, 13 EXors and 5 Gaia alerts accessible with the Effelsberg 100-m telescope. The chosen Gaia alerts are part of the Piszkésteto Monitoring Program, in Hungary, which started a few years ago with the aim of following the optical wavelength brightness variations of Gaia alert sources with light curves that resemble those of FUors and EXors (see e.g. Szegedi-Elek et al. 2020; Nagy et al. 2021; Cruz-Sáenz de Miera et al. 2022). We chose Gaia alerts for inclusion in our sample based on their having light curves and luminosities similar to those of FUors and EXors. Water masers were detected in only four out of our 51 targeted sources, however, the emission in one of those target pointings is not attributed to the targeted eruptive star (see Sect. 3.3.2). The 48 non-detections, within an expected velocity range from −100 to +100 km s−1, are reported in Table B.1.
H2O maser non-detections in our survey.
References
- Abraham, Z., Cohen, N. L., Opher, R., Raffaelli, J. C., & Zisk, S. H. 1981, A&A, 100, L10 [NASA ADS] [Google Scholar]
- Ábrahám, P., Kóspál, Á., Kun, M., et al. 2018, ApJ, 853, 28 [CrossRef] [Google Scholar]
- Anglada, G., Rodriguez, L. F., Girart, J. M., Estalella, R., & Torrelles, J. M. 1994, ApJ, 420, L91 [CrossRef] [Google Scholar]
- Anglada, G., Estalella, R., Pastor, J., Rodriguez, L. F., & Haschick, A. D. 1996, ApJ, 463, 205 [Google Scholar]
- Anglada, G., Rodríguez, L. F., & Torrelles, J. M. 2000, ApJ, 542, L123 [NASA ADS] [CrossRef] [Google Scholar]
- Audard, M., Ábrahám, P., Dunham, M. M., et al. 2014, in Protostars and Planets VI, eds. H. Beuther, R. S. Klessen, C. P. Dullemond, & T. Henning (Tucson: University of Arizona Press), 387 [Google Scholar]
- Bachiller, R., Gueth, F., Guilloteau, S., Tafalla, M., & Dutrey, A. 2000, A&A, 362, L33 [NASA ADS] [Google Scholar]
- Bae, J.-H., Kim, K.-T., Youn, S.-Y., et al. 2011, ApJS, 196, 21 [NASA ADS] [CrossRef] [Google Scholar]
- Bailer-Jones, C. A. L., Rybizki, J., Fouesneau, M., Mantelet, G., & Andrae, R. 2018, AJ, 156, 58 [Google Scholar]
- Bailer-Jones, C. A. L., Rybizki, J., Fouesneau, M., Demleitner, M., & Andrae, R. 2021, AJ, 161, 147 [Google Scholar]
- Banzatti, A., Meyer, M. R., Manara, C. F., Pontoppidan, K. M., & Testi, L. 2014, ApJ, 780, 26 [Google Scholar]
- Bayandina, O. S., Brogan, C. L., Burns, R. A., et al. 2022, A&A, 664, A44 [NASA ADS] [CrossRef] [EDP Sciences] [Google Scholar]
- Blitz, L., & Lada, C. J. 1979, ApJ, 227, 152 [NASA ADS] [CrossRef] [Google Scholar]
- Boboltz, D. A., Simonetti, J. H., Dennison, B., Diamond, P. J., & Uphoff, J. A. 1998, ApJ, 509, 256 [NASA ADS] [CrossRef] [Google Scholar]
- Bonnefoy, M., Chauvin, G., Dougados, C., et al. 2017, A&A, 597, A91 [NASA ADS] [CrossRef] [EDP Sciences] [Google Scholar]
- Brand, J., Wouterloot, J. G. A., Codella, C., Massi, F., & Giannetti, A. 2019, A&A, 628, A98 [NASA ADS] [CrossRef] [EDP Sciences] [Google Scholar]
- Brogan, C. L., Hunter, T. R., Cyganowski, C. J., et al. 2018, ApJ, 866, 87 [NASA ADS] [CrossRef] [Google Scholar]
- Bronfman, L., Nyman, L. A., & May, J. 1996, A&AS, 115, 81 [Google Scholar]
- Burns, R. A., Handa, T., Nagayama, T., Sunada, K., & Omodaka, T. 2016, MNRAS, 460, 283 [NASA ADS] [CrossRef] [Google Scholar]
- Cesaroni, R., Palagi, F., Felli, M., et al. 1988, A&AS, 76, 445 [NASA ADS] [Google Scholar]
- Chen, X., Arce, H. G., Zhang, Q., et al. 2013, ApJ, 768, 110 [Google Scholar]
- Chen, Z., Sun, W., Chini, R., et al. 2021, ApJ, 922, 90 [NASA ADS] [CrossRef] [Google Scholar]
- Claussen, M. J., Wilking, B. A., Benson, P. J., et al. 1996, ApJS, 106, 111 [NASA ADS] [CrossRef] [Google Scholar]
- Codella, C., Palumbo, G. G. C., Pareschi, G., et al. 1995, MNRAS, 276, 57 [NASA ADS] [Google Scholar]
- Connelley, M. S., & Greene, T. P. 2010, AJ, 140, 1214 [Google Scholar]
- Connelley, M. S., & Reipurth, B. 2018, ApJ, 861, 145 [NASA ADS] [CrossRef] [Google Scholar]
- Cruz-Sáenz de Miera, F., Kóspál, Á., Ábrahám, P., et al. 2022, ApJ, 927, 125 [CrossRef] [Google Scholar]
- Cyganowski, C. J., Koda, J., Rosolowsky, E., et al. 2013, ApJ, 764, 61 [NASA ADS] [CrossRef] [Google Scholar]
- Deguchi, S., Nakada, Y., & Forster, J. R. 1989, MNRAS, 239, 825 [NASA ADS] [Google Scholar]
- Diaz-Rodriguez, A. K., Anglada, G., Blázquez-Calero, G., et al. 2022, ApJ, 930, 91 [NASA ADS] [CrossRef] [Google Scholar]
- Dong, R., Liu, H. B., Cuello, N., et al. 2022, Nat. Astron., 6, 331 [NASA ADS] [CrossRef] [Google Scholar]
- Eisloeffel, J., Guenther, E., Hessman, F. V., et al. 1991, ApJ, 383, L19 [NASA ADS] [CrossRef] [Google Scholar]
- Elitzur, M. 1992, ARA&A, 30, 75 [NASA ADS] [CrossRef] [Google Scholar]
- Elitzur, M., & Fuqua, J. B. 1989, ApJ, 347, L35 [NASA ADS] [CrossRef] [Google Scholar]
- Elitzur, M., Hollenbach, D. J., & McKee, C. F. 1989, ApJ, 346, 983 [NASA ADS] [CrossRef] [Google Scholar]
- Evans, I., Neal, J., Dunham, M. M., Jørgensen, J. K., et al. 2009, ApJS, 181, 321 [NASA ADS] [CrossRef] [Google Scholar]
- Fehér, O., Kóspál, Á., Ábrahám, P., Hogerheijde, M. R., & Brinch, C. 2017, A&A, 607, A39 [CrossRef] [EDP Sciences] [Google Scholar]
- Felli, M., Palagi, F., & Tofani, G. 1992, A&A, 255, 293 [NASA ADS] [Google Scholar]
- Fiebig, D. 1995, A&A, 298, 207 [NASA ADS] [Google Scholar]
- Fiebig, D., Duschl, W. J., Menten, K. M., & Tscharnuter, W. M. 1996, A&A, 310, 199 [NASA ADS] [Google Scholar]
- Fischer, W. J., Hillenbrand, L. A., Herczeg, G. J., et al. 2022, ArXiv e-prints [arXiv:2203.11257] [Google Scholar]
- Fujiyoshi, T., Wright, C. M., & Moore, T. J. T. 2015, MNRAS, 451, 3371 [NASA ADS] [CrossRef] [Google Scholar]
- Fuller, G. A., Ladd, E. F., Padman, R., Myers, P. C., & Adams, F. C. 1995, ApJ, 454, 862 [NASA ADS] [CrossRef] [Google Scholar]
- Furuya, R. S., Kitamura, Y., Wootten, H. A., Claussen, M. J., & Kawabe, R. 2001, ApJ, 559, L143 [NASA ADS] [CrossRef] [Google Scholar]
- Furuya, R. S., Kitamura, Y., Wootten, A., Claussen, M. J., & Kawabe, R. 2003, ApJS, 144, 71 [NASA ADS] [CrossRef] [Google Scholar]
- Gaia Collaboration 2022, VizieR Online Data Catalog: I/355 [Google Scholar]
- Giannini, T., Lorenzetti, D., Antoniucci, S., et al. 2016, ApJ, 819, L5 [CrossRef] [Google Scholar]
- Gildas Team 2013, Astrophysics Source Code Library [record ascl:1305.010] [Google Scholar]
- Gómez, J. F., de Gregorio-Monsalvo, I., Suárez, O., & Kuiper, T. B. H. 2006, AJ, 132, 1322 [CrossRef] [Google Scholar]
- Goodrich, R. W. 1986, AJ, 92, 885 [NASA ADS] [CrossRef] [Google Scholar]
- Gramajo, L. V., Rodón, J. A., & Gómez, M. 2014, AJ, 147, 140 [NASA ADS] [CrossRef] [Google Scholar]
- Gray, M. 2012, Maser Sources in Astrophysics (Cambridge University Press) [CrossRef] [Google Scholar]
- Gray, M. D., Etoka, S., Richards, A. M. S., & Pimpanuwat, B. 2022, MNRAS, 513, 1354 [NASA ADS] [CrossRef] [Google Scholar]
- Greene, T. P., Wilking, B. A., Andre, P., Young, E. T., & Lada, C. J. 1994, ApJ, 434, 614 [NASA ADS] [CrossRef] [Google Scholar]
- Hartmann, L., & Kenyon, S. J. 1996, ARA&A, 34, 207 [NASA ADS] [CrossRef] [Google Scholar]
- Haschick, A. D., Moran, J. M., Rodriguez, L. F., et al. 1980, ApJ, 237, 26 [NASA ADS] [CrossRef] [Google Scholar]
- Henning, T., Cesaroni, R., Walmsley, M., & Pfau, W. 1992, A&AS, 93, 525 [NASA ADS] [Google Scholar]
- Herbig, G. H. 1977, ApJ, 217, 693 [NASA ADS] [CrossRef] [Google Scholar]
- Herbig, G. H. 1989, ESO Conference and Workshop Proceedings, 33, 233 [Google Scholar]
- Herbig, G. H. 1990, ApJ, 360, 639 [NASA ADS] [CrossRef] [Google Scholar]
- Hillenbrand, L. A., Miller, A. A., Covey, K. R., et al. 2013, AJ, 145, 59 [NASA ADS] [CrossRef] [Google Scholar]
- Hirota, T., Tsuboi, M., Fujisawa, K., et al. 2011, ApJ, 739, L59 [NASA ADS] [CrossRef] [Google Scholar]
- Hodgkin, S. T., Harrison, D. L., Breedt, E., et al. 2021, A&A, 652, A76 [NASA ADS] [CrossRef] [EDP Sciences] [Google Scholar]
- Hunter, T. R., Taylor, G. B., Felli, M., & Tofani, G. 1994, A&A, 284, 215 [Google Scholar]
- Jurdana-Šepić, R., Munari, U., Antoniucci, S., Giannini, T., & Lorenzetti, D. 2018, A&A, 614, A9 [NASA ADS] [CrossRef] [EDP Sciences] [Google Scholar]
- Kang, M., Lee, J.-E., Choi, M., et al. 2013, ApJS, 209, 25 [NASA ADS] [CrossRef] [Google Scholar]
- Kazarovets, E. V., Samus, N. N., & Goranskij, V. P. 1993, Inf. Bull. Var. Stars, 3840, 1 [NASA ADS] [Google Scholar]
- Kenyon, S. J., Hartmann, L., Gomez, M., Carr, J. S., & Tokunaga, A. 1993, AJ, 105, 1505 [NASA ADS] [CrossRef] [Google Scholar]
- Kim, J.-S., Kim, S.-W., Kurayama, T., et al. 2013, ApJ, 767, 86 [NASA ADS] [CrossRef] [Google Scholar]
- Kim, C.-H., Kim, K.-T., & Park, Y.-S. 2018, ApJS, 236, 31 [NASA ADS] [CrossRef] [Google Scholar]
- Klein, B., Hochgürtel, S., Krämer, I., et al. 2012, A&A, 542, L3 [NASA ADS] [CrossRef] [EDP Sciences] [Google Scholar]
- Koresko, C. D., Beckwith, S. V. W., Ghez, A. M., Matthews, K., & Neugebauer, G. 1991, AJ, 102, 2073 [CrossRef] [Google Scholar]
- Kóspál, Á., Ábrahám, P., Apai, D., et al. 2008, MNRAS, 383, 1015 [CrossRef] [Google Scholar]
- Kóspál, Á., Ábrahám, P., Moór, A., et al. 2015, ApJ, 801, L5 [CrossRef] [Google Scholar]
- Kóspál, Á., Ábrahám, P., Acosta-Pulido, J. A., et al. 2016, A&A, 596, A52 [NASA ADS] [CrossRef] [EDP Sciences] [Google Scholar]
- Kóspál, Á., Ábrahám, P., Csengeri, T., et al. 2017, ApJ, 836, 226 [CrossRef] [Google Scholar]
- Kramer, B. H., Menten, K. M., & Kraus, A. 2018, IAU Symp., 336, 279 [NASA ADS] [Google Scholar]
- Ladeyschikov, D. A., Sobolev, A. M., Bayandina, O. S., & Shakhvorostova, N. N. 2022, AJ, 163, 124 [NASA ADS] [CrossRef] [Google Scholar]
- Lekht, E. E., & Sorochenko, R. L. 1984, Sov. Astron. Lett., 10, 307 [Google Scholar]
- Liu, H. B., Dunham, M. M., Pascucci, I., et al. 2018, A&A, 612, A54 [NASA ADS] [CrossRef] [EDP Sciences] [Google Scholar]
- Lo, K. Y., & Bechis, K. P. 1973, ApJ, 185, L71 [NASA ADS] [CrossRef] [Google Scholar]
- Lo, K. Y., & Bechis, K. P. 1974, ApJ, 190, L125 [NASA ADS] [CrossRef] [Google Scholar]
- Lyo, A. R., Kim, J., Byun, D.-Y., & Lee, H.-G. 2014, AJ, 148, 80 [NASA ADS] [CrossRef] [Google Scholar]
- MacLeod, G. C., Smits, D. P., Goedhart, S., et al. 2018, MNRAS, 478, 1077 [CrossRef] [Google Scholar]
- Mathieu, R. D., Martin, E. L., & Magazzu, A. 1996, in AAS Meet. Abstr., 188, 60.05 [Google Scholar]
- Mauron, N., & Thouvenot, E. 1991, SVS 13, http://www.cbat.eps.harvard.edu/iauc/05200/05261.html, iAUC 5261: 1991Z; SVS 13; 1991g [Google Scholar]
- Menten, K. M., Reid, M. J., Forbrich, J., & Brunthaler, A. 2007, A&A, 474, 515 [NASA ADS] [CrossRef] [EDP Sciences] [Google Scholar]
- Miller, A. A., Hillenbrand, L. A., Bilgi, P., et al. 2015, ATel, 7428, 1 [NASA ADS] [Google Scholar]
- Mookerjea, B., Ghosh, S. K., Karnik, A. D., et al. 1999, Bull. Astron. Soc. India, 27, 155 [NASA ADS] [Google Scholar]
- Moriarty-Schieven, G. H., Aspin, C., & Davis, G. R. 2008, AJ, 136, 1658 [NASA ADS] [CrossRef] [Google Scholar]
- Moscadelli, L., Testi, L., Furuya, R. S., et al. 2006, A&A, 446, 985 [NASA ADS] [CrossRef] [EDP Sciences] [Google Scholar]
- Moscadelli, L., Sanna, A., Goddi, C., et al. 2019, A&A, 631, A74 [NASA ADS] [CrossRef] [EDP Sciences] [Google Scholar]
- Nagy, Z., Szegedi-Elek, E., Ábrahám, P., et al. 2021, MNRAS, 504, 185 [NASA ADS] [CrossRef] [Google Scholar]
- Omodaka, T., Maeda, T., Miyoshi, M., et al. 1999, PASJ, 51, 333 [NASA ADS] [CrossRef] [Google Scholar]
- Ortiz-León, G. N., Plunkett, A. L., Loinard, L., et al. 2021, AJ, 162, 68 [CrossRef] [Google Scholar]
- Ott, M., Witzel, A., Quirrenbach, A., et al. 1994, A&A, 284, 331 [NASA ADS] [Google Scholar]
- Palagi, F., Cesaroni, R., Comoretto, G., Felli, M., & Natale, V. 1993, A&AS, 101, 153 [Google Scholar]
- Palla, F., & Prusti, T. 1993, A&A, 272, 249 [NASA ADS] [Google Scholar]
- Park, S., Kóspál, Á., Cruz-Sáenz de Miera, F., et al. 2021, ApJ, 923, 171 [NASA ADS] [CrossRef] [Google Scholar]
- Park, S., Kóspál, Á., Ábrahám, P., et al. 2022, ApJ, 941, 165 [NASA ADS] [CrossRef] [Google Scholar]
- Parsamian, E. S., & Mujica, R. 2004, Astrophysics, 47, 433 [NASA ADS] [CrossRef] [Google Scholar]
- Persi, P., Palagi, F., & Felli, M. 1994, A&A, 291, 577 [NASA ADS] [Google Scholar]
- Pety, J. 2005, SF2A-2005: Semaine de l’Astrophysique Française, meeting held in Strasbourg, France, eds. F. Casoli, T. Contini, J. M. Hameury, & L. Pagani (EDP Sciences Conf. Ser.), 721 [Google Scholar]
- Pickett, H. M., Poynter, R. L., Cohen, E. A., et al. 1998, J. Quant. Spec. Radiat. Transf., 60, 883 [Google Scholar]
- Plunkett, A. L., Arce, H. G., Corder, S. A., et al. 2013, ApJ, 774, 22 [NASA ADS] [CrossRef] [Google Scholar]
- Podio, L., Tabone, B., Codella, C., et al. 2021, A&A, 648, A45 [NASA ADS] [CrossRef] [EDP Sciences] [Google Scholar]
- Principe, D. A., Cieza, L., Hales, A., et al. 2018, MNRAS, 473, 879 [CrossRef] [Google Scholar]
- Quanz, S. P., Henning, T., Bouwman, J., Linz, H., & Lahuis, F. 2007, ApJ, 658, 487 [CrossRef] [Google Scholar]
- Reid, M. J., & Honma, M. 2014, ARA&A, 52, 339 [NASA ADS] [CrossRef] [Google Scholar]
- Reipurth, B., & Aspin, C. 1997, AJ, 114, 2700 [NASA ADS] [CrossRef] [Google Scholar]
- Reipurth, B., Bally, J., & Devine, D. 1997, AJ, 114, 2708 [Google Scholar]
- Rodríguez, L. F., Anglada, G., & Curiel, S. 1997, ApJ, 480, L125 [CrossRef] [Google Scholar]
- Rodríguez, L. F., Anglada, G., Torrelles, J. M., et al. 2002, A&A, 389, 572 [NASA ADS] [CrossRef] [EDP Sciences] [Google Scholar]
- Ruíz-Rodríguez, D., Cieza, L. A., Williams, J. P., et al. 2017, MNRAS, 466, 3519 [CrossRef] [Google Scholar]
- Sandell, G., & Weintraub, D. A. 2001, ApJS, 134, 115 [NASA ADS] [CrossRef] [Google Scholar]
- Scappini, F., Caselli, P., & Palumbo, G. G. C. 1991, MNRAS, 249, 763 [NASA ADS] [Google Scholar]
- Segura-Cox, D. M., Looney, L. W., Tobin, J. J., et al. 2018, ApJ, 866, 161 [Google Scholar]
- Snell, R. L., Dickman, R. L., & Huang, Y. L. 1990, ApJ, 352, 139 [NASA ADS] [CrossRef] [Google Scholar]
- Staude, H. J., & Neckel, T. 1991, A&A, 244, L13 [NASA ADS] [Google Scholar]
- Stecklum, B., Melnikov, S. Y., & Meusinger, H. 2007, A&A, 463, 621 [NASA ADS] [CrossRef] [EDP Sciences] [Google Scholar]
- Strom, S. E., Vrba, F. J., & Strom, K. M. 1976, AJ, 81, 314 [Google Scholar]
- Sunada, K., Nakazato, T., Ikeda, N., et al. 2007, PASJ, 59, 1185 [NASA ADS] [Google Scholar]
- Szabó, Z. M., Gong, Y., Menten, K. M., et al. 2023, A&A, 672, A158 [NASA ADS] [CrossRef] [EDP Sciences] [Google Scholar]
- Szegedi-Elek, E., Ábrahám, P., Wyrzykowski, Ł., et al. 2020, ApJ, 899, 130 [Google Scholar]
- Szymczak, M., Olech, M., Wolak, P., Bartkiewicz, A., & Gawroński, M. 2016, MNRAS, 459, L56 [NASA ADS] [CrossRef] [Google Scholar]
- Takaba, H., Iwata, T., Miyaji, T., & Deguchi, S. 2001, Commun. Res. Lab. Rev., 47, 107 [NASA ADS] [Google Scholar]
- Takami, M., Chen, T.-S., Liu, H. B., et al. 2019, ApJ, 884, 146 [NASA ADS] [CrossRef] [Google Scholar]
- Thum, C., Bertout, C., & Downes, D. 1981, A&A, 94, 80 [NASA ADS] [Google Scholar]
- Urquhart, J. S., Hoare, M. G., Lumsden, S. L., et al. 2009, A&A, 507, 795 [NASA ADS] [CrossRef] [EDP Sciences] [Google Scholar]
- Urquhart, J. S., Morgan, L. K., Figura, C. C., et al. 2011, MNRAS, 418, 1689 [NASA ADS] [CrossRef] [Google Scholar]
- Valdettaro, R., Palla, F., Brand, J., et al. 2001, A&A, 368, 845 [CrossRef] [EDP Sciences] [Google Scholar]
- Visser, A. E., Richer, J. S., & Chandler, C. J. 2002, AJ, 124, 2756 [NASA ADS] [CrossRef] [Google Scholar]
- Wachmann, A. 1954, ZAp, 35, 74 [NASA ADS] [Google Scholar]
- White, J. A., Kóspál, Á., Rab, C., et al. 2019, ApJ, 877, 21 [NASA ADS] [CrossRef] [Google Scholar]
- Winkel, B., Kraus, A., & Bach, U. 2012, A&A, 540, A140 [NASA ADS] [CrossRef] [EDP Sciences] [Google Scholar]
- Winnberg, A., Graham, D., Walmsley, C. M., & Booth, R. S. 1981, A&A, 93, 79 [NASA ADS] [Google Scholar]
- Wouterloot, J. G. A., Brand, J., & Fiegle, K. 1993, A&AS, 98, 589 [NASA ADS] [Google Scholar]
- Yang, J., Umemoto, T., Iwata, T., & Fukui, Y. 1991, ApJ, 373, 137 [NASA ADS] [CrossRef] [Google Scholar]
- Yung, B. H. K., Nakashima, J.-I., Imai, H., et al. 2013, ApJ, 769, 20 [NASA ADS] [CrossRef] [Google Scholar]
- Zapata, L. A., Galván-Madrid, R., Carrasco-González, C., et al. 2015, ApJ, 811, L4 [NASA ADS] [CrossRef] [Google Scholar]
- Zsidi, G., Ábrahám, P., Acosta-Pulido, J. A., et al. 2019, ApJ, 873, 130 [NASA ADS] [CrossRef] [Google Scholar]
- Zurlo, A., Cieza, L. A., Williams, J. P., et al. 2017, MNRAS, 465, 834 [CrossRef] [Google Scholar]
The 100-m telescope in Effelsberg is operated by the Max-Planck-Institut für Radioastronomie (MPIfR) on behalf of the Max-Planck Gesellschaft (MPG).
All Tables
Basic information about the sources towards which water maser emission was detected at 22.2 GHz.
H2O maser velocity components and NH3 LSR velocities from observations of W75N on 2021 November 18.
All Figures
|
Fig. 1 H2O maser spectrum of Ζ CMa observed on 2022 January 25. The dashed vertical line indicates the υLSR of 13.8 km s−1 from the NH3 (1,1) transition (Szabó et al. 2023). |
| In the text | |
|
Fig. 2 Spectrally smoothed line profile of H2O maser emission observed in HH 354 1RS on 2021 November 18 and 2022 January 25. The dashed vertical line indicates the average υLSR of −1.47 km s−1 derived from the NH3 (1,1) and (2,2) transitions (Szabó et al. 2023). |
| In the text | |
|
Fig. 3 H2O maser spectra toward V512 Per in November 2021: the two epochs are indicated at upper left. The dashed line indicates the average υLSR of 8.39 km s−1 derived from the NH3 (1,1), (2,2), and (3,3) transitions (Szabó et al. 2023). |
| In the text | |
|
Fig. 4 Pointed H2O maser spectra towards V512 Per and H2O(B) observed on 2022 February 5. The spectrum of V512 Per is multiplied by 20 to better match the spectrum of H2O(B). |
| In the text | |
|
Fig. 5 Channel maps of H2O masers in H2O(B) (SVS 13C) and V512 Per (SVS 13A). The contours start at 0.5 Jy, and then increase by a factor of two. The plus signs represent the positions of the two H2O masers (orange and green) previously detected by Haschick et al. (1980) and YSOs (purple; e.g. Plunkett et al. 2013). Based on previous observations (Plunkett et al. 2013; Podio et al. 2021), the outflow directions are indicated by red and blue arrows. The beam size is shown in the lower right corner of the last panel. The colour bar represents the flux density in units of Jy. |
| In the text | |
|
Fig. 6 H2O maser observed in IRAS 00338+6312 at four epochs in 2021 November, 2022 January and February. The dashed vertical line indicates the systemic υLSR оſ−17.8Зкms−1 derived from the NH3 (1,1), (2,2), and (3,3) transitions (Szabó et al. 2023). |
| In the text | |
|
Fig. 7 Long-term variations in flux density of detected water masers. The colour-coded dots and grey triangles represent flux densities for maser detections, colour-coded by velocity (see colour-bar at right), and upper limits for non-detections, respectively. References for archival data are given in Sect. 4.1. |
| In the text | |
|
Fig. A.1 H2O maser spectrum observed toward W75N on 2021 November 18. The dashed line indicates the centroid LSR velocity of 9.43 km s−1 from the NH3 (1,1), (2,2), and (3,3) transitions. |
| In the text | |
Current usage metrics show cumulative count of Article Views (full-text article views including HTML views, PDF and ePub downloads, according to the available data) and Abstracts Views on Vision4Press platform.
Data correspond to usage on the plateform after 2015. The current usage metrics is available 48-96 hours after online publication and is updated daily on week days.
Initial download of the metrics may take a while.