Open Access
Fig. 7
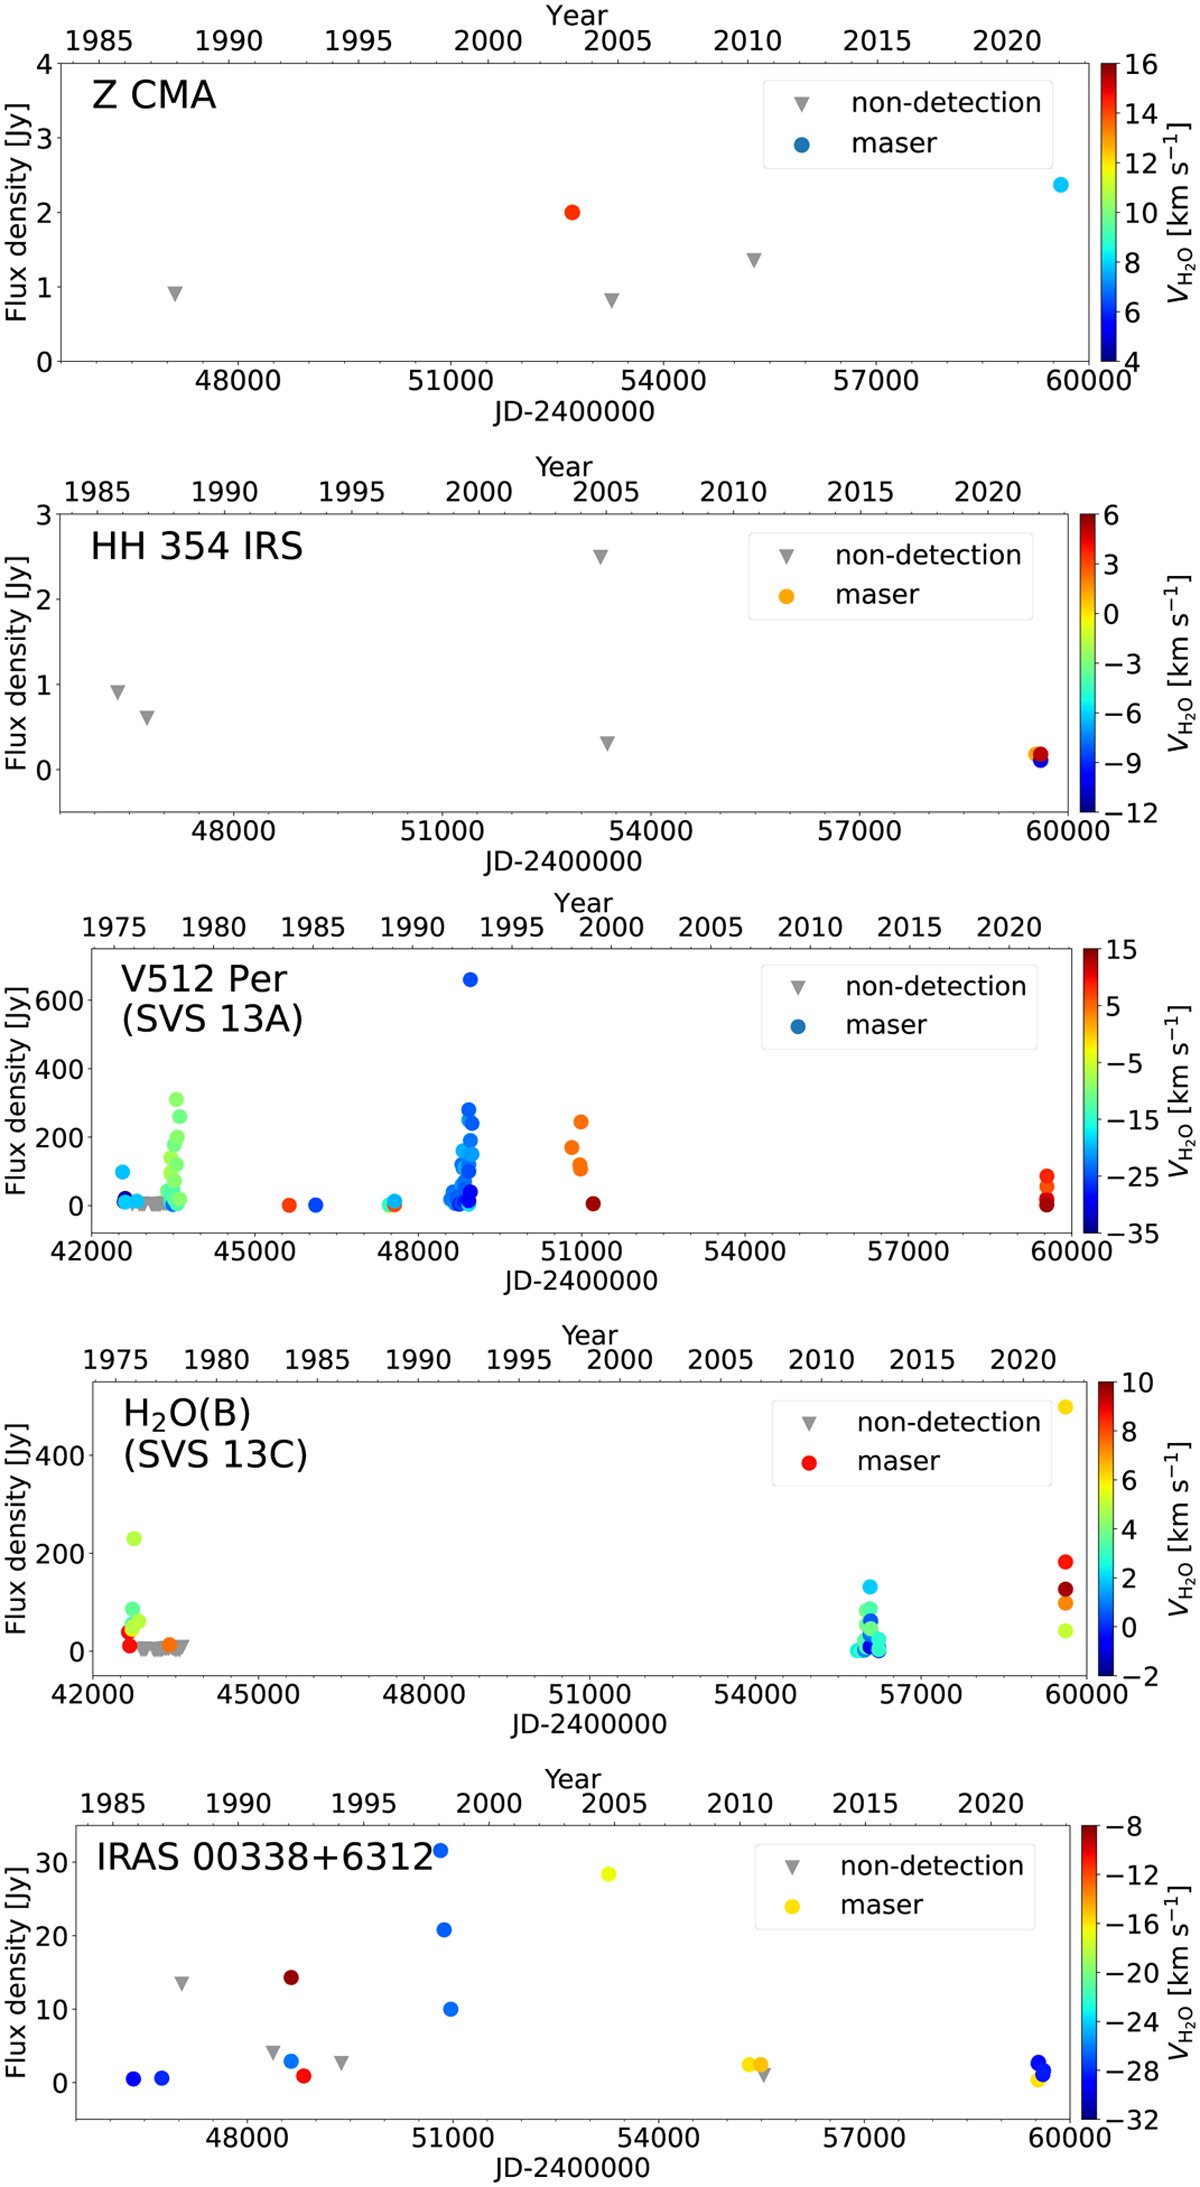
Download original image
Long-term variations in flux density of detected water masers. The colour-coded dots and grey triangles represent flux densities for maser detections, colour-coded by velocity (see colour-bar at right), and upper limits for non-detections, respectively. References for archival data are given in Sect. 4.1.
Current usage metrics show cumulative count of Article Views (full-text article views including HTML views, PDF and ePub downloads, according to the available data) and Abstracts Views on Vision4Press platform.
Data correspond to usage on the plateform after 2015. The current usage metrics is available 48-96 hours after online publication and is updated daily on week days.
Initial download of the metrics may take a while.