Fig. 5
Download original image
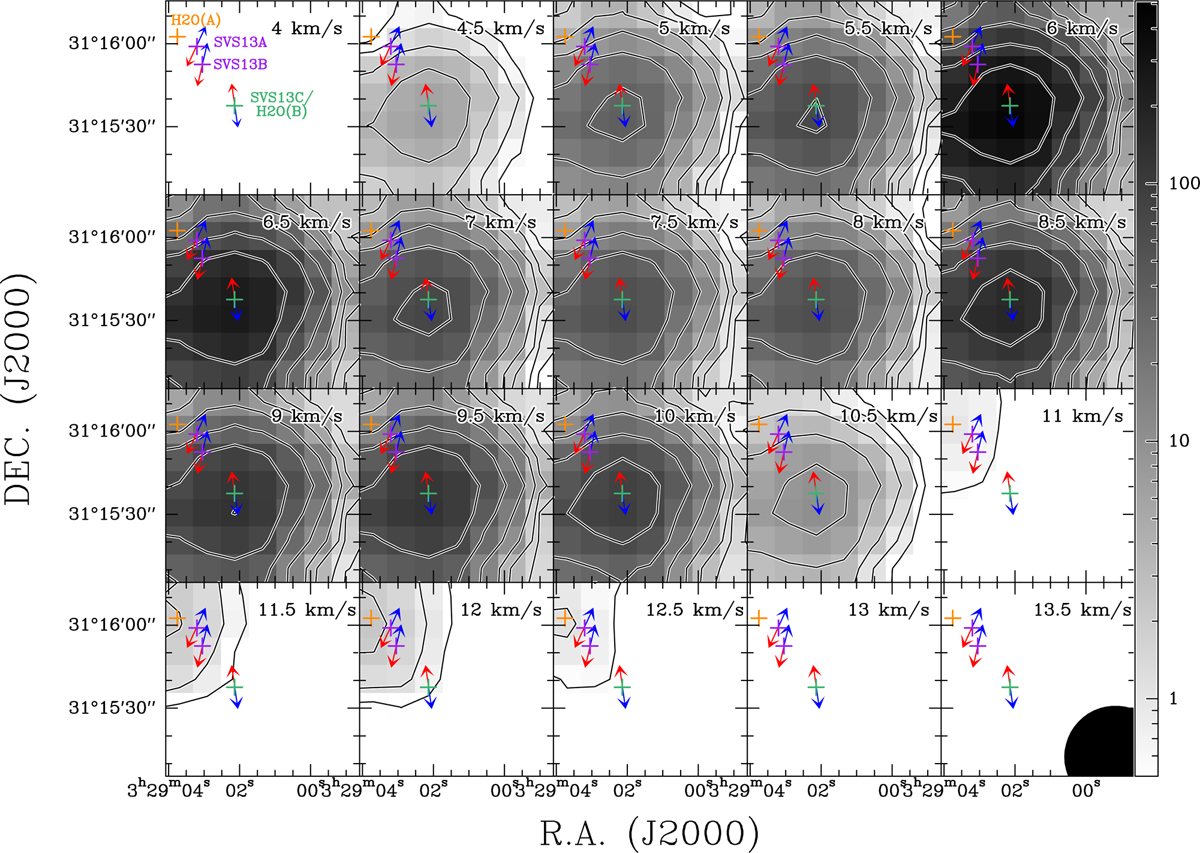
Channel maps of H2O masers in H2O(B) (SVS 13C) and V512 Per (SVS 13A). The contours start at 0.5 Jy, and then increase by a factor of two. The plus signs represent the positions of the two H2O masers (orange and green) previously detected by Haschick et al. (1980) and YSOs (purple; e.g. Plunkett et al. 2013). Based on previous observations (Plunkett et al. 2013; Podio et al. 2021), the outflow directions are indicated by red and blue arrows. The beam size is shown in the lower right corner of the last panel. The colour bar represents the flux density in units of Jy.
Current usage metrics show cumulative count of Article Views (full-text article views including HTML views, PDF and ePub downloads, according to the available data) and Abstracts Views on Vision4Press platform.
Data correspond to usage on the plateform after 2015. The current usage metrics is available 48-96 hours after online publication and is updated daily on week days.
Initial download of the metrics may take a while.