| Issue |
A&A
Volume 673, May 2023
|
|
|---|---|---|
| Article Number | L2 | |
| Number of page(s) | 5 | |
| Section | Letters to the Editor | |
| DOI | https://doi.org/10.1051/0004-6361/202346135 | |
| Published online | 27 April 2023 | |
Letter to the Editor
Survey of Orion Disks with ALMA (SODA)
II. UV-driven disk mass loss in L1641 and L1647
1
Max-Planck-Institut für Astronomie, Königstuhl 17, Heidelberg, Germany
e-mail: terwisga@mpia.de
2
Institute for Astronomy (IfA), University of Vienna, Türkenschanzstrasse 17, 1180 Vienna, Austria
Received:
13
February
2023
Accepted:
12
April
2023
Context. External far-ultraviolet (FUV) irradiation of protoplanetary disks has an important impact on their evolution and ability to form planets. However, nearby (< 300 pc) star-forming regions lack sufficiently massive young stars, while the Trapezium cluster and NGC 2024 have complicated star-formation histories and their O-type stars’ intense radiation fields (> 104 G0) destroy disks too quickly to study this process in detail.
Aims. We study disk mass loss driven by intermediate (10 − 1000 G0) FUV radiation fields in L1641 and L1647, where it is driven by more common A0- and B-type stars.
Methods. Using the large (N = 873) sample size offered by the Survey of Orion Disks with ALMA (SODA), we searched for trends in the median disk dust mass with FUV field strength across the region as a whole and in two separate regions containing a large number of irradiated disks.
Results. For radiation fields between 1 − 100 G0, the median disk mass in the most irradiated disks drops by a factor ∼2 over the lifetime of the region, while the 95th percentile of disk masses drops by a factor 4 over this range. This effect is present in multiple populations of stars, and localized in space, to within 2 pc of ionizing stars. We fitted an empirical irradiation – disk mass relation for the first time: Mdust,median = −1.3−0.13+0.14 log10(FFUV/G0) + 5.2−0.19+0.18.
Conclusions. This work demonstrates that even intermediate FUV radiation fields have a significant impact on the evolution of protoplanetary disks.
Key words: protoplanetary disks
© The Authors 2023
 Open Access article, published by EDP Sciences, under the terms of the Creative Commons Attribution License (https://creativecommons.org/licenses/by/4.0), which permits unrestricted use, distribution, and reproduction in any medium, provided the original work is properly cited.
This article is published in open access under the Subscribe to Open model.
Open access funding provided by Max Planck Society.
1. Introduction
The planetary systems known to date represent the outcome of planet formation in diverse star-forming environments. On the other hand, our understanding of the protoplanetary disks in which young planetary systems are forming is predominantly driven by observations of low-mass star-forming regions (SFRs) within 300 pc, with typically only about ∼100 young (∼1 − 10 Myr) disk-bearing stars. As such, these regions do not represent the more massive, clustered environments in which most stars form (Lada & Lada 2003; Bressert et al. 2010). The median star in the galaxy is formed in a region with a higher surface density of young stars, and – as a result of the stellar mass distribution – will be within a few parsecs of a young O- or B-type star at some point in its early life (Winter & Haworth 2022). These young, massive stars affect the survival of disks in nearby stars through photoevaporation, as shown by the presence of proplyds (O’Dell et al. 1993) and by theoretical work (e.g., Scally & Clarke 2001; Haworth et al. 2018; Concha-Ramírez et al. 2019; Emsenhuber et al. 2023). In the immediate proximity of O-type stars, extreme-ultraviolet (EUV) photons drive mass loss (for instance, within 0.3 pc of θ1 Ori C O6; Störzer & Hollenbach 1999). Far-ultraviolet (FUV) radiation takes over at larger distances and is the dominant cause of disk mass loss for lower-mass stars. Understanding the influence of more representative environments on the evolution of disks is therefore essential for connecting disk evolution to planetary system formation.
As the nearest SFR with sufficiently high surface densities and several O-type stars, the Orion A and B molecular clouds are a crucial touchstone for models of disk destruction through external photoevaporation. Several Atacama Large Millimeter/submillimeter Array (ALMA) surveys of the cold millimeter-sized dust emission from disks in the Orion Nebula Cluster (ONC; Mann et al. 2014; Eisner et al. 2018; van Terwisga et al. 2019), the σ Ori region (Ansdell et al. 2017), and NGC 2024 (van Terwisga et al. 2020) have looked for disk mass loss driven by external FUV irradiation. In the ONC, disk masses appear to decrease with proximity to the O6 star θ1 Ori C, at least within 1 pc; a decrease in detection rates and maximum disk masses is seen within 1 pc of σ Ori (O9; Maíz Apellániz et al. 2021), while any trend in NGC 2024 is ambiguous.
Interpreting these results remains challenging. All of these surveys contain relatively small numbers of stars (N ∼ 100). In the ONC, the observed disk mass effect may be due to the local history of star formation (Winter et al. 2019). The interpretation of disk mass loss due to external photoevaporation was further cast into doubt by Parker et al. (2021), whose simulations suggest that low-number statistics in the inner regions of these regions might drive the observed trend, and who do not predict a distance dependence of the disk mass due to the relative motions of stars in young clusters. More sophisticated models of young clusters by Concha-Ramírez et al. (2021, 2022) likewise suggest the ONC disks are the result of ongoing star formation and dispersal through the cluster. Additionally, in environments like the ONC, the typically assumed relations between disk luminosity and mass – which imply optically thin dust emission with disk radii of ∼60 AU and low midplane temperatures of 20 K – almost certainly do not apply (Haworth 2021).
In this Letter, we study the impact of intermediate FUV radiation fields (10 − 1000 G0, where G0 is the Habing radiation field1) on the luminosity of a large sample of protoplanetary disks at millimeter wavelengths in L1641 and L1647. Unlike the regions studied so far, in this part of Orion A surface densities are lower (∼10 − 100 pc−2), ionization is primarily driven by A0- and B-type stars, and it is thus less efficient, meaning disks are not completely destroyed by 1 Myr. The age structure is less ambiguous thanks to existing Gaia observations (Kounkel et al. 2018; Zari et al. 2019). To compensate for the weaker expected effect, we rely on the large number (N = 873) of disk-bearing stars characterized with ALMA in the Survey of Orion Disks with ALMA (SODA) by van Terwisga et al. (2022). Thus, we can provide an unbiased view of the importance of external UV-driven evolution of disks in such – very common – environments for the first time.
2. Methods
The input data for this Letter consist of the SODA catalog of disk masses along the southern part of the Orion A cloud, from L1641 to L1647, covering more than 50 pc in length. This survey, the largest of its kind so far, observed the millimeter-continuum flux of 873 protoplanetary disk candidates, identified by Megeath et al. (2012) based on Spitzer photometry. It is unresolved (with 1.4″ resolution) but deep, with an rms of 0.08 mJy beam−1 or 1.5 M⊕ at the 4σ level. For an in-depth discussion of the data processing and the catalog itself, readers can refer to van Terwisga et al. (2022).
We combined this survey with a catalog of stars sufficiently hot and luminous to drive external photoevaporation, with spectral types A0 or earlier, and sufficiently close (with distances 300 − 475 pc) to be associated with the Orion molecular cloud (Großschedl et al. 2018, 2021). The distance uncertainties for these stars tend to be large as Gaia data for stars of these magnitudes tend to be of low quality. We therefore limited ourselves to projected separations.
To estimate the candidate ionizing stars’ FUV luminosity, we used BHAC-15 isochrones (Baraffe et al. 2015) and integrated the Castelli and Kurucz model spectra (Castelli & Kurucz 2003) of stars of similar effective temperatures between 911.6 and 2066 Å. We did not take interstellar extinction into account given the uncertain geometry. Stars beyond 10 pc from a given disk were not included in the calculation. We assumed a minimum interstellar FUV flux of 1 G0. The total irradiation per source in the SODA sample was calculated by adding the contribution of all O, B, and A0 stars within 10 pc of each disk after diluting their emission for the projected separation at the distance of each disk-bearing star. For these distances, we made the same assumptions as in van Terwisga et al. (2022), and thus followed the large-scale cloud structure from Großschedl et al. (2018).
For each Class II source in SODA, Fig. 1 shows the calculated incident external FUV flux. It reaches 103 G0 in the proximity of the NGC 1980 and L1641-S clusters, but falls to the standard 1 G0 in the southernmost parts of L1647. All intermediate FUV regimes are well sampled, but it is clear that massive stars are not distributed equally through the cloud. Interestingly, in L1641-S, L1641-N, and NGC 1980, which contain the most irradiated disk samples, the most massive disks (indicated with orange circles) appear to be less common even by eye. In the following sections, we investigate this observation systematically.
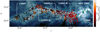 |
Fig. 1. External FUV flux estimated for the SODA sample. Crosses indicate the positions of Class II disks in the SODA catalog; the color indicates FUV irradiation. Disks with masses > 100 M⊕ based on their millimeter flux are additionally marked with orange circles. Cyan stars mark possible ionizing stars in their vicinity. Background: Herschel SPIRE observations at 250, 300, and 500 μm. |
3. Disk mass as a function of separation and irradiation
First, we investigated how the median disk dust mass depends on the UV radiation field in the simplest sense by considering only the separation to ionizing stars, as in previous work (e.g. Mann et al. 2014; Eisner et al. 2018). Following van Terwisga et al. (2022), we exploited the result that protoplanetary disk flux (and mass) distributions are well described by a log-normal distribution, with very similar widths between SFRs, but different median values. We sorted and binned disk-bearing stars by separation from the nearest ionizing stars and calculated the median mass in each bin if it has N > 20 stars. The result is shown in Fig. 2.
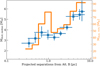 |
Fig. 2. Disk masses binned by separation to potential ionizing stars. Blue points mark the median disk mass in each bin, with error bars indicating the statistical uncertainty after fitting a log-normal distribution. The orange line shows the empirical 95th percentile of disk masses in each bin. |
Clearly, disk masses are significantly lower within 0.5 pc separation of an ionizing star, and this result holds both for the median disk mass (which differs by a factor 3 across the figure) and for the 95th percentile mass (which shows an even stronger decrease). An increase in the 95th percentile disk mass in the 0.6−1 pc range is surprising, and discussed in Sect. 4.1. Any trend beyond 0.5 pc, however, is less (statistically) clear, with the most isolated disks apparently having higher masses, corresponding to L1647.
As Fig. 1 shows, stars of different spectral types are driving external photoevaporation in L1641. Therefore, in Fig. 3 the median disk mass and the empirical 95th percentile disk mass are plotted relative to the (upper limit to the) external FFUV in units of G0. Once again, the median disk mass decreases significantly with external irradiation. By sampling from the distribution of median disk masses in each FFUV bin and their uncertainties, we found a Pearson’s r = −0.9 with  . The data are inconsistent with no correlation between disk mass and FUV irradiation.
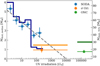 |
Fig. 3. Disk masses binned by incident FUV flux (in units of G0). Blue points show the median dust mass in each bin, with uncertainties; the empirical 95th percentile disk mass is shown as a bold, dark blue line. The gray dashed line represents an empirical fit to the relation between the median dust mass and the FUV radiation field for the SODA sample. The points in orange and green represent, for σ Ori and the ONC respectively, the median and 95% disk mass (as lines), for the central 90% of the FUV distribution in these regions. |
We were thus able to empirically fit the relation between the median disk mass and FUV radiation field strength for the first time. We find  . Surprisingly, even radiation fields of ∼10 G0 appear to affect the disk mass at the age of the Orion A disks (∼1 − 3 Myr). In the most irradiated environments probed here, disk masses have dropped by a factor 2 after this time. Once again, the most massive disks show a similar trend, with the 95th percentile of most massive disks dropping below 25 M⊕ where FFUV > 40 G0.
Figure 3 also shows the data for σ Ori (Ansdell et al. 2017) and the ONC (Eisner et al. 2018). Strikingly, σ Ori is not inconsistent with the trend. The ONC, on the other hand, has significantly higher disk masses, restating the proplyd lifetime problem, however, for more details readers can refer to Winter et al. (2019).
4. Discussion
Having found a loss of disk mass with proximity to B- and A0-type stars in the southern part of Orion A opens the door to studying the link between FUV irradiation and disk evolution more generally. Two key questions are the universality and the physics behind the observed trend. We discuss these questions here.
4.1. Disk mass and FUV irradiation across the survey area
As shown in Fig. 1, L1641-N and L1641-S contain the most irradiated disks in the sample. In Fig. 4 these two subsamples are separated. L1641-S contains stars between 211.5° < ℓ≤213.5°, while L1641-N has all disks in the SODA catalog with ℓ > 211.5°. Both regions are consistent with the empirical trend derived for the full sample. The limited range of FFUV sampled in L1641-S makes it difficult to statistically identify a trend in median disk mass. The increase in the 95th percentile disk mass at 10 G0 in L1641-S is notable. This subsample is also responsible for an increase in the 95th percentile disk mass in Fig. 2 around 0.6−1 pc. This is not seen in the median disk mass, so the responsible sources are outliers, related to younger populations to either side of L1641-S (see van Terwisga et al. 2022, Fig. 9).
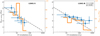 |
Fig. 4. Disk masses binned by incident FUV flux (in units of G0) for L1641-S (defined as disks between 211.5° < ℓ≤213.5°) and L1641-N (ℓ > 211.5°). Blue points show median dust masses in each bin, with uncertainties; the empirical 95th percentile disk mass is shown in orange. The dashed lines show the empirical relationship derived for the full sample in Fig. 3. |
In L1641-N, the trend is significant. In the more irradiated regimes in L1641-N, the disk mass (both median and 95th percentile) may be higher than elsewhere in L1641. This could be a consequence of the possibly complicated age-distance structure in L1641-N: van Terwisga et al. (2022) found a lower disk mass caused by an older (foreground) population in the direction of L1641-N as a whole, potentially linked to the location of the older NGC 1980 cluster (Alves & Bouy 2012; Zari et al. 2019). However, this older population extends over a much larger region than the 0.5 pc sphere of influence of most A0- and B-type stars in the sample.
4.2. Driving local disk mass loss in L1641 and L1647
After correcting for larger-scale trends in stellar age (and, thus, disk mass), we observed that the FUV field strength is correlated with decreasing disk mass. While age is clearly the primary driver of disk mass evolution, FUV irradiation is an important secondary effect. This conclusion is strengthened because our result does not rely on data for a single ionizing star, as discussed in the previous paragraph. To the extent that L1641-N is a less pristine sample, we should expect older disks to be less massive overall, and weaken the imprint of external photoevaporation. This may explain the shape of the trend beyond FFUV > 100 G0, although this is difficult to say definitively without a larger sample in this irradiation regime.
Apart from large-scale age gradients, a second confounding effect is the external heating of disks near massive stars. This was simulated for a representative sample of disks in Haworth (2021). Even in the radiation regimes discussed here, more irradiated disks are hotter than the 20 K effective dust temperature we assumed. This is further enhanced by the truncation of the most irradiated disks due to the inside-out disk destruction in FUV-dominated regimes (e.g. Haworth et al. 2018; Eisner et al. 2018). The net consequence of this is again a flattening of the relation between disk mass and FUV radiation field.
Likewise, we can only plot median disk masses for stars that still bear disks. If the disk is lost completely – either due to internal evolution alone, or in combination with external irradiation-driven mass loss – we did not include the star in our targets. This lowers our sensitivity, although this is compensated for, to some extent, by the fact that inner disks are difficult to destroy in these radiation regimes (Haworth et al. 2018).
So far, we have ignored interstellar absorption and the 3D structure of the cloud. While the Class II disks in this sample are no longer shielded by envelopes, they are close to the cloud (see, for instance, the discussion in Kainulainen et al. 2017). This, as well as the large uncertainties in the 3D separation between the disks and the A0- and B-type stars, will only increase the scatter in each bin, and cannot drive the trend we observe.
This result allows us to constrain the physics of disk destruction. We observed the continuum emission from millimeter-sized dust grains in these disks, which are located in the disk midplane at very low scale heights (e.g., Villenave et al. 2020, 2022). External irradiation preferentially acts on the surface layers and outer parts of the disk, which are not well traced by these grains. However, millimeter-continuum emission is tightly correlated with the radial extent of the continuum emission (e.g. Tripathi et al. 2017; Andrews et al. 2018). If external photoevaporation primarily drives an outside-in disk destruction, we can understand our observations as being caused by a shrinking disk radius at millimeter wavelengths. Ultimately, resolved ALMA observations of the dust and the bulk gas, as traced by 12CO and CI in these irradiated environments, are needed to definitively understand the interaction between UV-driven mass loss and dust particles in these disks.
The disk population in the σ Ori SFR is probably the most comparable to the disks studied here. Its radiation field is primarily due to a single O9 star (σ Ori Aa), and, as such, it is more uniform and somewhat stronger than the environments studied here, while the disk population is likely to be slightly older (3 − 5 Myr; Oliveira et al. 2004) than ours (1 − 3 Myr; Da Rio et al. 2016). The sample is too small to follow the evolution of the median disk mass, but Fig. 6 of Ansdell et al. (2017) suggests the same behavior reported here, with the detection fraction and mass of the most massive disks dropping at separations < 2 pc. As shown in Fig. 3, averaging over the region, σ Ori supports the conclusion that FUV-driven disk mass loss has a measurable impact on disks in the vicinity even of A0- and B-type stars.
5. Conclusions
The impact of external FUV irradiation on the evolution of protoplanetary disks provides important constraints on the potential for planet formation in many stars in the galaxy. Using the SODA survey (van Terwisga et al. 2022), which contains a large (N = 873) sample of Class II disks in Orion, in a variety of intermediate irradiation regimes (1 − 1000 G0), we can for the first time study the evolution of the median disk dust mass, as traced by ALMA continuum observations.
Our data support the interpretation that FUV irradiation can – even in this regime – significantly affect the evolution of disks, with disks losing a factor ∼2 in mass over two orders of magnitude in FUV field strength, and we fitted an empirical relation between disk mass and irradiation for the first time. While the environments studied here are much less extreme than for example the ONC, A0- and B-type stars are relatively common and similar radiation fields are encountered by a large fraction of young stars even in the Solar neighborhood (Winter & Haworth 2022). This emphasizes the need for planet population syntheses to take this process into account, as well as resolved studies of the disks in these radiation environments, in order to link the observed exoplanet population to the well-studied nearby protoplanetary disks.
G0 = 1.6 × 10⁻³ erg cm−2 s−1 (Habing 1968).
Acknowledgments
We thank the anonymous referee for insightful comments which helped improve the quality of this Letter. This Letter makes use of the following ALMA data: ADS/JAO.ALMA#2019.1.01813.S. ALMA is a partnership of ESO (representing its member states), NSF (USA) and NINS (Japan), together with NRC (Canada), MOST and ASIAA (Taiwan), and KASI (Republic of Korea), in cooperation with the Republic of Chile. The Joint ALMA Observatory is operated by ESO, AUI/NRAO and NAOJ. This project has received funding from the European Research Council (ERC) under the European Union’s Horizon 2020 research and innovation programme (Grant agreement No. 851435)
References
- Alves, J., & Bouy, H. 2012, A&A, 547, A97 [NASA ADS] [CrossRef] [EDP Sciences] [Google Scholar]
- Andrews, S. M., Terrell, M., Tripathi, A., et al. 2018, ApJ, 865, 157 [Google Scholar]
- Ansdell, M., Williams, J. P., Manara, C. F., et al. 2017, AJ, 153, 240 [Google Scholar]
- Baraffe, I., Homeier, D., Allard, F., & Chabrier, G. 2015, A&A, 577, A42 [NASA ADS] [CrossRef] [EDP Sciences] [Google Scholar]
- Bressert, E., Bastian, N., Gutermuth, R., et al. 2010, MNRAS, 409, L54 [NASA ADS] [Google Scholar]
- Castelli, F., & Kurucz, R. L. 2003, in Modelling of Stellar Atmospheres, eds. N. Piskunov, W. W. Weiss, & D. F. Gray, 210, A20 [Google Scholar]
- Concha-Ramírez, F., Wilhelm, M. J. C., Portegies Zwart, S., & Haworth, T. J. 2019, MNRAS, 490, 5678 [CrossRef] [Google Scholar]
- Concha-Ramírez, F., Wilhelm, M. J. C., Portegies Zwart, S., van Terwisga, S. E., & Hacar, A. 2021, MNRAS, 501, 1782 [Google Scholar]
- Concha-Ramírez, F., Wilhelm, M. J. C., & Zwart, S. P. 2022, MNRAS, 520, 6159 [Google Scholar]
- Da Rio, N., Tan, J. C., Covey, K. R., et al. 2016, ApJ, 818, 59 [Google Scholar]
- Eisner, J. A., Arce, H. G., Ballering, N. P., et al. 2018, ApJ, 860, 77 [CrossRef] [Google Scholar]
- Emsenhuber, A., Burn, R., Weder, J., et al. 2023, A&A, in press, https://doi.org/10.1051/0004-6361/202244767 [Google Scholar]
- Großschedl, J. E., Alves, J., Meingast, S., et al. 2018, A&A, 619, A106 [Google Scholar]
- Großschedl, J. E., Alves, J., Meingast, S., & Herbst-Kiss, G. 2021, A&A, 647, A91 [NASA ADS] [CrossRef] [EDP Sciences] [Google Scholar]
- Habing, H. J. 1968, Bull. Astron. Inst. Neth., 19, 421 [Google Scholar]
- Haworth, T. J. 2021, MNRAS, 503, 4172 [NASA ADS] [CrossRef] [Google Scholar]
- Haworth, T. J., Clarke, C. J., Rahman, W., Winter, A. J., & Facchini, S. 2018, MNRAS, 481, 452 [NASA ADS] [CrossRef] [Google Scholar]
- Kainulainen, J., Stutz, A. M., Stanke, T., et al. 2017, A&A, 600, A141 [NASA ADS] [CrossRef] [EDP Sciences] [Google Scholar]
- Kounkel, M., Covey, K., Suárez, G., et al. 2018, AJ, 156, 84 [NASA ADS] [CrossRef] [Google Scholar]
- Lada, C. J., & Lada, E. A. 2003, ARA&A, 41, 57 [Google Scholar]
- Maíz Apellániz, J., Barbá, R. H., Fariña, C., et al. 2021, A&A, 646, A11 [NASA ADS] [CrossRef] [EDP Sciences] [Google Scholar]
- Mann, R. K., Di Francesco, J., Johnstone, D., et al. 2014, ApJ, 784, 82 [NASA ADS] [CrossRef] [Google Scholar]
- Megeath, S. T., Gutermuth, R., Muzerolle, J., et al. 2012, AJ, 144, 192 [NASA ADS] [CrossRef] [Google Scholar]
- O’Dell, C. R., Wen, Z., & Hu, X. 1993, ApJ, 410, 696 [CrossRef] [Google Scholar]
- Oliveira, J. M., Jeffries, R. D., & van Loon, J. T. 2004, MNRAS, 347, 1327 [NASA ADS] [CrossRef] [Google Scholar]
- Parker, R. J., Alcock, H. L., Nicholson, R. B., Panić, O., & Goodwin, S. P. 2021, ApJ, 913, 95 [NASA ADS] [CrossRef] [Google Scholar]
- Scally, A., & Clarke, C. 2001, MNRAS, 325, 449 [NASA ADS] [CrossRef] [Google Scholar]
- Störzer, H., & Hollenbach, D. 1999, ApJ, 515, 669 [CrossRef] [Google Scholar]
- Tripathi, A., Andrews, S. M., Birnstiel, T., & Wilner, D. J. 2017, ApJ, 845, 44 [Google Scholar]
- van Terwisga, S. E., Hacar, A., & van Dishoeck, E. F. 2019, A&A, 628, A85 [NASA ADS] [CrossRef] [EDP Sciences] [Google Scholar]
- van Terwisga, S. E., van Dishoeck, E. F., Mann, R. K., et al. 2020, A&A, 640, A27 [NASA ADS] [CrossRef] [EDP Sciences] [Google Scholar]
- van Terwisga, S. E., Hacar, A., van Dishoeck, E. F., Oonk, R., & Portegies Zwart, S. 2022, A&A, 661, A53 [NASA ADS] [CrossRef] [EDP Sciences] [Google Scholar]
- Villenave, M., Ménard, F., Dent, W. R. F., et al. 2020, A&A, 642, A164 [EDP Sciences] [Google Scholar]
- Villenave, M., Stapelfeldt, K. R., Duchêne, G., et al. 2022, ApJ, 930, 11 [NASA ADS] [CrossRef] [Google Scholar]
- Winter, A. J., & Haworth, T. J. 2022, Eur. Phys. J. Plus, 137, 1132 [NASA ADS] [CrossRef] [Google Scholar]
- Winter, A. J., Clarke, C. J., Rosotti, G. P., Hacar, A., & Alexander, R. 2019, MNRAS, 490, 5478 [NASA ADS] [CrossRef] [Google Scholar]
- Zari, E., Brown, A. G. A., & de Zeeuw, P. T. 2019, A&A, 628, A123 [NASA ADS] [CrossRef] [EDP Sciences] [Google Scholar]
All Figures
|
Fig. 1. External FUV flux estimated for the SODA sample. Crosses indicate the positions of Class II disks in the SODA catalog; the color indicates FUV irradiation. Disks with masses > 100 M⊕ based on their millimeter flux are additionally marked with orange circles. Cyan stars mark possible ionizing stars in their vicinity. Background: Herschel SPIRE observations at 250, 300, and 500 μm. |
| In the text | |
|
Fig. 2. Disk masses binned by separation to potential ionizing stars. Blue points mark the median disk mass in each bin, with error bars indicating the statistical uncertainty after fitting a log-normal distribution. The orange line shows the empirical 95th percentile of disk masses in each bin. |
| In the text | |
|
Fig. 3. Disk masses binned by incident FUV flux (in units of G0). Blue points show the median dust mass in each bin, with uncertainties; the empirical 95th percentile disk mass is shown as a bold, dark blue line. The gray dashed line represents an empirical fit to the relation between the median dust mass and the FUV radiation field for the SODA sample. The points in orange and green represent, for σ Ori and the ONC respectively, the median and 95% disk mass (as lines), for the central 90% of the FUV distribution in these regions. |
| In the text | |
|
Fig. 4. Disk masses binned by incident FUV flux (in units of G0) for L1641-S (defined as disks between 211.5° < ℓ≤213.5°) and L1641-N (ℓ > 211.5°). Blue points show median dust masses in each bin, with uncertainties; the empirical 95th percentile disk mass is shown in orange. The dashed lines show the empirical relationship derived for the full sample in Fig. 3. |
| In the text | |
Current usage metrics show cumulative count of Article Views (full-text article views including HTML views, PDF and ePub downloads, according to the available data) and Abstracts Views on Vision4Press platform.
Data correspond to usage on the plateform after 2015. The current usage metrics is available 48-96 hours after online publication and is updated daily on week days.
Initial download of the metrics may take a while.