| Issue |
A&A
Volume 696, April 2025
|
|
|---|---|---|
| Article Number | C3 | |
| Number of page(s) | 2 | |
| Section | Letters to the Editor | |
| DOI | https://doi.org/10.1051/0004-6361/202554469e | |
| Published online | 04 April 2025 | |
Letter to the Editor
Survey of Orion Disks with ALMA (SODA)
II. UV-driven disk mass loss in L1641 and L1647 (Corrigendum)
1
Space Research Institute, Austrian Academy of Sciences, Schmiedlstr. 6, 8042 Graz, Austria
2
Institute for Astronomy (IfA), University of Vienna, Türkenschanzstrasse 17, A-1180 Vienna, Austria
⋆ Corresponding author; This email address is being protected from spambots. You need JavaScript enabled to view it.
Key words: errata / addenda / protoplanetary disks
1. Introduction
We report an error in the calculation of the median disk masses reported for binned data in van Terwisga & Hacar (2023). This error led us to overestimate the median disk masses in each bin, which resulted in a positive offset in the trend reported in that paper. The description of the methods and the primary conclusion, that the median disk mass decreases in stronger external far-UV (FUV) fields, do not change qualitatively. The decrease remains significant and has the same slope (to within the uncertainties); only the intercept changes. The reported trend is updated here: the correct relation is  . Figures 2, 3, and 4 in the original paper, which are affected by this calculation error, are also updated here.
2. Statistical reanalysis
While reanalyzing the data, we identified an error in the Python code used to calculate the median disk mass in the binned data presented in Figures 2–4 of the original paper. The correct analysis assumes an underlying log-normal distribution and uses upper limits for the non-detections. To calculate these values, we took the observed (including upper limits) data and fit a log-normal distribution using the lifelines package (Davidson-Pilon 2019). When fitting with lifelines, the proper treatment of the upper limits means equal weight is given to any result that falls between the upper limit and zero in the minimization of the negative log-likelihood of the fitted distribution.
However, in the original paper, upper limits were erroneously counted as detected sources. As a result of this, given the low detection rate over the sample as a whole (58%, van Terwisga et al. 2022), the inferred median values of the disk mass distribution in each bin were overestimated compared to the true value of the underlying distribution. This also led to an underestimate of the uncertainty on the inferred medians (of about 5 − 10%) This error therefore does not affect the 95th percentile values also presented in the paper, which are a purely empirical observable (the 95th percentile in disk mass is always detected).
Here we present updated versions of Figs. 2–4 that take these corrections into account. Figure 1 (Fig. 2 in the original paper) shows essentially the same trend, but with an offset. In Figure 2 (Fig. 3 in the original paper), we show the correct values for the disk mass – FUV flux relation. As before, we find a Pearson’s r = −0.9 and  for these data. We fit, using the same methods, a trend with the same slope (to within the uncertainty) but with a different (lower) offset between the median disk mass and the FUV irradiation in each bin:
  .
.
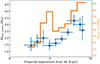 |
Fig. 1. Disk masses binned by separation from potential ionizing stars. Blue points mark the median disk mass in each bin, with error bars indicating the statistical uncertainty after fitting a log-normal distribution. The orange line shows the empirical 95th percentile of disk masses in each bin. |
In Figure 3 (Fig. 4 in the original problem), it is apparent that the contrast between the northern and southern subsamples (see van Terwisga & Hacar 2023 for their definition, which has not been updated) is now less pronounced; neither subsample has a significant relation between the median disk mass and FUV field strength. In this case, the trend in L1641/N is no longer significant. The cause for this is likely the (small) increase in the median disk mass uncertainty.
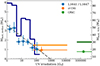 |
Fig. 2. Disk masses binned by incident FUV flux (in units of G0). Blue points show the median dust mass in each bin, with uncertainties; the empirical 95th percentile disk mass is shown as a bold, dark blue line. The dashed gray line represents an empirical fit to the relation between the median dust mass and the FUV radiation field for the Survey of Orion Disks with ALMA (SODA) sample. The points in orange and green represent, for σ Ori and the Orion Nebula Cluster (ONC) respectively, the median and 95% disk mass (as lines), for the central 90% of the FUV distribution in these regions. |
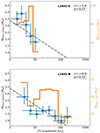 |
Fig. 3. Disk masses binned by incident FUV flux (in units of G0) for L1641-S (defined as disks between 211.5° ℓ213.5°) and L1641-N (ℓ > 211.5°). Blue points show the median dust masses in each bin, with uncertainties; the empirical 95th percentile disk mass is shown in orange. The dashed lines show the empirical relationship derived for the full sample in Fig. 2. |
However, neither subsample is inconsistent with the disk mass – FUV field relation as derived for the full population. For the purposes of clarity, the binning has been revised to give more bins at lower FUV fluxes in this figure; this does not affect the significance of the trends presented.
References
- Davidson-Pilon, C. 2019, Journal of Open Source Software, 4, 1317 [Google Scholar]
- van Terwisga, S. E., & Hacar, A. 2023, A&A, 673, L2 [CrossRef] [EDP Sciences] [Google Scholar]
- van Terwisga, S. E., Hacar, A., van Dishoeck, E. F., Oonk, R., & Portegies Zwart, S. 2022, A&A, 661, A53 [NASA ADS] [CrossRef] [EDP Sciences] [Google Scholar]
© The Authors 2025
 Open Access article, published by EDP Sciences, under the terms of the Creative Commons Attribution License (https://creativecommons.org/licenses/by/4.0), which permits unrestricted use, distribution, and reproduction in any medium, provided the original work is properly cited.
This article is published in open access under the Subscribe to Open model. This email address is being protected from spambots. You need JavaScript enabled to view it. to support open access publication.
All Figures
|
Fig. 1. Disk masses binned by separation from potential ionizing stars. Blue points mark the median disk mass in each bin, with error bars indicating the statistical uncertainty after fitting a log-normal distribution. The orange line shows the empirical 95th percentile of disk masses in each bin. |
| In the text | |
|
Fig. 2. Disk masses binned by incident FUV flux (in units of G0). Blue points show the median dust mass in each bin, with uncertainties; the empirical 95th percentile disk mass is shown as a bold, dark blue line. The dashed gray line represents an empirical fit to the relation between the median dust mass and the FUV radiation field for the Survey of Orion Disks with ALMA (SODA) sample. The points in orange and green represent, for σ Ori and the Orion Nebula Cluster (ONC) respectively, the median and 95% disk mass (as lines), for the central 90% of the FUV distribution in these regions. |
| In the text | |
|
Fig. 3. Disk masses binned by incident FUV flux (in units of G0) for L1641-S (defined as disks between 211.5° ℓ213.5°) and L1641-N (ℓ > 211.5°). Blue points show the median dust masses in each bin, with uncertainties; the empirical 95th percentile disk mass is shown in orange. The dashed lines show the empirical relationship derived for the full sample in Fig. 2. |
| In the text | |
Current usage metrics show cumulative count of Article Views (full-text article views including HTML views, PDF and ePub downloads, according to the available data) and Abstracts Views on Vision4Press platform.
Data correspond to usage on the plateform after 2015. The current usage metrics is available 48-96 hours after online publication and is updated daily on week days.
Initial download of the metrics may take a while.