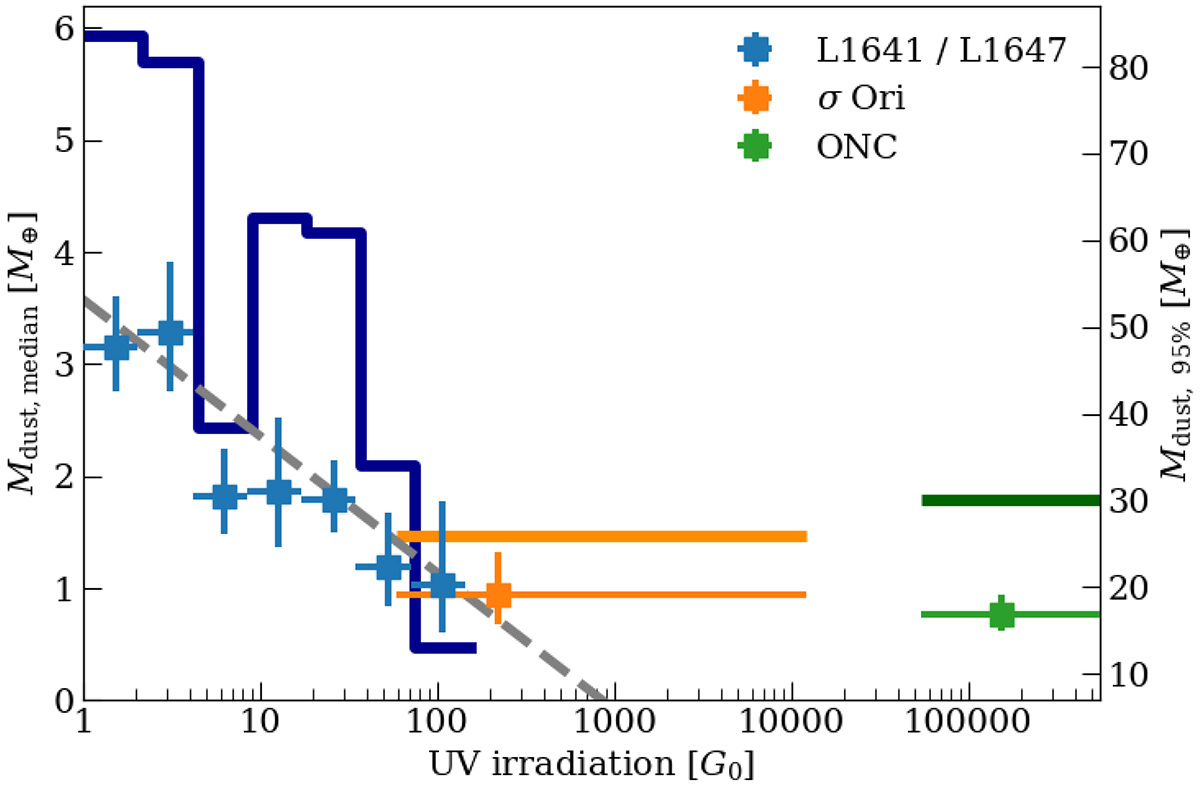
Fig. 2.
Download original image
Disk masses binned by incident FUV flux (in units of G0). Blue points show the median dust mass in each bin, with uncertainties; the empirical 95th percentile disk mass is shown as a bold, dark blue line. The dashed gray line represents an empirical fit to the relation between the median dust mass and the FUV radiation field for the Survey of Orion Disks with ALMA (SODA) sample. The points in orange and green represent, for σ Ori and the Orion Nebula Cluster (ONC) respectively, the median and 95% disk mass (as lines), for the central 90% of the FUV distribution in these regions.
Current usage metrics show cumulative count of Article Views (full-text article views including HTML views, PDF and ePub downloads, according to the available data) and Abstracts Views on Vision4Press platform.
Data correspond to usage on the plateform after 2015. The current usage metrics is available 48-96 hours after online publication and is updated daily on week days.
Initial download of the metrics may take a while.