Open Access
Fig. 5
Download original image
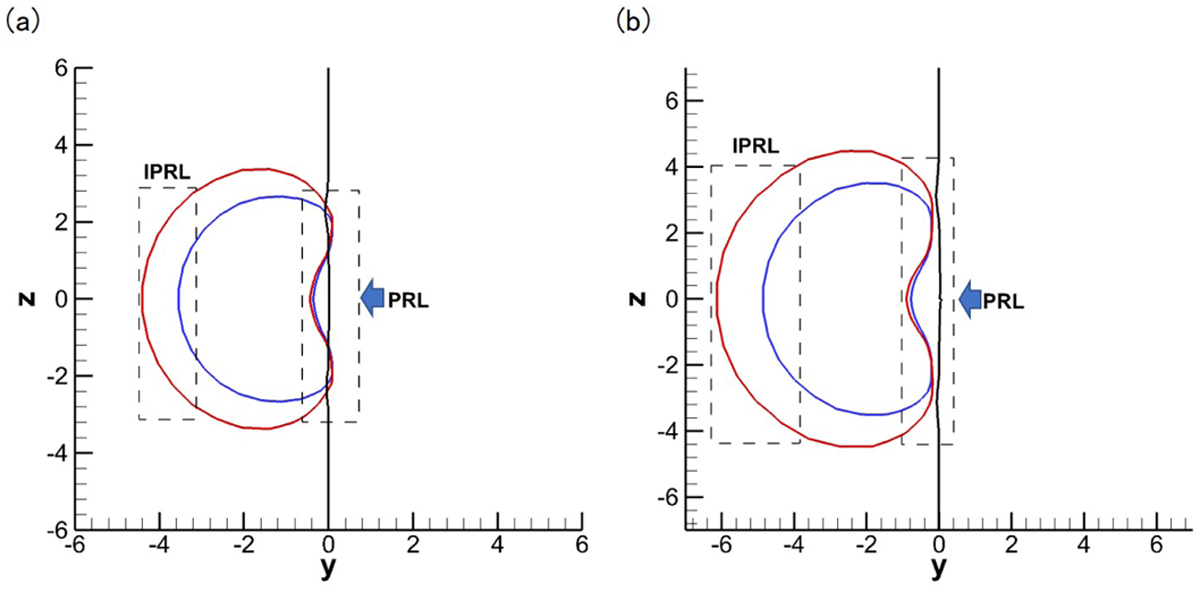
Iso-gram of Bx = 0 in the Y–Z plane at X = −2 RM (a) and −4 RM (b). Different line colors represent different settings of the Parker spiral angle: 90° (black), 56° (red), and 30° (blue).
Current usage metrics show cumulative count of Article Views (full-text article views including HTML views, PDF and ePub downloads, according to the available data) and Abstracts Views on Vision4Press platform.
Data correspond to usage on the plateform after 2015. The current usage metrics is available 48-96 hours after online publication and is updated daily on week days.
Initial download of the metrics may take a while.