| Issue |
A&A
Volume 671, March 2023
|
|
|---|---|---|
| Article Number | A138 | |
| Number of page(s) | 13 | |
| Section | Planets and planetary systems | |
| DOI | https://doi.org/10.1051/0004-6361/202245521 | |
| Published online | 17 March 2023 | |
Observability of silicates in volatile atmospheres of super-Earths and sub-Neptunes
Exploring the edge of the evaporation desert
1
Leiden Observatory, Leiden University,
Niels Bohrweg 2,
2333CA
Leiden, The Netherlands
e-mail: This email address is being protected from spambots. You need JavaScript enabled to view it.
2
SRON Netherlands Institute for Space Research,
Niels Bohrweg 4,
2333 CA
Leiden, The Netherlands
Received:
21
November
2022
Accepted:
12
January
2023
Abstract
Many of the confirmed short-period super-Earths and smaller sub-Neptunes are sufficiently irradiated for the surface silicates to be sustained in a long-lasting molten state. While there is no direct evidence of magma ocean influence on exoplanets, theory suggests that, due to outgassing and diverse evolution paths, a wide range of resulting atmospheric compositions should be possible. Atmospheric contamination caused by the outgassing of the underlying magma ocean is potentially detectable using low-resolution spectroscopy. The James Webb Space Telescope provides the necessary spectral coverage and sensitivity to characterise smaller planets, including lava worlds. In light of this, we assess the observability of outgassed silicates submerged in volatile atmospheres on the edge of the evaporation valley. By placing a hypothetical 2 R⊕ planet around a Sun-like star, we self-consistently model in 1D a wide range of potential atmospheric compositions, including thermal structure and outgassing. We focus on atmospheres rich in H, C, and N. We assess the diverse chemistry of silicates and volatiles, and what features of outgassed species could be detected via emission spectroscopy using MIRI LRS. Results indicate that even for substantial volatile envelopes, strong in infrared opacity, the presence of silicates causes deep thermal inversions that affect emission. Similar to pure lava worlds, SiO remains the only outgassed species with major infrared bands at 5 and 9 µm. However, even a small amount of volatiles, especially of H2O and H−, may hinder its observability. We also find that the C/O ratio plays a large role in determining the abundance of SiO. Detecting SiO on a strongly irradiated planet could indicate an atmosphere with high metallicity and a low C/O ratio, which may be a result of efficient interaction between the atmosphere and the underlying melt.
Key words: planets and satellites: atmospheres / planets and satellites: terrestrial planets / techniques: spectroscopic
© The Authors 2023
 Open Access article, published by EDP Sciences, under the terms of the Creative Commons Attribution License (https://creativecommons.org/licenses/by/4.0), which permits unrestricted use, distribution, and reproduction in any medium, provided the original work is properly cited.
This article is published in open access under the Subscribe to Open model. This email address is being protected from spambots. You need JavaScript enabled to view it. to support open access publication.
1 Introduction
Ever since their discovery, there has been great interest in trying to characterise and unravel the mysteries of the seemingly ambiguous super-Earths and sub-Neptunes. Although more massive Neptune-like planets are expected to retain most of the primordial H/He, intermediate (1.5–2.5 R⊕) and smaller worlds are likely to be extremely diverse in their atmospheric composition and structure. Figure 1 showcases the population of close-in planets.
Rocky worlds occupying the edge of the evaporation desert are shaped by erosion, accretion, degassing, and volcanism; some of them possibly form long-lasting secondary atmospheres (Elkins-Tanton & Seager 2008). Because of such close proximity to the star, many of the planets likely end up as bare rocks with no visible atmospheric component. Observations of several temperate and hot super-Earths seem to favour this theory (Kreidberg et al. 2019; Zieba et al. 2022; Crossfield et al. 2022). However, even without an insulating atmosphere, they have temperatures high enough to engulf the dayside of the planet with magma oceans, which should result in tenuous but observable silicate envelopes (Schaefer & Fegley 2009; Miguel et al. 2011; Ito et al. 2015; Kite et al. 2016; Zilinskas et al. 2022). For such worlds, SiO and SiO2 have been proposed as the primary species that could be probed via infrared emission (Ito et al. 2015; Nguyen et al. 2020; Zilinskas et al. 2022). It is also feasible that high-mean-molecular-weight species can survive erosion, leaving denser CO or N2 atmospheres intact (Zilinskas et al. 2020). A super-Earth 55 Cnc e may be a primary example of this (Demory et al. 2016; Angelo & Hu 2017; Hammond & Pierrehumbert 2017). While studies indicate that planets below ≲2.0 R⊕ are likely stripped of H2 (Rogers & Owen 2021), new interior models show that magma-atmosphere interaction during evolution could lead to large reservoirs of H2O, buffering H2O atmospheres, which, due to thermal and photochemical dissociation, should result in abundant H2 as a by-product (Kite & Schaefer 2021; Dorn & Lichtenberg 2021). The only outstanding weakness of the proposed theory is the efficiency of the interaction between the melt and the atmosphere.
Going to larger radii (above 2.0 R⊕), the observed discrepancy of densities may indicate the existence of water-ocean planets that are shrouded in dense steam atmospheres (Zeng et al. 2019; Mousis et al. 2020; Nixon & Madhusudhan 2021; Bean et al. 2021). Insulation on sub-Neptunes is also expected to allow for deep magma oceans to be sustained indefinitely (Kite et al. 2020). Just as with smaller planets, depending on the efficiency of the magma-vapour interaction and atmospheric mixing, it could result in H2- or H2O-rich envelopes that are heavily contaminated by silicate species (Schlichting & Young 2022; Kite et al. 2020).
Observations with JWST will provide the necessary constraints for the ongoing theoretical work. Extended H2 atmospheres of larger super-Earths and sub-Neptunes with substantial scale heights are easily probed via transmission spectroscopy (Hu et al. 2021b). For intermediate and smaller planets, measuring emission of the dayside may prove to be the only viable characterisation method. However, even with JWST, characterising the chemistry of potential atmospheres will be challenging, detecting silicates even more so. From an observer’s standpoint, finding whether these planets have atmospheres at all is a major stepping stone in the field of exoplanets.
In this work we explore the chemistry and observability of outgassed silicates in volatile envelopes of irradiated rocky worlds. The highlighted region in Fig. 1 roughly indicates the parameter space applicable to this work. In contrast to studies done by Kite et al. (2020), Kite & Schaefer (2021), and Schlichting & Young (2022), we do not model substantial atmospheres, but focus on cases where the surface pressure is relatively low in comparison to Neptune-like planets (< 10 bar). We make use of consistent outgassing equilibrium and radiative-transfer models to predict what silicate features are potentially characterisable through infrared emission spectroscopy, especially at wavelengths relevant for the JWST MIRI instrument. Finding signs of silicates could hint at an underlying magma ocean, allowing us to put better constraints on the proposed diversity of super-Earths and sub-Neptunes.
The paper is structured as follows. Section 2 contains the description of our approach in constructing 1D self-consistent atmospheric models, including chemistry and thermal structure. The analysis of the results is given in Sect. 3. We discuss some of the important factors that may affect observability in Sect. 4, and conclude in Sect. 5.
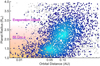 |
Fig. 1 Short-period exoplanets with radii <4 R⊕. Coloured symbols indicate confirmed planets; grey symbols are candidate planets from the Kepler, K2, and TESS missions. The colour value of confirmed planets represents the density of the occurrence rate, which peaks at two distinct radii (1.5 and 2.4 R⊕), seemingly separating the population into super-Earths and sub-Neptunes. The highlighted region roughly encompasses the parameter space applicable to our modelled cases. Shown are the evaporation desert and one of the most well-studied super-Earths, 55 Cnc e. The data is from the NASA exoplanet archive. |
2 Methods
2.1 Setting up the system
To explore observability of silicates in volatile atmospheres, we set up a grid of models that represent a typical super-Earth or a sub-Neptune orbiting a Sun-like star. We focused on intermediate pressure envelopes in the range 1–10 bar. Our models focus on cases where the surface temperature is higher than 1400 K, which is enough for magma oceans to form and to influence the atmospheric composition. For a G-type star and day side confined heat redistribution this typically results in a maximum orbital distance of 0.06 AU. We make use of several different codes that are set up to consistently calculate outgassing, chemical abundances, and temperature profiles, inclusive of the surface temperature. The models are then used to simulate emission spectra and expected JWST noise levels. Below we describe the approach for each of the components in more detail.
2.2 Determining the chemistry
A major assumption made in this work is that the overlying atmosphere equilibrates with the molten surface, allowing outgassing to control the abundances of all silicates, including oxygen. Since the general atmospheric compositions of super-Earths and sub-Neptunes are unknown, we took the liberty of exploring a grid of possible outcomes. These were drastically varied in metallicity, C/O ratio, volatile content, atmospheric pressure, and even internal temperature.
For volatiles we took the solar composition (Lodders et al. 2009) and adjusted its metallicity (M/H), where all of the elements except for H and O were linearly scaled. While we normally assume that oxygen abundance is determined via outgassing, to explore the differences between solar and outgassed atmospheres we also modelled cases where oxygen is set by the metallicity parameter. In addition, we varied the C/O ratio (via carbon adjustment) together with the abundance of H/He, which allowed us to carefully dictate the major molecular constituents in the atmosphere. This allowed us to explore cases where strong irradiation and large sinks of light elements (e.g. photoevaporation, dissolution) may result in high-mean-molecular-weight envelopes, dominated by CO, CO2, or even N2.
The outgassing budget was determined by the open-source code LavAtmos1 (van Buchem et al. 2022), which calculates the melt-vapour equilibrium for a given surface temperature and melt composition. To accurately determine the activity of the oxides in the melt, LavAtmos makes use of the liquid-solidus code MELTS (Ghiorso & Sack 1995). The package solves for the oxides containing the following elements: Al, Ca, Fe, K, Mg, Na, Si, Ti. The resulting outgassed partial pressures were added to the volatile atmospheres, while keeping the total surface pressure constant. This is equivalent to reducing the relative abundances of volatiles. As in Zilinskas et al. (2022), we took the magma to have the same composition as bulk silicate Earth (BSE). It contains 45.97% SiO2, 36.66% MgO, 8.24% FeO, 4.77% Al2O3, 3.78% CaO, 0.35% Na2O, 0.18% TiO, and 0.04% K2O (wt%). The surface temperature and the outgassing were consistently calculated using a radiative-transfer code, as explained in Sect. 2.3. It is important to note that currently LavAtmos does not account for the possible deposition of volatiles into the magma. As shown in the work of Kite et al. (2020), this can have substantial consequences on the atmospheric composition. The detailed analysis of this is beyond the scope of this paper and will be a focus of a future study.
With the elemental budget determined, the atmospheric chemistry was solved using the thermochemical equilibrium code FastChem2 (Stock et al. 2018, 2022). We took into account over 200 relevant species, inclusive of neutral and ion chemistry. The thermal data used was compiled from the Burcat NASA thermodynamics database3.
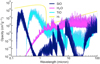 |
Fig. 2 Comparison of SiO, H2O, TiO, and H− opacities, shown at a resolution of λ/∆λ = 2000 for a temperature of 3000 K and atmospheric pressure of 10−2 bar. The description and sources of all opacities used can be found in Table A.1. |
2.3 Computing thermal profiles
The temperature structure was solved using the radiative-transfer code HELIOS4 (Malik et al. 2017, Malik et al. 2019b). We allowed convective adjustment to take place using an adiabatic coefficient of κ = 2/7, applicable to diatomic atmospheres. The profiles were treated with a rocky surface boundary, whose implementation is described in detail in Malik et al. (2019a); Whittaker et al. (2022). All of our models were reiterated until convergence such that the attained surface temperature is in good agreement with the atmospheric chemistry. For the purposes of showing possible spectral features, the heat redistribution was confined to the day side of the planet (f = 2/3). In specific cases it was approximated using the longwave optical depth of the atmosphere, based on equations from Koll (2022).
We used a total of 50 opacity sources, including all of the major volatile and silicate species. The entire list and descriptions of all the opacities used in this study are given in Table A.1. All of the atomic opacities are obtained from the DACE5 database; the majority use the Vienna Atomic Line Database (VALD3) line lists (Ryabchikova et al. 2015). For molecular opacities we made use of both the DACE database and the opacity calculator HELIOS-K6 (Grimm & Heng 2015; Grimm et al. 2021). Following Grimm et al. (2021), the opacities were approximated using a Voigt fitting profile, wing cutting length of 100 cm−1, and, where line lists allowed, a temperature of up to 4000 K.
In terms of observability, SiO is expected to be a key species of irradiated atmospheres (Ito et al. 2015; Zilinskas et al. 2022). In this work, we used the new ExoMol7 SiOUVenIR line list (Yurchenko et al. 2022), which covers the entire UV-infrared wavelength range and is applicable to the high temperatures expected to occur on hot super-Earths. Figure 2 shows the key unweighted opacities considered in this work. SiO shortwave opacity (<1 µm) is a strong contributor towards occurring temperature inversions, while the longwave bands peak at 5 and 10 µm and are potentially detectable spectral features. While not displayed, there are many other potential species that are significant absorbers in silicate and volatile atmospheres.
For short-period planets shortwave stellar flux becomes an important factor in shaping the thermal structure of the atmosphere. Using simple black-body stellar models results in incorrect UV flux. Thus, all stellar irradiation models used in this work were generated via HELIOS using the PHOENIX (Husser et al. 2013) and MUSCLES (France et al. 2016; Youngblood et al. 2016; Loyd et al. 2016) databases. The spectra and opacities were sampled at a resolution of λ/∆λ = 2000 and cover the range of 0.1–200 µm.
2.4 Simulating emission spectra
On hot super-Earths silicate atmospheres are expected to be confined to the tidally locked dayside of the planet, generally making them poor candidates for low-resolution transmission spectroscopy (Zilinskas et al. 2022). Due to high atmospheric temperatures, spectral features may instead be probed through the emission of the secondary eclipse and phase curve measurements. If, however, these planets do possess global volatile atmospheres, transmission could be possible, but its viability will depend strongly on the scale height (Zilinskas et al. 2020). While in this work we focus on emission spectroscopy, we note that for a number of known targets low-resolution transmission spectroscopy with JWST may also be feasible.
We generated emission spectra using the radiative-transfer code petitRADTRANS8 (Mollière et al. 2019, 2020). We used the same atomic and molecular opacities described in Sect. 2.3, including H2, H2O, and O2 Rayleigh scattering, and H2–H2, H2–He, O2–O2, and H− continuum opacities. The spectra were calculated at a resolution of λ/ ∆λ = 1000 for a wavelength range of 0.3–28 µm, encompassing the coverage of all JWST instruments. In all figures the spectra were convolved to a lower resolution for better readability.
For notable targets we assessed the JWST noise using PANDEXO9 (Batalha et al. 2017), which is built on the Pandeia10 engine. We only simulated MIRI Low Resolution Spectroscopy (MIRI LRS with λ/∆λ ≈ 100) in slitless mode as it was likely to be the most suitable mode for the characterisation of silicate features. The wavelengths covered by the instrument are 5–12 µm. In each case, we used the corresponding stellar and planetary parameters obtained from the NASA exoplanets archive. For the corresponding stellar models we used the PHOENIX generated spectra.
3 Results
3.1 Outgassed silicates in hydrogen atmospheres
For a given initial composition the thermal structure and the resulting chemistry of an atmosphere is determined by the stellar flux that the planet receives. In Fig. 3, we showcase a hypothetical world placed around a Sun-like star of T = 5750 K. The only free parameter varied in each case is the orbital distance. The 2 R⊕ planet is assumed to have a volatile-rich solarlike 1 bar atmosphere that is in equilibrium with an outgassed silicate component. In each model, the silicate abundance is computed via outgassing of a BSE melt of a numerically converged surface temperature. As expected, with increasing orbital distance the temperatures fall and the abundance of silicates decreases.
At close orbits the surface temperature can reach over 3000 K, which results in a substantial amount of outgassed O, allowing for the plentiful formation of oxides, including SiO and H2O. Our models show that 1 bar atmospheres with surface temperatures higher than 2300–2500 K produce super-solar abundances of silicates, causing drastic changes in thermal structure. Shortwave absorbers heat the atmosphere causing deep thermal inversions, affecting even the photosphere. Below the photosphere, at around 10−2 bar, the atmosphere becomes optically thick to radiation, resulting in isothermal regions where no heat transport occurs (the three hottest temperature-pressure – TP – profiles in the top left panel of Fig. 3). A similar thermal structure is observed in volatile-free pure silicate atmospheres (Zilinskas et al. 2022), implying that silicate opacities may largely be responsible in shaping the atmosphere.
Considering the chemistry, we find that many molecules survive thermal dissociation, even at the highest modelled temperatures. Abundances of major absorbers are shown in the top right panel of Fig. 3. While these atmospheres are filled with atomic species (H, O, Fe, Mg, and others), oxides, such as SiO, H2O, and TiO dominate its opacity. At high pressures, H and O form H2O, making it a strong absorber (see Fig. 4). Near the surface, H2O and SiO have similar volume mixing ratios. Moving to the upper low-pressure regions, H2O begins to dissociate into atoms and ions, while SiO remains in its molecular form, making it one of the most abundant species throughout the entire atmosphere. It should be expected that SiO is a major constituent in atmospheres with an underlying magma ocean. For these cases we find that chemically the abundance of SiO is only weakly affected by pre-existing volatiles. In addition to SiO, the vaporisation of magma at high temperatures also results in high abundances of TiO, which can become one of the most influential shortwave absorbers.
In the bottom panel of the figure, we show the corresponding emission spectra. While in this case the small planet-to-star contrast results in a relatively low emission signal, the emergence of the 5 and 9 µm SiO features is clear (blue curve). Due to occurring inversions, SiO increases the observed flux at these wavelengths. Unlike the silicate atmospheres modelled in Zilinskas et al. (2022), these show no significant sign of SiO2 absorption at 7 µm. This is partly attributed to oxygen being chemically favoured to bond with volatiles such as hydrogen. At shorter wavelengths, TiO is one of the dominant absorbers, causing a broad feature below 1 µm. For BSE compositions, its presence is only important at high surface temperatures, typically greater than 2500 K. It is worth noting that many different molecules and atoms contribute to the shortwave opacity, some of which may be detectable in more extended atmospheres using transmission spectroscopy. Shortwave opacities are discussed in more detail at the end of this section. In addition to molecular opacities H− becomes an important factor throughout the entire JWST wavelength range. Not only does it have a strong shortwave component, but its strong continuum at 10 µm may also hinder observability of SiO. Overall, out of all the outgassed silicates, the two SiO features are likely to be the easiest to characterise using MIRI LRS covering the 5–12 µm range.
Moving to colder cases, the abundance of all silicates decreases rapidly, becoming sub-solar at 0.04 AU (pink curve). The total outgassed pressure of just silicates at temperatures below 2500 K is comparable to 1 mbar (Zilinskas et al. 2022). Assuming melt-vapour equilibrium is attained, the volatile component is likely to dominate, making species such as SiO or TiO unobservable with low-resolution spectroscopy. Another consequence of this is a drastic reduction of outgassed oxygen, which raises the C/O ratio, allowing hydrocarbons to efficiently form. Most of the species in cooler atmospheres are heavily weighted towards infrared opacity, resulting in a lack of any significant inversions that may impact observability. The spectrum here is dominated by molecules such as CH4, C2H2, and HCN, all showing deep absorption features. Detecting silicates in emission at relatively large orbits could indicate that either the temperature of the melt is much higher than the planetary equilibrium temperature or that silicates are not in equilibrium with the underlying melt.
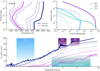 |
Fig. 3 Atmospheric models of a super-Earth of 2 R⊕ orbiting a Sun-like star. In all cases, dayside confined heat redistribution (f = 2/3) and a surface pressure of 1 bar are assumed. The top left panel shows the temperature-pressure profiles at orbital distances of 0.01, 0.015, 0.02, 0.03, 0.04, 0.05, and 0.06 AU; the two highlighted cases are 0.01 AU (blue) and 0.04 AU (pink). In the top right panel the highlighted curves indicate abundances of SiO, H2O, and TiO for the case of 0.01 AU with an effective planetary temperature of 3174 K. In the same panel the faded curves represent the chemistry of the same species at 0.04 AU (Teff = 1771 K). The bottom panel contains the corresponding synthetic emission spectra, with the flat thinner curves representing black-body emission (assuming computed surface temperature). Major absorbers for the highlighted cases are indicated via shaded areas, with SiO, TiO, and hydrocarbons (CH4, C2H2, and HCN) the primary species of interest. Spectra are shown at a resolution of λ/∆λ = 600. |
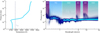 |
Fig. 4 Emission contribution function of a strongly irradiated super-Earth orbiting a Sun-like star at 0.015 AU. The temperature profile in the left panel is from the models showcased in Fig. 3. The dashed line is the effective temperature of the planet T = 2950 K. The right panel show the emitting region of the atmosphere as a function of wavelength. Major contributing molecules are indicated in their respective regions. Lesser contributing opacities are discussed in the text. Spectra are shown at a resolution of λ/∆λ = 600. |
3.2 Contribution function
In Fig. 4, we take one of the strongly irradiated cases and show its emission contribution function. In the right panel the highlighted region represents, the emitting photosphere. For wavelengths > 1 µm, this mostly coincides with pressures between 10−4 and 10−2 bar. A major contributing molecule for longwave opacity is H2O. Its dominance is a general occurrence in our models. Plentiful hydrogen and oxygen ensure that even at high temperatures it is one of the most optically dominating species. The leftover hydrogen results in a strong H− continuum, pushing the general opacity higher. The tail of the continuum can be seen at wavelengths > 10 µm. Since the abundance of SiO is not strongly affected by increasing temperatures and lower pressures, its opacity has large contributions from inverted regions. If atmospheres of super-Earths are prone to thermal inversions, it is likely that SiO will show up as increased flux. The 9 µm feature is and should be visible, even with strong volatile opacities present. If no volatiles are present, enough SiO2 may form to appear at 7 µm, complementing the SiO feature (Zilinskas et al. 2022).
There are many different species contributing to the total shortwave opacity (<1 µm). SiO, AlO, MgO, TiO, Mg, and Fe all have very strong opacities. Some lesser, but important species are SiH, MgH, VO, Al, Ca, K, Na, Si, and Ti. TiO, which has a broad wavelength coverage, is perhaps the most important for observations, and for its influence in shaping the thermal structure. Its presence is known to strongly affect atmospheres, even in gas giants (Serindag et al. 2021). We note that on rocky planets, TiO is typically sustained in significant abundances only above 2500-2800 K. Aside from TiO, the SiO UV band and Fe opacity have major influence on the strength and depth of the occurring inversions. These species are also much more volatile and readily vaporised from the magma. It is important to note that because of the large number of shortwave absorbers, even atmospheres that are missing major oxides such as SiO or TiO can still have deep occurring inversions.
Previous studies have shown that pure silicate atmospheres have similar total shortwave opacity (Zilinskas et al. 2022). This is unsurprising since the majority of shortwave absorbers come from silicate outgassing. While there are additional shortwave absorbers due to the presence of volatiles, namely SiH, MgH, and VO, these are relatively minor in comparison to silicates. We note that, due to a lack of thermal data, our models do not include FeH, whose opacity peaks at 1 µm. For atomic species we also do not use pressure-caused broadening, likely leading to some underestimation of the line widths. It is possible that many of the atomic species, especially alkali metals, are much more dominant in shaping the atmosphere.
The inherent complexity of the shortwave region makes it difficult to correctly model temperature profiles. Many of the mentioned opacities here are often overlooked, leading to theoretically incorrect temperatures. After the chemistry, the shortwave opacities are likely to be a major source of uncertainties that can greatly affect the interpretations of observed spectra.
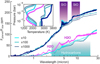 |
Fig. 5 Synthetic emission spectra for an atmosphere of increased metallicity. The main cases (in blue and pink) represent models with solar metallicity at two different orbital distances (0.015 and 0.03 AU). For each orbit, atmospheres of 10, 100, and 1000 times metallicity are shown. Some of the contributing opacities are shown for their respective wavelengths. The inset displays the corresponding temperature profiles. The metallicity here does not control the abundance of outgassed silicates or oxygen. Spectra are shown at a resolution of λ/∆λ = 600. |
3.3 Impact of metallicity and C/O ratio
The formation process for short-period rocky planets is unknown, but it is often assumed that they are heavily enriched in metals (Weiss et al. 2013; Moses et al. 2013). In Fig. 5, we vary the metallicity to explore what effect it may have on the observability of silicates. The blue and pink curves represent the original solar models discussed in the previous section, while for each of the orbits the overplotted curves show atmospheres with 10, 100, and 1000 times increased metallicity. We note that the metallicity here does not control the abundances of outgassed silicates or oxygen, but only of the volatiles. The main impact is thus the increase in C and N, and a higher C/O ratio. The corresponding chemistry of the close orbit cases is shown in Fig. 7.
For close orbits an increase of about × 10 in metallicity has a minimum effect on the atmospheric chemistry or thermal structure. With SiO and H2O remaining as dominant oxides, the spectral features are mostly unchanged. This slight increase in metallicity allows CO to form more efficiently, very slightly boosting its opacity at 5 µm. The unweighted opacity of CO, along with a few other species that are discussed later, are shown in Fig. 6. When the metallicity is increased to × 100, the C/O ratio crosses unity and the chemistry starts prioritising the formation of CO, heavily diminishing other oxides (see Fig. 7). Atmospheres that do not outgas or retain enough oxygen are likely to suffer this effect, erasing opacities of SiO or H2O in the spectrum. With no SiO, Si either remains in atomic form or bonds with H to form SiH. However, due to abundant N and the high C/O ratio, H prioritises bonding with CN to form HCN (rightmost panel of Fig. 7). This chemistry is now reflected in the thermal structure as inversions become significantly weaker. Pushing the metallicity higher further increases the C/O ratio, resulting in a mostly CO and hydrocarbon-dominated atmosphere, even at high temperatures. Because the emitting photosphere resides mostly in the isothermal region, the spectrum becomes largely featureless.
With increasing orbital distance (pink curve in Fig. 5), the trends in the chemistry and spectra remain similar, but more severe. Since the abundance of oxygen from outgassing is low at these temperatures, the C/O ratio at × 1 metallicity is already near unity. Even at × 10 the C/O ratio becomes much higher than unity causing efficient formation of hydrocarbons. The dominant molecules become HCN, C2H2, and CO, while H2O and any potential SiO are erased from the atmosphere. This results in opacity values that are heavily weighted towards infrared wavelengths, and thus a lack of deep inversions.
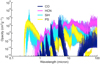 |
Fig. 6 Unweighted abundance opacities of CO, HCN, SiH, and PS, shown at a resolution of λ/∆λ = 2000 for a temperature of 3000 K and atmospheric pressure of 10−2 bar. Detailed description of all opacities used in this work can be found in Table A.1. |
3.4 Keeping the C/O ratio constant with metallicity
The balance between carbon and oxygen is a major factor in determining atmospheric chemistry and whether SiO is allowed to thrive. While in Figs. 5 and 7 we allow outgassing to control the abundances of oxygen, and therefore the C/O ratio, in Fig. 8 we set a constant C/O ratio. The value of oxygen is now scaled with metallicity. The blue and pink curves represent models at the same orbital distances as in the previous figures with cases of 10, 100, and 1000 times increased metallicity shown for each.
The abundance of oxygen at solar value is an order of magnitude lower than what would be outgassed in our close orbit case (blue curve). This directly results in decreased abundances of all oxides, inclusive of SiO. Additionally, the solar C/O ratio is high enough for CO to form and become an abundant oxygen carrier in the atmosphere. Other oxides, such as CO2, H2O, or SiO follow closely behind. The resulting infrared opacity is dominated by the continuum of H−, with some contribution from H2O. Overshadowed, but significant are opacities of SiO and CO2. The atmosphere in this case becomes less opaque, allowing radiation to penetrate deeper. This causes inversions to extend nearly all the way to the surface. To conserve energy, the surface temperature is consequently decreased. Increasing metallicity to 100× results in oxygen abundances similar to those produced by a melt-vapour equilibrium. This is reflected in the drastic change in the temperature profile, which now resembles cases presented in the previous figures (blue curve in Fig. 5). The high surface temperature also produces more Si, which is why we see its features begin to emerge. Increasing metallicity further has a similar effect. Regardless of metallicity in these models, a solar C/O ratio makes CO a prolific species, which absorbs much of the oxygen and reduces the possibility of SiO being a dominant species.
With outgassing lessened at larger orbits (pink curve), H20 and CO are the main oxygen carriers. In contrast to previous cases, increasing metallicity here results in high abundances of CO2, which has several important bands in the infrared, the two most important being at 4.5 and 14 µm. With high metallicity SiO reaches a volume mixing ratio of nearly 10−3, but the opacity of H2O completely overshadows it, making it invisible. We additionally see the emergence of some lesser species, such as SO2, which has a strong opacity at 7.5 µm.
In summary, our models indicate that it is mainly the C/O ratio that significantly affects atmospheric chemistry, including the final abundance of SiO; the metallicity of volatiles is much less important. Therefore, lava worlds enveloped in volatiles are likely to depend heavily on the balance between carbon and oxygen. High C/O ratios drive oxygen atoms away from SiO, potentially making SiH a species of interest. As shown in Fig. 6, SiH has a strong feature at 0.4 µm and several other bands between 1 and 10 µm. Nonetheless, in hydrogen-rich worlds, regardless of the C/O ratio, H2O and FT may further hinder observability of silicate species.
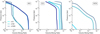 |
Fig. 7 Volume mixing ratios of SiO, CO, and HCN (from left to right). The models shown here are for the close orbit (0.015 AU) cases in Fig. 5. Each panel contains the original solar metallicity (blue) as well as 10, 100, and 1000 times increased metallicity curves. |
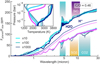 |
Fig. 8 Synthetic emission spectra as in Fig. 5, but with constant C/O ratio of 0.46. The oxygen abundance here is scaled with metallicity. The blue and pink curves represent cases with solar metallicity. The respective black-body emission is represented as thin curves in the same colour. Major contributing opacities for solar cases are indicated with shaded regions. The inset shows the corresponding temperature profiles. The surface temperature increases with metallicity, shifting temperature-pressure profiles to the right. Spectra are shown at a resolution of λ/∆λ = 600. |
3.5 Effect of increased surface pressure and internal heating
Down from millibar silicate atmospheres to volatile-shrouded sub-Neptunes, the envelopes of rocky worlds may vary by orders of magnitude in surface pressure. Farger thermally thick atmospheres can act as insulators, allowing the molten state of a surface to exist indefinitely, even if the planet is weakly irradiated (Lopez & Fortney 2014; Kite et al. 2020). One resulting consequence of this may be that insulation and trapped heat near the surface allow for much greater melt temperatures, making silicates more dominant over volatiles. It is also possible that due to an increase in volatiles, the outgassing becomes heavily suppressed. In the previous sections we assume the volatiles to be capped at 1 bar, while also keeping the internal temperature of the planet at 0 K. While the exact dynamics of this are beyond the scope of this paper, in Fig. 9 we show how an increase in pressure and internal heating might affect the observability of silicon-bearing species.
The bright cyan curves in the top panel of the figure represent atmospheres with a surface pressure increased to 10 bar. Without the internal temperature enabled, there is no additional heat to transport, making convection unnecessary, which results in a simple extension of the isothermal region. However, if the atmosphere is supplied with energy from below, the optically and thermally thick portion becomes unstable to convection, dramatically increasing the temperature of the melt. Because of the exponential scaling of outgassing, this can often lead to an immense increase in silicate abundances. If these atmospheres are well mixed, we should expect to see substantial silicate features.
The bottom panel of Fig. 9 shows the spectra for the close orbit models. A 10 bar atmosphere with no internal heating results in a greater dominance of the volatile component. The H− continuum becomes more effective, concealing the presence of SiO. With Tint = 300 K, even at 10 bar of volatile content, SiO becomes the most abundant species in the atmosphere, causing its features to dominate the spectrum. We note that our arbitrary use of unusually high Tint is purely for demonstrative purposes. Close-in rocky planets are susceptible to various heating mechanisms outside stellar irradiation. With an insulating optically thick atmosphere, it is possible that the trapping of heat allows global magma oceans to be sustained at much hotter temperatures than expected. Observations of silicates can therefore provide important constraints on the properties of the melt and the interior (Zilinskas et al. 2022).
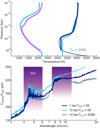 |
Fig. 9 Temperature-pressure profiles and emission spectra of varied atmospheric pressure and internal heating. The top panel contains profiles of atmospheres with 1 and 10 bar at two different orbital distances (0.01 and 0.04 AU). For the close orbit, an additional case with Tint = 300 K is shown. The lower panel shows the resulting emission spectrum of the close orbit cases. The chosen wavelength region is where SiO features are expected to appear. Spectra are shown at a resolution of λ/∆λ = 600. |
3.6 Depletion of hydrogen
Atmospheres of increasingly shorter orbital periods are expected to be affected by stellar wind erosion (Owen & Wu 2013; Lopez & Fortney 2014; Lopez 2017; Fulton et al. 2017). For less massive worlds, such as ultra-short-period super-Earths, this likely results in extreme loss of volatile species, and even extensive tails of escaping particles (including silicates) (Mura et al. 2011; Castan & Menou 2011; Léger et al. 2011). If the internal reservoir is unable to counteract depletion, the atmosphere will increase its mean molecular weight. With the depletion of hydrogen, a CO, CO2, N2, or SO2 atmosphere is not an unusual outcome. In Fig. 10, we investigate models that are severely depleted of hydrogen. As before, planets at two different orbital distances are shown with the oxygen abundance being determined via outgassing. In addition to hydrogen depletion, by varying the carbon mixing ratio, we explore the added impact of the C/O parameter.
For the close orbit cases the major difference caused by the depletion of hydrogen is the lack of H2O in the atmosphere. For a C/O ratio of 0.2 (grey TP profile and spectrum of Fig. 10), the thermal structure is similar to the cases discussed in Sect. 3.1. However, with no H2O the excess oxygen makes SiO the dominant constituent, followed by CO and O2. The depletion of hydrogen is yet another pathway in which SiO-dominant atmospheres are possible. Due to the lack of H, the H− continuum is exchanged for the opacities of CO and CO2, with a major band of CO2 appearing at 4.5 µm (faint upper spectrum in the bottom panel). SiO still remains the only absorber at 9 µm. If the C/O ratio is increased to 1.0 (blue curves), the formation of CO becomes even more efficient, leaving SiO nearly two orders of magnitude behind in volume mixing ratio (highlighted abundance curves in the top right panel). From a theoretical perspective, for C/O ratios close to unity, CO atmospheres are easy to attain. This means that the observability of the 5 µm SiO feature may not be feasible in such atmospheres. For comparison, we show a pure outgassing-produced silicate atmosphere (cyan). Between the volatile and silicate cases the 9 µm SiO feature remains; it might not be present at 5 µm. Detecting a combination of carbon oxides and SiO could indicate that the atmosphere has a high C/O ratio, with a significant outgassing component.
In the less irradiated cases, with C/O = 0.2, the temperature profile is only inverted in the uppermost region, similar to what was found in the original models (Fig. 3). However, the chemistry here is vastly different (see Fig. 11). The lack of outgassed oxygen allows for N2 to take over as the dominant species. Its abundance is also closely followed by sulphur, notably SO2. While N2 is a weak absorber, the opacity of SO2 is significant, peaking at 4 and 7–9 µm (grey lower spectrum of Fig. 10, features are not marked). Sulphur-rich hot Venus-like atmospheres may be possible on irradiated rocky worlds, and should be taken into consideration for observations with MIRI LRS (Schaefer & Fegley 2011; Kane et al. 2014; Zolotov 2018; Liggins et al. 2022). Other slightly diminished yet still visible spectral features include those of CO and CO2. If the C/O ratio is increased to 1 (pink curves), N2 still remains as the dominant component; however, previously seen oxygen-rich species, such as SO2 are no longer abundant. Instead, PS rises as the second most abundant molecule, causing an increase in shortwave opacity. The photosphere becomes severely inverted, resulting in large emission features. Aside from its shortwave component, PS has potentially observable IR bands at 7 and 15 µm (see Fig. 6 for its full opacity). Because of the strong VO opacity at 10 µm, this species may be interesting for observers.
3.7 Observability of currently known targets
Despite numerous observations with low- and high-resolution instruments, no definite detections of molecules have been made on any lava world. Thanks to its broad spectral coverage and high sensitivity, JWST is expected to shed new light on the subject. So far, the performance of the telescope has surpassed all expectations (Rigby et al. 2022; The JWST Transiting Exoplanet Community Early Release Science Team 2022). If short-period rocky planets do possess atmospheres, it is likely that JWST will be able to detect them with greater confidence than anything before. Targets such as 55 Cnc e or K2-141 b are excellent labs to test silicate outgassing, and have been chosen to be observed during JWST’s first cycle. If the observations are successful, many more targets are likely to follow.
In Fig. 12, we present currently confirmed planets, with a radius of 1–4 R⊕, as a function of stellar magnitude and emission flux at 9 µm. We note that here the flux ratio represents the baseline emission, not affected by possible absorption of present species. The simulated error bars are for 20 h of observing time with MIRI LRS binned to a resolution of R = 10. The observability of a target will depend drastically not only on the contrast between the star and the planet, but also on the brightness of the system. As the surface temperature defines outgassed silicate abundances, the equilibrium temperature of the planet is an additional factor that needs to be considered. For less tenuous atmospheres, this condition may be somewhat relaxed as insulation of heat can allow for global magma oceans to be sustained at greater temperatures. Despite the ample number of discovered worlds, most orbit stars that are too dim to be good targets for atmospheric characterisation with the JWST MIRI instrument. While the brightest systems, like 55 Cnc, have simulated noise of just a few ppm, at a stellar magnitude (K) of 9, it increases close to 50 ppm. Considering that such atmospheres only reach a few hundred ppm in the 9 µm range, characterisation of any features may be extremely difficult. However, there are a number of planets that are potentially good follow-up candidates for short-duration programmes.
One of the brightest and most studied super-Earths is 55 Cnc e, which will be observed with the NIRCam and MIRI LRS instruments during JWST’s first cycle (Hu et al. 2021a; Brandeker et al. 2021). Whether this planet possesses an atmosphere is currently debated, with a general consensus leading to an existing high-mean-molecular-weight atmosphere, possibly with an outgassed silicate component. Compositions dominated by CO, N2, or O2 are all possible; low-metallicity H2-rich atmospheres are less probable (Demory et al. 2016; Angelo & Hu 2017; Zilinskas et al. 2020, 2021), though there have been claims of detected HCN, which would indicate abundant H2 and a high C/O ratio (Tsiaras et al. 2016). A recent reanalysis of Spitzer phase curve data of 55 Cnc e also suggests a high average dayside temperature of T⋆= 3771 K, which may be caused by the presence of SiO (Mercier et al. 2022). Still, without observations of broad spectral coverage, conclusions for this planet cannot yet be drawn.
For high equilibrium temperatures several other targets of various radii are of notable interest. Smaller rocky worlds, such as K2-141 b, TOI-1807 b, and TOI-561 b are ideal for observing silicates (Hedges et al. 2021; Dang et al. 2021; Zieba et al. 2022). TOI-561 b is reported to have unusually low density, which could imply a large volatile component (Lacedelli et al. 2022). Farger worlds include K2-100 b, TOI-849 b, and TOI-2260 b, all of which may also host volatile H2-rich atmospheres with underlying magma oceans. Indicated via arrows are some of the highest contrast planets, including GJ-1214 b, GJ 436 b, FHS-3844 b, and several others. While the equilibrium temperature of these planets is generally too low to host magma oceans, an insulating atmosphere could force higher surface temperatures, and thus visible contamination of silicates.
The search for outgassed silicates is certainly not hindered by the lack of suitable targets, but rather by how small the spectral features are expected to be. While we do not model full spectra for any of the suggested targets, the emission features for most of them are expected to closely mimic our presented 2 R⊕ test cases. Generally, planets will not be observed for more than a few orbits, making spectral noise a considerable issue. With the JWST MIRI FRS it should be possible to characterise the presence of SiO on short-period rocky worlds and sub-Neptunes, but to do so will certainly be a grand challenge.
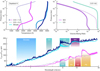 |
Fig. 10 Atmospheric models with severely depleted hydrogen at orbital distances of 0.01 and 0.04 AU. Top panel: TP profiles for C/O ratios of 1.0 (pink and blue) and 0.2 (faded) and an additional model of a pure silicate atmosphere (cyan). All cases assume dayside heat redistribution (f = 2/3) with volatile-containing atmospheres having 1 bar surface pressure. The total pressure in the pure silicate case is computed using the outgassing code. Top right: abundances of SiO and CO for the 0.01 AU case (blue TP profile), with the faint curves representing a pure silicate atmosphere. Bottom panel: emission spectra colour-coded for their respective TP profiles. The labelled regions denote major opacity contributions for the cases with a C/O ratio of 1.0. Spectral features for other cases are explained in the text. Spectra are shown at a resolution of λ/∆λ = 600. |
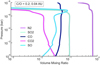 |
Fig. 11 Five most abundant molecules in an atmosphere corresponding to a hydrogen-depleted case with C/O = 0.2 at 0.04 AU. They are, in decreasing abundance, N2, SO2, CO, CO2, and SO. The relevant spectrum for this case is shown in Fig. 10 (pink curve). |
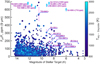 |
Fig. 12 Currently confirmed super-Earths and sub-Neptunes plotted as a function of stellar magnitude (K) and emission flux of the planet at 9 µm. The flux ratio here represents baseline emission modelled with dayside redistribution (ƒ = 0.667), which is not affected by absorbing species. 9 µm is the wavelength where the largest SiO feature is expected to manifest. A selection of favourable targets show PANDEXO simulated noise for the MIRI LRS instrument with 20 h of observation time, binned to R = 10. |
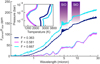 |
Fig. 13 Temperature profiles and emission spectra of models with computed heat redistribution factor ƒ4 at orbital distances of 0.015 and 0.04 AU. The atmospheres with ƒ = 0.667 (both cyan curves) are arbitrarily set to represent the dayside-confined redistribution of irradiation. Factors of ƒ = 0.363 and ƒ = 0.581 are calculated using the formulation of heat redistribution for rocky planets in Koll (2022). The parameters determining heat transport efficiency are planetary equilibrium temperature, atmospheric surface pressure, and longwave optical depth. Spectra are shown at a resolution of λ/∆Λλ = 600. |
4 Discussion
Importance of heat redistribution and stellar type
The characterisation of lava worlds depends as much on the structure of the atmosphere as it does on the chemistry. While the spectral energy distribution of the host star largely determines the features of the temperature profile and the emission spectrum of the planet, the atmosphere itself is prone to physical processes that impact observability. Specifically, for ID models, the efficiency of heat redistribution determines the total given energy budget, which subsequently decides much of the occurring chemistry. Approximations of this effect are made through a single factor f. Tenuous silicate atmospheres are expected to be inefficient in transporting heat, confining it to the dayside of the planet (ƒ = 0.667–1.0). More volatile optically thick atmospheres are more efficient, where a significant fraction of the incoming stellar radiation can be deposited on the night side. A maximum full redistribution results in ƒ = 0.25. Using the analytical heat redistribution scaling theory from Koll (2022), in Fig. 13 we show the possible effect that this may have on the observability of silicates.
In general, we assume that our modelled planets do not redistribute heat efficiently. Most of the models are set to use ƒ = 0.667; however, using a scaling theory derived for tidally locked worlds, we find that strongly irradiated atmospheres with volatiles can become very efficient at transporting heat in cases reaching as high as ƒ = 0.363. While not attaining global redistribution (ƒ = 0.25), this severely impacts the total energy budget, reducing the surface temperature and thus silicate observability. It is no surprise that volatile atmospheres increase the efficiency, but the large magnitude of ƒ for just 1 bar of an atmosphere does indicate that even a small amount of volatiles can have a severe impact. On the contrary, planets at larger orbital distances do not show a large increase in redistribution efficiency; they keep most of the energy confined to the dayside. Since the primary mechanism of heat transport is the atmosphere, phase curve measurements can indicate its significance. Detecting temperature offsets or high nightside flux could indicate that the planet has retained a substantial volatile-rich atmosphere. The unusual super-Earth 55 Cnc e has been found to show signs of this (Demory et al. 2016).
Since emission of the planet probes its thermal profile, observability is also greatly impacted by the spectrum of the host star. In Fig. 14, we take one of our solar cases and compare it to models of planets placed around stars of different types, but at an equivalent irradiation distance. With increasing stellar temperature, its spectrum is shifted towards shorter wavelengths, causing greater incident UV flux. Going from a G-type to a typical K-type star (T⋆ = 4305 K) the inversions weaken drastically. Atmospheres around cool M dwarfs are not likely to contain a deep inversion that strongly affects the emitting photosphere. For the characterisation of lava worlds through emission spectroscopy this may present a slight problem since strong inversions are one of the key characteristics of silicate-rich atmospheres that may help to identify them.
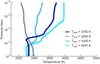 |
Fig. 14 Temperature profiles computed consistently with atmospheric chemistry for different stellar-type hosts. In each case the planet is placed at an equivalent irradiation distance from the star. T⋆ = 3026 K spectrum represents GJ 1214 and is from the MUSCLES database. The other three are modelled using PHOENIX spectra of the denoted temperature. |
5 Conclusion
In preparation for the JWST observations, we have used consistent outgassing equilibrium chemistry and radiative-transfer models to assess the possibility of detecting silicates in volatile atmospheres of super-Earths and smaller sub-Neptunes. Placing a hypothetical 2 R⊕ planet at varying orbital distances around a Sun-like star, we have explored a wide variety of viable atmospheric compositions, rich in H, C, and N, that also include an outgassed silicate component, for example Si, O, or Ti. We modelled atmospheres of up to 10 bar surface pressure, varied in metallicity and C/O ratio. A major assumption made in this work is that the atmosphere is in complete equilibrium with the underlying melt. Our results are intended to guide observers towards potentially detectable species that would help characterise worlds with exposed or concealed lava oceans. Our key findings are as follows:
For emission spectroscopy with JWST, SiO is likely to remain the only characterisable species that could indicate strong outgassing from an underlying magma ocean. However, in atmospheres containing volatiles, the main opacity bands of SiO at 5 and 9 µm can be heavily suppressed. Only the most irradiated worlds with melt temperatures > 2500–2800 K are expected to show super-solar abundances of silicates (assuming 1 bar of volatiles). Contrary to what has been found for pure lava worlds, we do not find features of SiO2 to be of significance. Very high temperature melts may also result in broad shortwave features, arising mainly from TiO and several other outgassed species. Ultimately, the visibility of silicates in volatile atmospheres largely depends on the atmospheric properties and the efficiency of its interaction with the melt;
Thermal inversions are prominent in atmospheres contaminated with silicates. We find that numerous outgassed silicates cause deep inversions that affect the photosphere, even if the atmosphere has strong infrared absorption originating from volatiles. The largest contributors to shortwave opacity are TiO, SiO, MgO, Fe, and Mg. We also find that alkali metals, metal hydrates, and, in certain cases, PS or VO can become a source of inversions. Because outgassing scales exponentially with the temperature of the melt, planets without insulating atmospheres and at larger orbital distances are not likely to show strong inversions due to silicates;
The presence of hydrogen can affect the observability of silicates, including SiO. Our models show that added hydrogen results in the formation of a large quantity of hydrocarbons and H20. Chemically, H20 and SiO are direct competitors for the outgassed oxygen; however, SiO is much less prone to thermal dissociation, making it more prominent in the lower-pressure inversion-affected regions. On strongly irradiated worlds, the continuum of H− can also heavily obscure the 5 and 9 µm SiO features;
The C/O ratio has a large effect on SiO. Even in H2-rich atmospheres, the formation of CO due to a C/O ratio ≳ 1.0 can result in a drastic reduction of silicate oxides. Chemically, CO takes priority for oxygen, affecting all other oxides. This can consequently result in Si bonding with H instead of O, forming SiH, potentially making it a species of interest for observations. Detecting CO at 4.5 µm and SiO at 9 µm could indicate an atmosphere with no hydrogen and a high C/O ratio;
Atmospheric pressure, insulation, and redistribution of heat are major factors in deciding whether volatile atmospheres are contaminated with silicates. Our models show that atmospheres of 10 bar with internal temperature enabled become convective, resulting in a large increase in surface temperature. Exponential scaling of outgassing can lead to SiO becoming a dominant species, even in substantial volatile atmospheres. On the contrary, effective heat redistribution can reduce surface temperatures. Using a scaling theory for tidally locked planets, we find that even small volatile atmospheres are efficient at transporting heat, and thus lowering surface temperatures. Observations of silicates can therefore provide important constraints on the underlying melt properties and the balance between insulation and redistribution of heat.
Shrouded magma oceans are expected to severely contaminate even substantial volatile envelopes. Detection of silicon oxides would be a major step in allowing us to put strong constraints on the efficiency of the interaction between the magma and the overlying atmosphere. We thus strongly recommend to observe irradiated super-Earths and sub-Neptunes for the presence of SiO and SiO2.
Acknowledgements
We acknowledge funding from the European Research Council under the European Union's Horizon 2020 research and innovation program under grant agreement no. 694513. We thank Matej Malik for the insightful discussion on HELIOS. We are also grateful for the comments of the editor and the anonymous referee, which helped improve the quality of this paper. Software used in this work: HELIOS-K (Grimm & Heng 2015; Grimm et al. 2021); HELIOS (Malik et al. 2017, 2019b); FASTCHEM (Stock et al. 2018); LavAtmos (van Buchem et al. 2022); petitRADTRANS (Mollière et al. 2019, 2020); PANDEXO (Batalha et al. 2017); numpy (Harris et al. 2020); matplotlib (Hunter 2007); seaborn (Waskom 2021); astropy (Astropy Collaboration 2022). Supplementary material is available on request from the author.
Appendix A Opacity Data
Description of the opacities used to calculate temperature profiles and emission spectra.
References
- Adam, A.Y., Yachmenev, A., Yurchenko, S.N., & Jensen, P. 2019, J. Phys. Chem. A, 123, 4755 [NASA ADS] [CrossRef] [Google Scholar]
- Angelo, I., & Hu, R. 2017, AJ, 154, 232 [NASA ADS] [CrossRef] [Google Scholar]
- Astropy Collaboration (Price-Whelan, A.M., et al.) 2022, ApJ, 935, 167 [NASA ADS] [CrossRef] [Google Scholar]
- Azzam, A.A.A., Tennyson, J., Yurchenko, S.N., & Naumenko, O.V. 2016, MNRAS, 460, 4063 [NASA ADS] [CrossRef] [Google Scholar]
- Barber, R.J., Strange, J.K., Hill, C., et al. 2014, MNRAS, 437, 1828 [NASA ADS] [CrossRef] [Google Scholar]
- Batalha, N.E., Mandell, A., Pontoppidan, K., et al. 2017, PASP, 129, 064501 [NASA ADS] [CrossRef] [Google Scholar]
- Bean, J.L., Raymond, S.N., & Owen, J.E. 2021, J. Geophys. Res. (Planets), 126, e06639 [NASA ADS] [Google Scholar]
- Bernath, P.F. 2020, J. Quant. Spec. Radiat. Transf., 240, 106687 [NASA ADS] [CrossRef] [Google Scholar]
- Brandeker, A., Alibert, Y., Bourrier, V., et al. 2021, Is it raining lava in the evening on 55 Cancri e?, JWST Proposal. Cycle 1 [Google Scholar]
- Burrows, A., Dulick, M., Bauschlicher, C.W., J., et al. 2005, ApJ, 624, 988 [NASA ADS] [CrossRef] [Google Scholar]
- Castan, T., & Menou, K. 2011, ApJ, 743, L36 [NASA ADS] [CrossRef] [Google Scholar]
- Chubb, K.L., Tennyson, J., & Yurchenko, S.N. 2020, MNRAS, 493, 1531 [NASA ADS] [CrossRef] [Google Scholar]
- Chubb, K.L., Rocchetto, M., Yurchenko, S.N., et al. 2021, A&A, 646, A21 [NASA ADS] [CrossRef] [EDP Sciences] [Google Scholar]
- Coles, P.A., Yurchenko, S.N., & Tennyson, J. 2019, MNRAS, 490, 4638 [CrossRef] [Google Scholar]
- Crossfield, I.J.M., Malik, M., Hill, M.L., et al. 2022, ApJ, 937, L17 [NASA ADS] [CrossRef] [Google Scholar]
- Dang, L., Cowan, N.B., Hammond, M., et al. 2021, A Hell of a Phase Curve: Mapping the Surface and Atmosphere of a Lava Planet K2-141b, JWST Proposal. Cycle 1 [Google Scholar]
- Demory, B.-O., Gillon, M., de Wit, J., et al. 2016, Nature, 532, 207 [NASA ADS] [CrossRef] [Google Scholar]
- Dorn, C., & Lichtenberg, T. 2021, ApJ, 922, L4 [NASA ADS] [CrossRef] [Google Scholar]
- Elkins-Tanton, L.T., & Seager, S. 2008, ApJ, 685, 1237 [NASA ADS] [CrossRef] [Google Scholar]
- France, K., Loyd, R.O.P., Youngblood, A., et al. 2016, ApJ, 820, 89 [NASA ADS] [CrossRef] [Google Scholar]
- Fulton, B.J., Petigura, E.A., Howard, A.W., et al. 2017, AJ, 154, 109 [NASA ADS] [CrossRef] [Google Scholar]
- GharibNezhad, E., Shayesteh, A., & Bernath, P.F. 2013, MNRAS, 432, 2043 [NASA ADS] [CrossRef] [Google Scholar]
- Ghiorso, M.S., & Sack, R.O. 1995, Contrib. Mineral. Petrol., 119, 197 [NASA ADS] [CrossRef] [Google Scholar]
- Gordon, I.E., Rothman, L.S., Hill, C., et al. 2017, J. Quant. Spec. Radiat. Transf., 203, 3 [NASA ADS] [CrossRef] [Google Scholar]
- Gorman, M.N., Yurchenko, S.N., & Tennyson, J. 2019, MNRAS, 490, 1652 [CrossRef] [Google Scholar]
- Gray, D.F. 2008, The Observation and Analysis of Stellar Photospheres [Google Scholar]
- Grimm, S.L., & Heng, K. 2015, ApJ, 808, 182 [NASA ADS] [CrossRef] [Google Scholar]
- Grimm, S.L., Malik, M., Kitzmann, D., et al. 2021, ApJS, 253, 30 [NASA ADS] [CrossRef] [Google Scholar]
- Hammond, M., & Pierrehumbert, R.T. 2017, ApJ, 849, 152 [CrossRef] [Google Scholar]
- Harris, C.R., Millman, K.J., van der Walt, S.J., et al. 2020, Nature, 585, 357 [NASA ADS] [CrossRef] [Google Scholar]
- Hedges, C., Hughes, A., Zhou, G., et al. 2021, AJ, 162, 54 [NASA ADS] [CrossRef] [Google Scholar]
- Hu, R., Brandeker, A., Damiano, M., et al. 2021a, Determining the Atmospheric Composition of the Super-Earth 55 Cancrie, JWST Proposal. Cycle 1 [Google Scholar]
- Hu, R., Damiano, M., Scheucher, M., et al. 2021b, ApJ, 921, L8 [NASA ADS] [CrossRef] [Google Scholar]
- Hunter, J.D. 2007, Comput. Sci. Eng., 9, 90 [Google Scholar]
- Husser, T.O., Wende-von Berg, S., Dreizler, S., et al. 2013, A&A, 553, A6 [NASA ADS] [CrossRef] [EDP Sciences] [Google Scholar]
- Ito, Y., Ikoma, M., Kawahara, H., et al. 2015, ApJ, 801, 144 [NASA ADS] [CrossRef] [Google Scholar]
- John, T.L. 1988, A&A, 193, 189 [NASA ADS] [Google Scholar]
- Kane, S.R., Kopparapu, R.K., & Domagal-Goldman, S.D. 2014, ApJ, 794, L5 [NASA ADS] [CrossRef] [Google Scholar]
- Kite, E.S., & Schaefer, L. 2021, ApJ, 909, L22 [NASA ADS] [CrossRef] [Google Scholar]
- Kite, E.S., Fegley, Bruce, Schaefer, L., & Gaidos, E. 2016, ApJ, 828, 80 [NASA ADS] [CrossRef] [Google Scholar]
- Kite, E.S., Fegley, Bruce, Schaefer, L., & Ford, E.B. 2020, ApJ, 891, 111 [NASA ADS] [CrossRef] [Google Scholar]
- Koll, D.D.B. 2022, ApJ, 924, 134 [NASA ADS] [CrossRef] [Google Scholar]
- Kreidberg, L., Koll, D.D.B., Morley, C., et al. 2019, Nature, 573, 87 [NASA ADS] [CrossRef] [Google Scholar]
- Kurucz, R.L. 1992, Rev. Mexicana Astron. Astrofis., 23, 45 [Google Scholar]
- Lacedelli, G., Wilson, T.G., Malavolta, L., et al. 2022, MNRAS, 511, 4551 [NASA ADS] [CrossRef] [Google Scholar]
- Léger, A., Grasset, O., Fegley, B., et al. 2011, Icarus, 213, 1 [CrossRef] [Google Scholar]
- Li, G., Harrison, J.J., Ram, R.S., Western, C.M., & Bernath, P.F. 2012, J. Quant. Spec. Radiat. Transf., 113, 67 [NASA ADS] [CrossRef] [Google Scholar]
- Li, G., Gordon, I.E., Rothman, L.S., et al. 2015, ApJS, 216, 15 [NASA ADS] [CrossRef] [Google Scholar]
- Li, H.Y., Tennyson, J., & Yurchenko, S.N. 2019, MNRAS, 486, 2351 [NASA ADS] [CrossRef] [Google Scholar]
- Liggins, P., Jordan, S., Rimmer, P.B., & Shorttle, O. 2022, J. Geophys. Res. (Planets), 127, e07123 [NASA ADS] [Google Scholar]
- Lodders, K., Palme, H., & Gail, H.P. 2009, Landolt-Börnstein, 4B, 712 [Google Scholar]
- Lopez, E.D. 2017, MNRAS, 472, 245 [NASA ADS] [CrossRef] [Google Scholar]
- Lopez, E.D., & Fortney, J.J. 2014, ApJ, 792, 1 [NASA ADS] [CrossRef] [Google Scholar]
- Loyd, R.O.P., France, K., Youngblood, A., et al. 2016, ApJ, 824, 102 [NASA ADS] [CrossRef] [Google Scholar]
- Malik, M., Grosheintz, L., Mendonça, J.M., et al. 2017, AJ, 153, 56 [NASA ADS] [CrossRef] [Google Scholar]
- Malik, M., Kempton, E.M.R., Koll, D.D.B., et al. 2019a, ApJ, 886, 142 [NASA ADS] [CrossRef] [Google Scholar]
- Malik, M., Kitzmann, D., Mendonça, J.M., et al. 2019b, AJ, 157, 170 [NASA ADS] [CrossRef] [Google Scholar]
- Mant, B.P., Yachmenev, A., Tennyson, J., & Yurchenko, S.N. 2018, MNRAS, 478, 3220 [NASA ADS] [CrossRef] [Google Scholar]
- McKemmish, L.K., Yurchenko, S.N., & Tennyson, J. 2016, MNRAS, 463, 771 [NASA ADS] [CrossRef] [Google Scholar]
- McKemmish, L.K., Masseron, T., Hoeijmakers, H.J., et al. 2019, MNRAS, 488, 2836 [NASA ADS] [CrossRef] [Google Scholar]
- Mercier, S.J., Dang, L., Gass, A., Cowan, N.B., & Bell, T.J. 2022, AJ, 164, 204 [NASA ADS] [CrossRef] [Google Scholar]
- Miguel, Y., Kaltenegger, L., Fegley, B., & Schaefer, L. 2011, ApJ, 742, L19 [NASA ADS] [CrossRef] [Google Scholar]
- Mollière, P., Wardenier, J.P., van Boekel, R., et al. 2019, A&A, 627, A67 [NASA ADS] [CrossRef] [EDP Sciences] [Google Scholar]
- Mollière, P., Stolker, T., Lacour, S., et al. 2020, A&A, 640, A131 [Google Scholar]
- Moses, J.I., Line, M.R., Visscher, C., et al. 2013, ApJ, 777, 34 [NASA ADS] [CrossRef] [Google Scholar]
- Mousis, O., Deleuil, M., Aguichine, A., et al. 2020, ApJ, 896, L22 [NASA ADS] [CrossRef] [Google Scholar]
- Mura, A., Wurz, P., Schneider, J., et al. 2011, Icarus, 211, 1 [CrossRef] [Google Scholar]
- Nguyen, T.G., Cowan, N.B., Banerjee, A., & Moores, J.E. 2020, MNRAS, 499, 4605 [NASA ADS] [CrossRef] [Google Scholar]
- Nixon, M.C., & Madhusudhan, N. 2021, MNRAS, 505, 3414 [NASA ADS] [CrossRef] [Google Scholar]
- Owen, J.E., & Wu, Y. 2013, ApJ, 775, 105 [NASA ADS] [CrossRef] [Google Scholar]
- Owens, A., Conway, E.K., Tennyson, J., & Yurchenko, S.N. 2020, MNRAS, 495, 1927 [NASA ADS] [CrossRef] [Google Scholar]
- Patrascu, A.T., Yurchenko, S.N., & Tennyson, J. 2015, MNRAS, 449, 3613 [NASA ADS] [CrossRef] [Google Scholar]
- Paulose, G., Barton, E.J., Yurchenko, S.N., & Tennyson, J. 2015, MNRAS, 454, 1931 [NASA ADS] [CrossRef] [Google Scholar]
- Polyansky, O.L., Kyuberis, A.A., Zobov, N.F., et al. 2018, MNRAS, 480, 2597 [NASA ADS] [CrossRef] [Google Scholar]
- Prajapat, L., Jagoda, P., Lodi, L., et al. 2017, MNRAS, 472, 3648 [NASA ADS] [CrossRef] [Google Scholar]
- Rigby, J., Perrin, M., McElwain, M., et al. 2022, PASP, submitted [arXiv:2207.05632] [Google Scholar]
- Rivlin, T., Lodi, L., Yurchenko, S.N., Tennyson, J., & Le Roy, R.J. 2015, MNRAS, 451, 634 [NASA ADS] [CrossRef] [Google Scholar]
- Rogers, J.G., & Owen, J.E. 2021, MNRAS, 503, 1526 [NASA ADS] [CrossRef] [Google Scholar]
- Rothman, L.S., Gordon, I.E., Barber, R.J., et al. 2010, J. Quant. Spec. Radiat. Transf., 111, 2139 [NASA ADS] [CrossRef] [Google Scholar]
- Ryabchikova, T., Piskunov, N., Kurucz, R.L., et al. 2015, Phys. Scr, 90, 054005 [NASA ADS] [CrossRef] [Google Scholar]
- Schaefer, L., & Fegley, B. 2009, ApJ, 703, L113 [CrossRef] [Google Scholar]
- Schaefer, L., & Fegley, B. Jr. 2011, ApJ, 729, 6 [NASA ADS] [CrossRef] [Google Scholar]
- Schlichting, H.E., & Young, E.D. 2022, PSJ, 3, 127 [NASA ADS] [Google Scholar]
- Serindag, D.B., Nugroho, S.K., Mollière, P., et al. 2021, A&A, 645, A90 [NASA ADS] [CrossRef] [EDP Sciences] [Google Scholar]
- Sousa-Silva, C., Al-Refaie, A.F., Tennyson, J., & Yurchenko, S.N. 2015, MNRAS, 446, 2337 [CrossRef] [Google Scholar]
- Stock, J.W., Kitzmann, D., Patzer, A.B.C., & Sedlmayr, E. 2018, MNRAS, 479, 865 [NASA ADS] [Google Scholar]
- Stock, J.W., Kitzmann, D., & Patzer, A.B.C. 2022, MNRAS, 517, 4070 [NASA ADS] [CrossRef] [Google Scholar]
- Syme, A.-M., & McKemmish, L.K. 2021, MNRAS, 505, 4383 [CrossRef] [Google Scholar]
- The JWST Transiting Exoplanet Community Early Release Science Team (Ahrer, E.-M., et al.) 2022, Nature, submitted, [arXiv:2208.11692] [Google Scholar]
- Tsiaras, A., Rocchetto, M., Waldmann, I.P., et al. 2016, ApJ, 820, 99 [NASA ADS] [CrossRef] [Google Scholar]
- Underwood, D.S., Tennyson, J., Yurchenko, S.N., et al. 2016a, MNRAS, 459, 3890 [NASA ADS] [CrossRef] [Google Scholar]
- Underwood, D.S., Yurchenko, S.N., Tennyson, J., et al. 2016b, MNRAS, 462, 4300 [NASA ADS] [CrossRef] [Google Scholar]
- van Buchem, C., Miguel, Y., Zilinskas, M., & van Westrenen, W. 2022, J. Comput. Chem., submitted, [arXiv:2210.10463] [Google Scholar]
- Waskom, M.L. 2021, J. Open Source Softw., 6, 3021 [CrossRef] [Google Scholar]
- Weiss, L.M., Marcy, G.W., Rowe, J.F., et al. 2013, ApJ, 768, 14 [NASA ADS] [CrossRef] [Google Scholar]
- Whittaker, E.A., Malik, M., Ih, J., et al. 2022, AJ, 164, 258 [NASA ADS] [CrossRef] [Google Scholar]
- Youngblood, A., France, K., Loyd, R.O.P., et al. 2016, ApJ, 824, 101 [NASA ADS] [CrossRef] [Google Scholar]
- Yurchenko, S.N., Blissett, A., Asari, U., et al. 2016, MNRAS, 456, 4524 [NASA ADS] [CrossRef] [Google Scholar]
- Yurchenko, S.N., Amundsen, D.S., Tennyson, J., & Waldmann, I.P. 2017, A&A, 605, A95 [NASA ADS] [CrossRef] [EDP Sciences] [Google Scholar]
- Yurchenko, S.N., Bond, W., Gorman, M.N., et al. 2018a, MNRAS, 478, 270 [NASA ADS] [CrossRef] [Google Scholar]
- Yurchenko, S.N., Sinden, F., Lodi, L., et al. 2018b, MNRAS, 473, 5324 [NASA ADS] [CrossRef] [Google Scholar]
- Yurchenko, S.N., Williams, H., Leyland, P.C., Lodi, L., & Tennyson, J. 2018c, MNRAS, 479, 1401 [CrossRef] [Google Scholar]
- Yurchenko, S.N., Mellor, T.M., Freedman, R.S., & Tennyson, J. 2020, MNRAS, 496, 5282 [NASA ADS] [CrossRef] [Google Scholar]
- Yurchenko, S.N., Tennyson, J., Syme, A.-M., et al. 2022, MNRAS, 510, 903 [Google Scholar]
- Zeng, L., Jacobsen, S.B., Sasselov, D.D., et al. 2019, Proc. Natl, Acad. Sci. U.S.A., 116, 9723 [NASA ADS] [CrossRef] [Google Scholar]
- Zieba, S., Zilinskas, M., Kreidberg, L., et al. 2022, A&A, 664, A79 [NASA ADS] [CrossRef] [EDP Sciences] [Google Scholar]
- Zilinskas, M., Miguel, Y., Mollière, P., & Tsai, S.-M. 2020, MNRAS, 494, 1490 [NASA ADS] [CrossRef] [Google Scholar]
- Zilinskas, M., Miguel, Y., Lyu, Y., & Bax, M. 2021, MNRAS, 500, 2197 [Google Scholar]
- Zilinskas, M., van Buchem, C.P.A., Miguel, Y., et al. 2022, A&A, 661, A126 [NASA ADS] [CrossRef] [EDP Sciences] [Google Scholar]
- Zolotov, M. 2018, in Oxford Research Encyclopedia of Planetary Science, 146 [Google Scholar]
All Tables
Description of the opacities used to calculate temperature profiles and emission spectra.
All Figures
|
Fig. 1 Short-period exoplanets with radii <4 R⊕. Coloured symbols indicate confirmed planets; grey symbols are candidate planets from the Kepler, K2, and TESS missions. The colour value of confirmed planets represents the density of the occurrence rate, which peaks at two distinct radii (1.5 and 2.4 R⊕), seemingly separating the population into super-Earths and sub-Neptunes. The highlighted region roughly encompasses the parameter space applicable to our modelled cases. Shown are the evaporation desert and one of the most well-studied super-Earths, 55 Cnc e. The data is from the NASA exoplanet archive. |
| In the text | |
|
Fig. 2 Comparison of SiO, H2O, TiO, and H− opacities, shown at a resolution of λ/∆λ = 2000 for a temperature of 3000 K and atmospheric pressure of 10−2 bar. The description and sources of all opacities used can be found in Table A.1. |
| In the text | |
|
Fig. 3 Atmospheric models of a super-Earth of 2 R⊕ orbiting a Sun-like star. In all cases, dayside confined heat redistribution (f = 2/3) and a surface pressure of 1 bar are assumed. The top left panel shows the temperature-pressure profiles at orbital distances of 0.01, 0.015, 0.02, 0.03, 0.04, 0.05, and 0.06 AU; the two highlighted cases are 0.01 AU (blue) and 0.04 AU (pink). In the top right panel the highlighted curves indicate abundances of SiO, H2O, and TiO for the case of 0.01 AU with an effective planetary temperature of 3174 K. In the same panel the faded curves represent the chemistry of the same species at 0.04 AU (Teff = 1771 K). The bottom panel contains the corresponding synthetic emission spectra, with the flat thinner curves representing black-body emission (assuming computed surface temperature). Major absorbers for the highlighted cases are indicated via shaded areas, with SiO, TiO, and hydrocarbons (CH4, C2H2, and HCN) the primary species of interest. Spectra are shown at a resolution of λ/∆λ = 600. |
| In the text | |
|
Fig. 4 Emission contribution function of a strongly irradiated super-Earth orbiting a Sun-like star at 0.015 AU. The temperature profile in the left panel is from the models showcased in Fig. 3. The dashed line is the effective temperature of the planet T = 2950 K. The right panel show the emitting region of the atmosphere as a function of wavelength. Major contributing molecules are indicated in their respective regions. Lesser contributing opacities are discussed in the text. Spectra are shown at a resolution of λ/∆λ = 600. |
| In the text | |
|
Fig. 5 Synthetic emission spectra for an atmosphere of increased metallicity. The main cases (in blue and pink) represent models with solar metallicity at two different orbital distances (0.015 and 0.03 AU). For each orbit, atmospheres of 10, 100, and 1000 times metallicity are shown. Some of the contributing opacities are shown for their respective wavelengths. The inset displays the corresponding temperature profiles. The metallicity here does not control the abundance of outgassed silicates or oxygen. Spectra are shown at a resolution of λ/∆λ = 600. |
| In the text | |
|
Fig. 6 Unweighted abundance opacities of CO, HCN, SiH, and PS, shown at a resolution of λ/∆λ = 2000 for a temperature of 3000 K and atmospheric pressure of 10−2 bar. Detailed description of all opacities used in this work can be found in Table A.1. |
| In the text | |
|
Fig. 7 Volume mixing ratios of SiO, CO, and HCN (from left to right). The models shown here are for the close orbit (0.015 AU) cases in Fig. 5. Each panel contains the original solar metallicity (blue) as well as 10, 100, and 1000 times increased metallicity curves. |
| In the text | |
|
Fig. 8 Synthetic emission spectra as in Fig. 5, but with constant C/O ratio of 0.46. The oxygen abundance here is scaled with metallicity. The blue and pink curves represent cases with solar metallicity. The respective black-body emission is represented as thin curves in the same colour. Major contributing opacities for solar cases are indicated with shaded regions. The inset shows the corresponding temperature profiles. The surface temperature increases with metallicity, shifting temperature-pressure profiles to the right. Spectra are shown at a resolution of λ/∆λ = 600. |
| In the text | |
|
Fig. 9 Temperature-pressure profiles and emission spectra of varied atmospheric pressure and internal heating. The top panel contains profiles of atmospheres with 1 and 10 bar at two different orbital distances (0.01 and 0.04 AU). For the close orbit, an additional case with Tint = 300 K is shown. The lower panel shows the resulting emission spectrum of the close orbit cases. The chosen wavelength region is where SiO features are expected to appear. Spectra are shown at a resolution of λ/∆λ = 600. |
| In the text | |
|
Fig. 10 Atmospheric models with severely depleted hydrogen at orbital distances of 0.01 and 0.04 AU. Top panel: TP profiles for C/O ratios of 1.0 (pink and blue) and 0.2 (faded) and an additional model of a pure silicate atmosphere (cyan). All cases assume dayside heat redistribution (f = 2/3) with volatile-containing atmospheres having 1 bar surface pressure. The total pressure in the pure silicate case is computed using the outgassing code. Top right: abundances of SiO and CO for the 0.01 AU case (blue TP profile), with the faint curves representing a pure silicate atmosphere. Bottom panel: emission spectra colour-coded for their respective TP profiles. The labelled regions denote major opacity contributions for the cases with a C/O ratio of 1.0. Spectral features for other cases are explained in the text. Spectra are shown at a resolution of λ/∆λ = 600. |
| In the text | |
|
Fig. 11 Five most abundant molecules in an atmosphere corresponding to a hydrogen-depleted case with C/O = 0.2 at 0.04 AU. They are, in decreasing abundance, N2, SO2, CO, CO2, and SO. The relevant spectrum for this case is shown in Fig. 10 (pink curve). |
| In the text | |
|
Fig. 12 Currently confirmed super-Earths and sub-Neptunes plotted as a function of stellar magnitude (K) and emission flux of the planet at 9 µm. The flux ratio here represents baseline emission modelled with dayside redistribution (ƒ = 0.667), which is not affected by absorbing species. 9 µm is the wavelength where the largest SiO feature is expected to manifest. A selection of favourable targets show PANDEXO simulated noise for the MIRI LRS instrument with 20 h of observation time, binned to R = 10. |
| In the text | |
|
Fig. 13 Temperature profiles and emission spectra of models with computed heat redistribution factor ƒ4 at orbital distances of 0.015 and 0.04 AU. The atmospheres with ƒ = 0.667 (both cyan curves) are arbitrarily set to represent the dayside-confined redistribution of irradiation. Factors of ƒ = 0.363 and ƒ = 0.581 are calculated using the formulation of heat redistribution for rocky planets in Koll (2022). The parameters determining heat transport efficiency are planetary equilibrium temperature, atmospheric surface pressure, and longwave optical depth. Spectra are shown at a resolution of λ/∆Λλ = 600. |
| In the text | |
|
Fig. 14 Temperature profiles computed consistently with atmospheric chemistry for different stellar-type hosts. In each case the planet is placed at an equivalent irradiation distance from the star. T⋆ = 3026 K spectrum represents GJ 1214 and is from the MUSCLES database. The other three are modelled using PHOENIX spectra of the denoted temperature. |
| In the text | |
Current usage metrics show cumulative count of Article Views (full-text article views including HTML views, PDF and ePub downloads, according to the available data) and Abstracts Views on Vision4Press platform.
Data correspond to usage on the plateform after 2015. The current usage metrics is available 48-96 hours after online publication and is updated daily on week days.
Initial download of the metrics may take a while.