Open Access
Fig. 7
Download original image
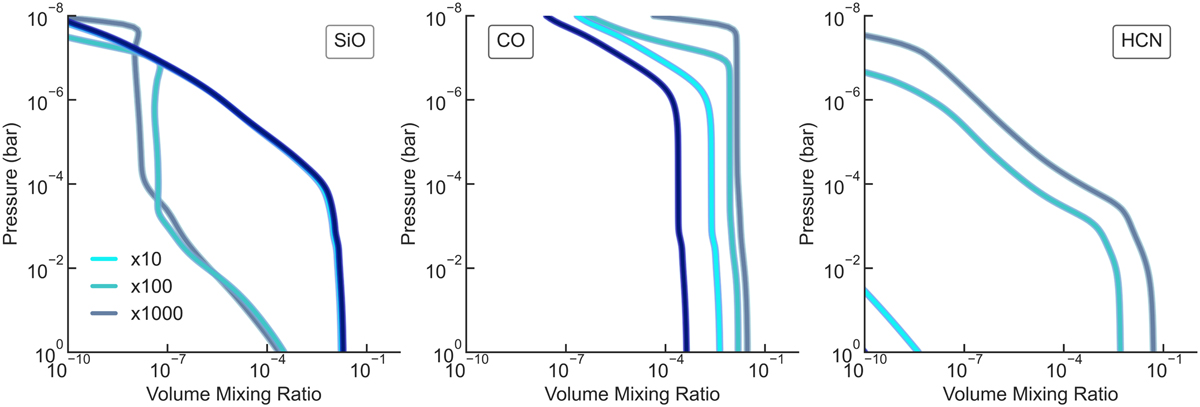
Volume mixing ratios of SiO, CO, and HCN (from left to right). The models shown here are for the close orbit (0.015 AU) cases in Fig. 5. Each panel contains the original solar metallicity (blue) as well as 10, 100, and 1000 times increased metallicity curves.
Current usage metrics show cumulative count of Article Views (full-text article views including HTML views, PDF and ePub downloads, according to the available data) and Abstracts Views on Vision4Press platform.
Data correspond to usage on the plateform after 2015. The current usage metrics is available 48-96 hours after online publication and is updated daily on week days.
Initial download of the metrics may take a while.