Fig. 8
Download original image
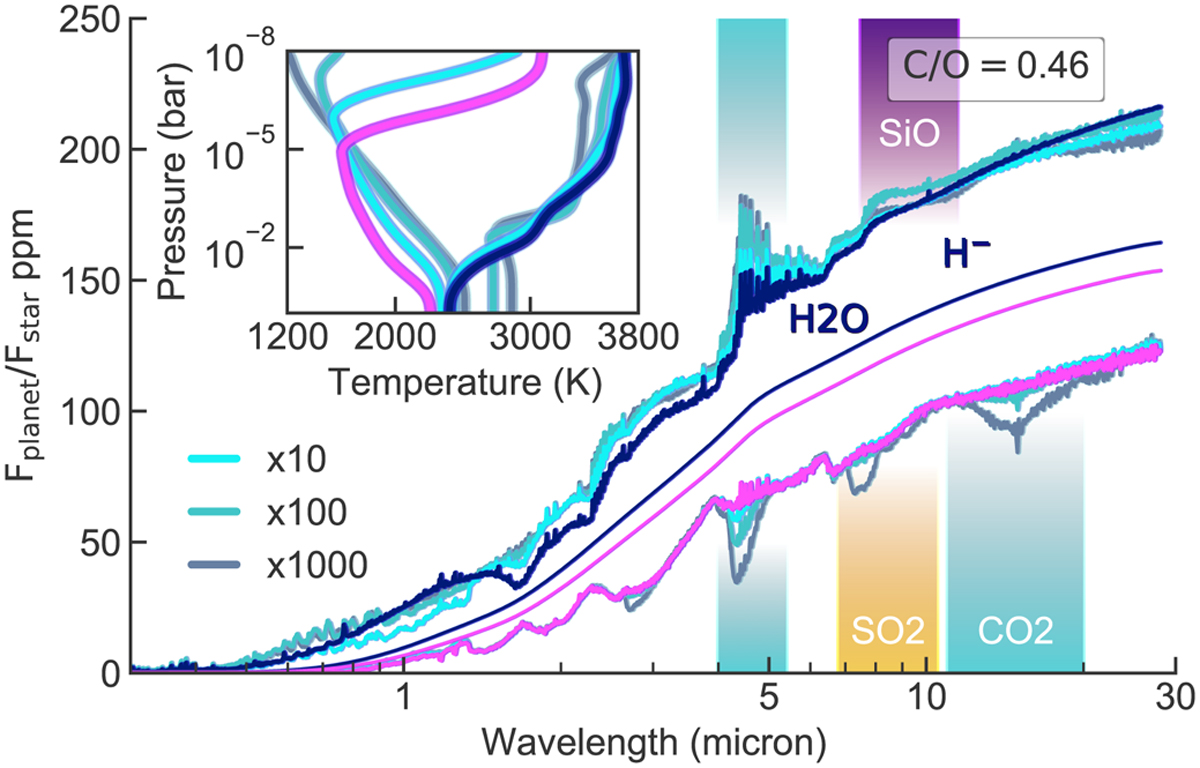
Synthetic emission spectra as in Fig. 5, but with constant C/O ratio of 0.46. The oxygen abundance here is scaled with metallicity. The blue and pink curves represent cases with solar metallicity. The respective black-body emission is represented as thin curves in the same colour. Major contributing opacities for solar cases are indicated with shaded regions. The inset shows the corresponding temperature profiles. The surface temperature increases with metallicity, shifting temperature-pressure profiles to the right. Spectra are shown at a resolution of λ/∆λ = 600.
Current usage metrics show cumulative count of Article Views (full-text article views including HTML views, PDF and ePub downloads, according to the available data) and Abstracts Views on Vision4Press platform.
Data correspond to usage on the plateform after 2015. The current usage metrics is available 48-96 hours after online publication and is updated daily on week days.
Initial download of the metrics may take a while.