| Issue |
A&A
Volume 671, March 2023
|
|
|---|---|---|
| Article Number | A136 | |
| Number of page(s) | 11 | |
| Section | Planets and planetary systems | |
| DOI | https://doi.org/10.1051/0004-6361/202245222 | |
| Published online | 20 March 2023 | |
Searching for the nature of stars with debris disks and planets★
1
Observatório Nacional,
Rua General José Cristino 77,
28921-400
São Cristovão, Rio de Janeiro, RJ,
Brazil
e-mail: This email address is being protected from spambots. You need JavaScript enabled to view it.
2
Observatorio Astronómico de Córdoba, Universidad Nacional de Córdoba,
Laprida 854,
5000
Córdoba,
Argentina
e-mail: This email address is being protected from spambots. You need JavaScript enabled to view it.
3
Consejo Nacional de Investigaciones Científicas y Técnicas (CONICET),
Godoy Cruz 2290,
Ciudad Autónoma de Buenos Aires,
Argentina
4
Departamento de Física de la Tierra y Astrofísica, UCM, and IPARCOS, Facultad de Ciencias Físicas,
Plaza Ciencias, 1,
Madrid
28040,
Spain
5
Lund Observatory, Department of Astronomy and Theoretical Physics, Lund University,
Box 43,
221 00
Lund,
Sweden
6
Ateneo de Almagro, Sección de Ciencia y Tecnología,
13270
Almagro,
Spain
7
Centro de Astrobiología (CAB), CSIC-INTA,
Camino Bajo del Castillo s/n, campus ESAC,
28692,
Villanueva de la Cañada, Madrid,
Spain
Received:
14
October
2022
Accepted:
16
January
2023
Abstract
The nature of the few known solar-mass stars simultaneously containing debris disks and planets remains an open question. A number of works have shown that this property appears to be independent of planetary masses as well as of stellar age, but possible correlations with stellar kinematics and metallicity have not been investigated. In this paper, we show that the majority of known stars containing both debris disks and planets belong to the metal-enriched Galactic thin disk. The few exceptions are stars that seem to be born in the star formation peak occurring in times of thick disk formation (i.e., HD 10700, HD 20794, and HD 40307), that is, between 11 and
8 Gyr. The mass of the dusty disk of these three old stars measured at 70 μm is very small - in fact, it is lower than that of the Kuiper belt of our Solar system by several orders of magnitude. These results are not surprising, as they remain within the values expected for the stellar disk evolution of such primitive stars. In parallel, we found another six thick-disk stars containing only debris disks or planets. These results enable us to establish a correlation between stellar metallicity and the mass of the dust disk modulated by the different formation epochs of the thick and thin Galactic disks.
Key words: stars: solar-type / stars: abundances / planetary systems / Galaxy: disk / Galaxy: abundances
Table 1 is also available at the CDS via anonymous ftp to cdsarc.cds.unistra.fr (130.79.128.5) or via https://cdsarc.cds.unistra.fr/viz-bin/cat/J/A+A/671/A136
© The Authors 2023
 Open Access article, published by EDP Sciences, under the terms of the Creative Commons Attribution License (https://creativecommons.org/licenses/by/4.0), which permits unrestricted use, distribution, and reproduction in any medium, provided the original work is properly cited.
This article is published in open access under the Subscribe to Open model. This email address is being protected from spambots. You need JavaScript enabled to view it. to support open access publication.
1 Introduction
In the initial evolutionary stages of solar-type stars, they are usually surrounded by gas and dust disks characterized by a range of properties that are referred to as protoplanetary disks (Williams & Cieza 2011). These are structures that contain mostly small dust grains and gas and they embody the first stages of planetary formation. Over time, this first generation of disks condense into planetesimals, which aggregate to produce minor mass planets and comets to finally produce massive solid structures that become the core of giant planets after capturing the ambient gas (Pollack et al. 1996). This first stage lasts from 3 to 10Myr, after the first fusion reactions start in the central star. This is this the time needed for the stellar winds produced by the newborn star to remove the gas component from its surroundings (Williams & Cieza 2011).
After this period, a new kind of disk can emerge from the dust produced in the planetesimal collisions. These disks are formed of asteroids and small planetesimals with sizes ranging from a few millimetres to several tens of kilometres (Wyatt 2008). The lifetime of a debris disk may be as long as that of its host star (Williams & Cieza 2011).
Stars containing debris disks and confirmed planets (DDP) are peculiar objects. In the literature, there are only about 30 stars that are known with confirmed observations of planets (SVO – VOMultiCatalog.Interface1). It is not clear why the number of these objects is so small given the hundreds of observed stars with debris disks without confirmed planets (DD) or the thousands of stars containing only confirmed planets (CP). Some authors have looked for correlations between the existence of DDPs and the mass of the exoplanets therein, as well as the age of the stellar system, but without success (e.g., Marshall et al. 2014; Montesinos et al. 2016). In fact, DDP stars have been shown to contain a broad range of planetary masses, from terrestrial mass type planets up to giants with several Jupiter masses. In addition, they have been found to exhibit stellar ages that range from the times of maximum star formation in the formation of the Galactic thick disk 8–11 Gyr ago up to the recent formation of the youngest components of the Galactic thin disk 2–6 Gyr ago (Montesinos et al. 2016).
In the context of correlations with age and planet mass, few works have been devoted to studies of DDP stars and fewer still have taken the DDP population as an ensemble. One of the few studies in that area was conducted by Maldonado et al. (2012), where the authors looked for correlations between the debris disks properties, the presence of planets, and the metallicity of the central stars using a collection of 29 DDP stars with a well-determined Ldust/L⋆ ratio. The authors found that the presence of planets, rather than the dust, is correlated with stellar metallicity. More recently, in Chavero et al. (2019, hereafter CH19), by using the mass of the debris disks (Md) instead of the fractional luminosity, the authors found a different result for the dust. In this study, the authors demonstrated that the Md of the DDP stars is highly dependent on the stellar metallicity, which turns out to be smaller when the metallicity of the central star is lower.
The study presented here is an extension of the work in CH19, whereby we are studying the effects of Galactic events, such as thick and thin Galactic stellar disk formation, on the properties of the second generation of circumstellar disks (i.e., so-called debris disks). It is well known that metallic material is necessary to form planets (e.g., Chambers 2001), but it has not been exhaustively studied. In particular, research is lacking with regard to the fact that when iron abundances are low (i.e., in the initial epochs of the Galactic life when the thick-disk stars were formed at a [Fe/H] < –0.2), other abundant elements (with condensation temperatures similar to that of iron) can replace the insufficient iron level - and ultimately lead to planetary formation. These elements are the α elements that are known to have been relatively abundant by the time of the formation of the thick disk (e.g., Bensby et al. 2005; Ishigaki et al. 2012). The relative abundance of iron and alpha elements, [a/Fe], changed over time, following an increase in SNIa explosions (Adibekyan et al. 2012; Haywood et al. 2013; Bensby et al. 2014). This expected evolution on the alpha versus iron ratio has been extensively studied and, together with the stellar kinematics, it is now used to determine which Galactic population each star belongs to (halo, thick disk, or thin disk). Here, we study whether this alpha and/or iron evolution has indeed had an impact on the DDP population. Other aspects we analyze here concern the relation between the central star metallicity and the formation of DDs. Finally, we also explore whether there is a limit on the metallicity that qualifies stars as belonging to the DD, DDP, or CP systems by looking for the oldest thick-disk stars with very low metallicities. In our analysis, and with the aim of reducing the parameters space, we focus only on solar-type main-sequence stars with spectral types between F5 up to K4 and stellar masses up to 1.4 M⊙.
The paper is organized as follows. In Sect. 2, we present the observational data used in this work and the process we used to to determine the Galactic population of each star (thin or thick disks). In Sect. 3, we calculate the disk masses of the oldest DDP stars. In Sect. 4, we study the correlation between metallicity and the dust disk mass of the DDP and DD stars and we studied the lithium evolution for the ensemble of our stars. Finally, we discuss our results and present our conclusions in Sect. 5.
2 Observational data: DDP, DD, and CP stars
In this section, we present the data sample of stars that we use all throughout this work (see Table 1) and the process we used to determine which stars belong to the thin or the thick disks. We are not interested on the oldest and kinematically hottest population that is located in the halo, thus we only kept the stars belonging to the thin or the thick disks. To determine their membership, we employed two different approaches: the first based on the [α/Fe] versus [Fe/H] analysis and the second based on the stellar kinematics provided by Gala. Table 1 presents the main properties of our sample. The values for all the stellar parameter have been obtained from the literature. (a) References of the stellar parameters (M⋆, age, [Fe/H]); (b) references for the [Ti/H], [Ti/Fe], [O/H], [Mg/H], [Si/H] and (c) references for the A(Li). These correspond to: Ad12 (Adibekyan et al. 2012); AG18 (Aguilera-Gómez et al. 2018); Be18 (Bensby & Lind 2018); Ber18 (Berger et al. 2018); Bon16 (Bonfanti et al. 2016); Br16 (Brewer et al. 2016); Ca11 (Casagrande et al. 2011); CH19 (Chavero et al. 2019); DM15 (Delgado Mena et al. 2015); DM17 (Delgado Mena et al. 2017); DM19 (Delgado Mena et al. 2019); Ed93 (Edvardsson et al. 1993); Ghe10 (Ghezzi et al. 2010); Hol09 (Holmberg et al. 2009); Lu17 (Luck 2017); Pa13 (Pace 2013); Ra12 (Ramírez et al. 2012); Ra14 (Ramírez et al. 2014); SilAg15 (Silva Aguirre et al. 2015); So05 (Soubiran & Girard 2005); So18 (Sousa et al. 2018); Ta20 (Tautvaisiené et al. 2020); Va05 (Valenti & Fischer 2005). For the few stars with no [Ti/H] values available, we assumed [Ti/Fe] = [α/Fe] and tagged them with the * symbol; 〈O,Mg,Si/Fe〈 means the average of [O/Fe], [Mg/Fe], and [Si/Fe]. Stars identified as high-α high-metal are tagged with a ** symbol. The galactocentric velocity values, U, were taken Llorente de Andrés et al. (2021). Exoplanet parameters data have been obtained from the Extrasolar Planets Encyclopaedia, with Np being the number of planets around the central star and ∑Mpl as the sum of the mass of all planets in the planetary system. We have taken the debris disk mass (log(Md)) in MMoon units from Chen et al. (2014), which does not include the stars HD 10700, HD 20974, and HD 40307; therefore, their disk masses were calculated within the scope of this work (see Sect. 3).
2.1 Abundances of [α/Fe] versus [Fe/H]
In Fig. 8 of Adibekyan et al. (2012), the authors presented a collection of stars with well determined abundances of many αelements, as well as a good determinations of the [Fe/H]. Among the a-elements, they analyzed, the sample of [Ti/H] is the most clear and complete. Thanks to these proper determinations, Ti has already been used to study the relation of α-elements with stellar mass (e.g., Bensby et al. 2014; Campante et al. 2015). Thus, we also chose to use Ti as a proxy for the α-elements in our study. All [Ti/H] values we used are included in Table 1, together with their references. In Table 1, we also show the [Fe/H] and [Ti/Fe]. We display the distribution of [Ti/Fe] as a function of [Fe/H] in Fig. 1. In this figure, we also draw a black solid line that splits (as a first approximation) stars belonging to the thin disk, shown below, from stars in the thick disk, shown above (see Bensby et al. 2014). In Sect. 5, we further discuss the finding of four new stars in the category of high-alpha high-metallicity stars (HAHM), first identified by Adibekyan et al. (2012), which are marked with red circles in this Fig. 1. These four stars group in a region that seems to not belong to the thin or the thick disk; that is to say, they may have a different origin (see Sect. 5 for a further discussion). In Fig. 1, we also show qualitatively the stellar ages (the symbol sizes grow with age) and the results are in agreement with an expected decay in the iron abundances with stellar age.
2.2 [O, Mg, Si] versus [Fe/H]
In the previous section, we describe the use of titanium as a proxy for the alpha elements, following works by other authors. However, some authors have reported several peculiarities in the formation of this element at specific metallicity ranges that may affect this decision (see the review paper by McWilliam 1997). To make our conclusions more robust, in this section, we use the average abundance of oxygen, magnesium, and silicon as proxies of the alpha elements. We compare these results with those we obtained when using titanium. We use the average value to reduce the dispersion on the alpha values as suggested by Lambert (1987). Our main objective here is to demonstrate that Ti shows a similar metallicity distribution as 〈O, Mg, Si〉. We show our results in Fig. 1 (panels a and b). As a result (excluding a few particular cases), the [Ti/Fe] versus [Fe/H] distribution (Fig. 1a, left panel) follows the same trend as [〈O, Mg, Si〉/Fe] versus [Fe/H] one (Fig. 1b, right panel). The more noticeable difference between both distributions appears for the peculiar stars HAHM belonging to the thin disk (mentioned in Sect. 2.1). These stars (surrounded by a red circle) appear much better defined by Ti than by the O, Mg, and Si elements. In light of these results, we conclude that both Ti and the 〈O, Mg, Si〉 are good tracers of the alpha elements, but also that Ti allows us to better discriminate between thin- and thick-disk stars (symbols with the same colors clump better). Also, we state that our conclusions remain the same if changing from one to the other group of elements. The median of the [O/Fe], [Mg/Fe], and [Si/Fe] abundances are presented in Table 1 as 〈O, Mg, Si/Fe〉, with the respective references.
Stellar sample studied in this work.
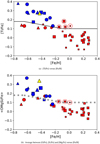 |
Fig. 1 [α/Fe] versus [Fe/H]. Panel a: distribution of abundances of [Ti/Fe] versus [Fe/H] of stars in Table 1. Symbols indicate the star’s class: DDP (squares), DD (triangles), CP (circles). The black line separates the stars as belonging to the thin (below) or thick (above) disks following the definition presented by Bensby et al. (2014). Colors show stars that fulfil both the chemistry-based and the kinematic criteria to belong to the thin (red) and/or the thick (blue) disk populations (see Sects. 2.1 and 2.3). In yellow we show the stars that are in a “transitory stage” between the two disk populations according to its kinematics. Stars surrounded by a red circle indicate they belong to the HAHM population, as defined by Adibekyan et al. (2012). Finally, the size of the symbols qualitatively indicate the stellar ages, being the smallest the youngest. Panel b: same details as in panel a but considering the average between [O/Fe], [Si/Fe], and [Mg/Fe] as a function of [Fe/H]. The grey dashed line shows the limit between the thin- and thick-disk stars in the [a/Fe] versus [Fe/H] space. |
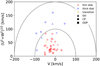 |
Fig. 2 Toomre diagram of the stars presented in Table 1. Symbols and colors are the same as in Fig. 1. The Galactic space velocities (U, V, W) are relative to the local standard of rest. Dashed lines represent curves of constant peculiar velocities of 100 and 200 km s–1. |
2.3 Stellar kinematics
As a second method used to differentiate between thin- and thick-disk stars, we followed the approach presented by Bensby et al. (2014), detailed in their Appendix A. This method is based on a detailed analysis of the stellar kinematics, which is now more reliable thanks to the new high-precision data produced by the Gaia satellite (Gaia Collaboration 2018). We used the U, V, and W galactocentric velocities relative to the local standard of rest that we obtained, published in Roca-Fàbrega et al. (2021), to study the probability of belonging to the thin-disk, thick-disk, halo, or transitional phases, as in Bensby et al. (2014). We show the results of this analysis in Fig. 2 and there we can clearly see the presence of a thin-disk population of stars that have velocities lower than 50 km s–1 and a thick disk that is made up of stars with velocities between 70 and 200 km s–1. Also, stars with velocities between 50 and 70 km s–1 are the ones considered to be transitory members between the thin and thick disks; thus, they require additional information on their chemistry to be classified in one or another population (see Fig. 1). The need for using the two criteria together to better define the thin- and thick-disk populations was also discussed in many previous papers (see, e.g., Navarro et al. 2011). Finally, we adopt here the following criteria: if a star fulfill both, the chemical and kinematical conditions of membership to a given Galactic disk population, the star is classified accordingly. Stars with a disagreement between methods are analyzed in depth. In general, these outliers are considered thin-disk stars if they have high metallicity, as they can be kinematically heated up by intrinsic disk perturbations; they are considered thick-disk stars if they are extremely metal poor, as (although it is unusual) thick-disk stars with low velocity dispersion can also fit within the thick-disk velocity distribution. We are aware that these last conditions can appear arbitrary, but they have no strong impact on our results, as the vast majority of objects of Table 1 fulfill both conditions well. We note that only one member was found in the transitory kinematical case (see yellow triangle in Fig. 1).
3 Debris disk masses
In general, due to their very low metallicities, old and very old DD and DDP stars are expected to host low-mass debris disks and, as a consequence, low-mass planets (e.g., Courcol et al. 2016; Sousa et al. 2019). With the goal of maintaining uniformity and homogeneity, in this work we only analyze the debris disk masses (Md) obtained from unresolved disks using the methodology presented by Chen et al. (2014). We also applied this method to the few objects with resolved debris disks we found in the literature. Regarding the objects detailed in Chen et al. (2014), as the debris disk mass, we only considered the second and the largest Md2 values if they were based on a two-zone model – and Md, otherwise. In this section, we focus on three important objects that are not included in the Chen et al. (2014) catalog: HD 10700, HD 20794, and HD 40307, (hereafter, the “trio”). These three stars show extreme low metallicity and, thus, this trio could be the oldest DDP stars ever found. In the following, we present a determination of their debris disk mass and of the total planetary masses and number of planets, however, we do not go into the detail about the planets’ orbital and mass structures.
HD20794 Kennedy & Wyatt (2014) carried out a very detailed study of the resolved debris disk of HD 20794 G8 V star using Herschel and JCMT sub-mm data. Their results show that its debris disk is only marginally resolved and much fainter than the one around HD 38858 G4 V star, which is also a DDP star. We hypothesise that this difference is intrinsic to variations on the properties of the protostellar clump where they were born. In fact, as we demonstrate in Sect. 2, HD 20794 belongs to the Galactic thick disk, while HD 38858 is a member of the Galactic thin disk (see Table 1). This hypothesis and the results agree with the age estimations for HD 20794 well, namely, 11.3 ± 0.03 Gyr, according to our work in CH19 and the one by Holmberg et al. (2009); and for HD 38858 that result is 7.3 ± 1.4 Gyr (CH19). Going back to HD 20794 disk properties, Kennedy & Wyatt (2014) proposed that the observations can be aptly explained with models of a 24 AU narrow debris ring, with a width of 5 AU. These results suggest that HD 20794’s disk is actually one of the faintest debris disks known thus far with robust photometric measurements. We also determined that this thick-disk star is currently the oldest known DDP star.
HD 10700 - Tau Cet Greaves et al. (2004) carried out the first study of the resolved disk of HD 10700, that is, Tau Cet (a G8 V), using the sub-millimetre SCUBA camera. In contrast to the star HD 20975 presented in the previous paragraph, the disk of Tau Cet appears to be extended. The models presented by Greaves et al. (2004) suggest that most of the dust lies in a ring with a maximum radius of 55 AU. However, further observations of Tau Cet now with ALMA at 1.3 mm (MacGregor et al. 2016) at a much higher resolution (see e.g., Lawler et al. 2014) revealed a patchy image with a complex radial structure. The new images showed that there is an inner belt with its edge at ~6 AU accompanied by an external broad disk much wider than the Kuiper belt at our Solar System.
HD 40307 There is no detailed information about the debris disk of HD 40307. We consider the debris disk of this star as “unresolved.”
To estimate the Md of disk debris, it is necessary to know the LIR/L* ratio and the disk radius. This is a problem for at least two of the three cases presented above, as it is not easy to obtain realistic radii from the complex resolved disks. In light of these difficulties (and for the sake of homogeneity), for the radii of the debris disks we decided to take the measurements obtained from the blackbody fitting, using a methodology similar to the one used in the reference DD catalog (Chen et al. 2014). We used IR at 70 μm photometry obtained with the Herschel telescope, as done by Sibthorpe et al. (2018) for HD 20794 and HD 10700 and Marshall et al. (2014) for HD 40307. Details on the calculations we carried out to obtain the Md values for these three stars can be found in Appendix A and the result is shown in Table 2. Debris disk masses for these three stars when measured at 70 μm are very small when compared with stars at a similar evolutionary state. It is important to recall that these stars are considered thick-disk stars, while the other DDP stars we can use to compare the debris disk mass are always thin-disk stars, namely, they are born in molecular clouds with potentially different chemistry properties. Therefore, the low mass of the debris disks around these three thick-disk DDP stars should not be surprising if it is correlated with metallicity, but this is a topic discussed further in the remainder of the paper. Finally, it is important to notice that although age estimations have still large uncertainties, these three stars seem to be older than the other DDP examples (see Table 3); this is a result that agrees well with their photospheric lithium abundances, which are small as a result of lithium depletion during the main sequence (e.g., Roca-Fàbrega et al. 2021).
Now, to get a better idea how small the masses of these debris disks really are, we compare them with the size of the mass of the Solar System Kuiper Belt (KB). The most recent values of the KB mass obtained from studies of the Solar System dynamics are Mkb = 4.8 MMoon (Di Ruscio et al. 2020) and 1.6 MMoon (Pitjeva & Pitjev 2018). These values are much larger than the Md values for those of the debris disks in the stars of the trio, by up to five orders of magnitude (see Table 3). In addition, this star trio formed (in agreement with their low disk masses) equally low-mass planets. In fact, the sums of their planetary content in Jupiter mass are: 0.034 MJup for HD 20974, 0.025 MJup for HD 10700, and 0.114 MJup for HD 40307, which is the most metallic of this group.
Finally, it is important to mention that the Tau-Ceti is peculiar with regard to its debris disk mass if measured at 850 μm. At this wavelength, Greaves et al. (2004) showed that the disk presents a mass excess of 1.2 Earth masses. If we consider that these old stars have normal old decaying disks, this is an unnaturally massive disk. Currently, the question of whether this massive belt is a remnant of the primordial debris disk or whether it has recently regenerated remains a puzzling enigma. It is also an enigma of how frequent can these “regeneration events” occur and if we should expect to find these massive disks in other DDP stars.
Properties of the old and low-[Fe/H] DD, DDP, and CP stars in our sample.
4 Metallicity in DDP and DD stars
In this paper, we focus on the study of dwarf stars with spectral types between F5 and K4, covering a wide range of stellar ages. It has long been established that a correlation exists between age and the iron and α-element abundances (Soubiran et al. 2008; Nissen 2015). This is not surprising as most of the element abundances reflect those of the interstellar medium (ISM) where the star was born. In this context, as the ISM properties follow the Galactic evolution, stellar abundances should also reflect the major events occurred in the Galaxy’s evolution (Roca-Fàbrega et al. 2021). Many previous works have shown that it also exists a correlation between the mass in planets and the metallicity of the host star (e.g., CH19). This result suggests that the total mass and properties of planets around stars from the thin-, thick-disk, and halo Galactic populations, are expected to be different. In this section, we study possible correlations between the metallicity and the stellar and accumulated planetary masses further in a sample of DD and DDP thin- and thick-disk stars. Following our previous results, we expect to find positive gradients in the mass of DDP and/or DD stars and in their total planetary mass as function of [Fe/H].
4.1 Metallicity gradient of DDP stars
In Fig. 3, we present the stellar masses of stars hosting planets and debris disks as a function of the metallicity [Fe/H] for the whole set of DDP objects presented in Table 1. The stellar mass is a good proxy of the protoplanetary disk properties, as demonstrated by, for instance, Pascucci et al. (2016). As can be seen, a relatively good positive gradient is obtained for the less massive DDP stars with the lowest metallicities. This result is in good agreement with those found in previous studies (Gonzalez 1997; Fischer & Valenti 2005), where it was concluded that high metallicity favours the formation of planets around more massive stars, while planets form preferentially in lower mass stars when the metallicity is low. This is a subject that was also recently reviewed by Adibekyan (2019). After a deep analysis of other possible correlations, we did not find the expected clear correlation between the total accumulated mass in planets and the [Fe/H]. The lack of a correlation may be a result of the complexity of the planet formation process that can vary from star to star or to the incompleteness of the sample.
Focusing now on the debris disks properties, we also tried to find correlations between the debris disk mass and the metallicity of the host star, as we did in CH19 but this time we have included information on their origin in the thin or thick Galactic-disk populations. In this study, we used all the currently known DDP stars (see Table 1), but we only analyzed the ones with the debris disk mass obtained from the infrared emission at 70 µm with Herschel (Chen et al. 2014), as well as the three for which it was obtained (see Sect. 3). Emission at this wavelength is produced by dust grains with diameters smaller than a millimetre and can radiate up to distances of some tens of AU from the central star. However, we note (and as is discussed in CH19) that a similar result on the correlation between dust mass and [Fe/H] has been detected for larger grain sizes up to more than mm at wavelength of 850 µm, which has allowed researchers to reach much larger distances from the central star. We consider that at the light of these conclusions our results obtained from the 70 µm observations can be extrapolated to match the ones that cover disk sizes from one to ten times the size of the Kuiper Belt. The [Fe/H] values have been obtained by cross-matching the results from Chen et al. (2014) with those of Gáspár et al. (2016). We show our results for the DDP stars in Fig. 4 as green triangles. We also include a regression line that shows how we reproduce the gradient observed by CH19 for small grains. It is crucial to emphasize here that the gradient is only recovered if we include the three thick-disk stars presented in the previous sections, that is, we show how the gradient is caused by the evolution of metallicity in the ISM from thick disk to thin disk formation.
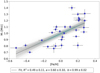 |
Fig. 3 Stellar mass of the DDP stars of Table 1 versus [Fe/H]. Blue dots show the observational data and the solid black line shows the best linear regression (y = ax + b), calculated using bootstrapping method weighted by the errors of metallicity, the parameter values are shown in the box below the figure. The shaded blue area shows the 68 per cent confidence band of the bootstrapping fit. |
4.2 Metallicity gradient of DD stars
In addition to the DDP stars in Fig. 4, we also show a large fraction of the DD stars presented in the Chen et al. (2014) catalog (red and blue symbols). Here, we further push the analysis of correlations between metallicity and parameters of the debris disks around stars presented in CH19 and references therein. In these previous works, the authors concluded that there is no correlation between the dust properties and metallicity. In these studies, the authors used IR-based parameters, such as as LIR/L*, as well as debris disk masses Md (e.g., CH19). We state that the lack of correlation was due to the fact that the authors only analyzed stars from the thin disk, but if we include stars from other galactic components (i.e., thick-disk stars), correlations do indeed arise. This is illustrated by Fig. 4, where we show that the distribution of stars with values of [Fe/H] < −0.2 (mostly thick-disk stars) is different from what we see for higher metallicities. In particular, the few DD stars with low metallicities contain mostly low-and very low-mass debris disks, and they may also belong to the thick disk (see Table 1). Otherwise, high-metallicity, thin-disk stars have enough material in their surroundings to produce a very rich variety of debris disks with a variety of morphologies and sizes – effectively eliminating any correlations with [Fe/H].
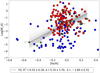 |
Fig. 4 In this figure, we show the stellar disk masses of DD stars (in lunar masses) of part of the Chen et al. (2014) catalog, as a function of [Fe/H]. Red points are the values of the masses given in the second disk distance model (Md2) of this catalog. Blue points are the values corresponding to the single distance model (Md). Green triangles are the DDP stars of Table 1 with Md values both from Chen’s catalog and the three computed in the current work (see Sect. 3). The green solid line shows the best linear regression (y = ax + b), calculated using a bootstrapping method weighted by the errors on metallicity for all the DDP stars with known Md – but excluding the HAHM objects that have a different origin than those studied here (see discussion in Sect. 5). The parameter values are shown in the box below the figure. The shaded blue area shows the 68% confidence band of the bootstrapping fit. |
4.3 Hunting for the oldest DD, DDP, and CP stars in the Galaxy
Recently, thanks to the publication of massive databases of stellar atmospheric parameters and kinematics, a new picture has emerged concerning the formation timescale of our Galaxy (Xiang & Rix 2022). In particular, the history of its star formation has been rewritten in the last few years. An important result regarding the formation of what is called the thick disk was obtained by analyzing 250 000 subgiant stars that are considered to be one of the best age indicators due to their short life. These authors presented results to suggest that the old thick disk began its formation ~13 Gyr ago, that is, only 0.8 Gyr after the Big Bang, with the star formation peak occurring at 11 Gyr, which coincides with the merger of our galaxy with the satellite galaxy Gaia-Sausage-Enceladus. This result is compatible with others based only on abundances (Haywood et al. 2016; Maoz & Graur 2017) or on analyses of color-magnitude diagrams (Mor et al. 2019). This peak was followed by a quenching of the star formation, a result that coincides with post-merger predictions from theoretical models. The quenched star formation lasted ~2 Gyr, from 3 to 5 Gyr. A few of the DD, DDP, and CP stars contained in Table 1 were born in this period, so we can consider them as participants in the formation process of the thick disk. Authors such as Sheehan et al. (2010), Shchekinov et al. (2013), Campante et al. (2015) and Hasegawa & Hirashita (2014) have explored the very-low-metallicity regime for stars in past and current large databases, looking for the first planetary systems formed in the Galaxy. In these works, the authors only looked for CP stars, whereas here we are looking for the most primitive DDP stars and some DD stars for the first time. All of our candidates are listed in Table 1 and the DD and DDP are also represented in Fig. 4.
Now we adopt the following conditions in order to select the best candidates for the oldest DD, DDP, and CP main-sequence stars: (a) to have an age determination with a small error and with a value higher than 8 Gyr; (b) to be a member of the thick disk, as discussed in Sect. 2; (c) to have a very small lithium abundance indicating an expected and very high depletion of this element. The DD star HD 110897 with A (Li) = 1.94 and the CP star HD 114729 with A(Li) =1.88 (which are even considered as thick-disk stars in Table 1) were not labeled as primitive due to their high A(Li) values. All these results are presented in Table 3, where two DD stars, five CP and three DDP are shown as likely to have been formed during the maximum at 11 Gyr as well as in the following quenching of star formation of the thick disk.
Among the CP stars we considered as the “most primitive,” the results from the HD 189567 and the HIP 94931 (also known as K-444) stars are especially relevant as the age estimations are precise and they have very low metallicity and A(Li), suggesting that may be the oldest stars with known planets. A similar result but for the DDP stars is the one obtained from the HD 20794 star. This star has an age that exceeds by several Gyr the one of the other two candidates. The mass of the debris disk around this star (Md) is much lower than the one in all other candidates (see Sect. 2). In light of these results, we conclude that HD 20794 is the oldest DDP star known in the Galaxy. Finally, we also notice that, as expected, the planetary masses of all the thick-disk primitive stars mentioned here (both CP and DDP) are very small, with the sole exception of HD 37124, which has a total planetary mass of 2.02 MJup. This star was classified as transitory disk star, as it should belong to the thin disk according to the stellar kinematics criteria – however, it would be attributed to the thick disk based on the analysis of its [Ti/Fe] versus [Fe/H] measurement (see Table 1 and the discussion in Sect. 2). We have not reached any conclusion in this work to answer why it hosts these large planets and we state that new observations are needed to better understand the origin and properties of this object.
4.4 Lithium properties of the DD, DDP and CP stars
The lithium abundance and its evolution inside FGK dwarf stars have been widely studied in the past. In particular, many authors have shown that despite its fragility, the A(Li) abundance can be used as a tracer of metallicity in young stars (Rebolo et al. 1988; Rebolo & Beckman 1988). Stars inherit the metallicity and lithium abundance of the interstellar medium where they were born and via numerous mechanisms inside and outside, stars continue to grow as the Universe gets older (Roca-Fàbrega et al. 2021). If no other agent is present, the A(Li) should increase at a similar rate as the metallicity. However, observations have shown that some metal-rich dwarf stars in the solar neighbourhood ([Fe/H] > 0.15) have low A(Li). This can be easily explained if a lithium destruction mechanism is present inside stars (Eggenberger et al. 2012) and if these metal-rich dwarf stars are old enough to allow this mechanism to work until it depletes most of the lithium (Roca-Fàbrega et al. 2021). The main problem with this hypothesis is that the metal-rich stars in the solar neighbourhood are usually the youngest. In Dantas et al. (2022), the authors present a detailed discussion of the a suggestion from Guiglion et al. (2019) aimed at solving this problem. Guiglion et al. (2019) proposed that these metal-rich dwarf stars are indeed old stars but they happen to come from the inner regions of the Galaxy, which are more metal-rich than the solar neighbourhood. These stars thus depleted their Li in their journey to their current positions.
In this context, as our sample of stars covers a broad metallicity range, we study whether some of the objects presented in Table 1 show peculiar A(Li) values. In Fig. 5, we show the A(Li) versus [Fe/H] colored by age (left) and galactocentric radial velocity (right) and we note the presence of two branches: one lithium-rich (A(Li) > 1.5) and one lithium-poor (A(Li)<1.0). Interestingly, although most lithium-poor stars are also metal deficient, five stars have low metallicity ([Fe/H] < −0.2) and high A(Li). Also, we see that five stars with super-solar metallicity have very low A(Li). If we focus on the five metal-rich stars with low A(Li), we can try to test the Guiglion hypothesis by using the stellar kinematics provided by the Gaia satellite and ages presented in Table 1 (see color bars in Fig. 5). After computing the mean ages of the metal-rich stars in the two branches, namely, A(Li) > 1.5 and A(Li) < 1.0, we find that the former is much younger than the latter (~2 Gyr versus ~5 Gyr); this is also evident when comparing the colors in the left panel of Fig. 5. This result is in agreement with the Guiglion scenario. Now, if we examine the Galactic radial velocity of these stars (U), which may be a tracer of radial migration, we see that three out of five of the low-A(Li) stars show high outward (negative) radial velocities, two of them with values higher than −50 km s−1 and one with high inward velocity (positive) that is the eldest (HD 108874). Stars in the high-A(Li) branch show radial velocities lower than 50 km s−1 (absolute), with the only exception being that of the eldest star (HD 52265), which exhibits a high outward velocity.
These results show that given our poor statistics, we cannot make a strong statement about the validity of the Guiglion hypothesis. However, we can point out that at least three low-A(Li) objects may be candidates for the status of migratory stars from the Galactic central regions. Also, we can confirm that stars in the low-A(Li) branch are older than the ones in the high-A(Li). Finally, it is worth mentioning that using a larger sample of stars and a different approach, Dantas et al. (2022) gave an initial (but not final) confirmation of the Guiglion hypothesis.
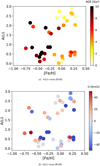 |
Fig. 5 A(Li) as a function of [Fe/H] for all stars listed in Table 1, shown as two different branches. The top branch, with A(Li) > 1.0, represents the expected Li evolution in the Galactic thin disk. The bottom branch, with very depleted Li values less than 1.0, contains a mixture of thick-disk stars in the low-metallicity domain with [Fe/H] < −0.2 and thin-disk stars with larger metallicities values up to 0.28. Among the thin-disk, Li-depleted stars, with −0.15 < [Fe/H] < 0.01, we include the HAHM stars discussed in Sect. 2.1 The corresponding ages (a) and the U Galactic radial velocities (b) are shown in vertical color scales. |
5 Discussion and conclusions
From the thousands of stars with confirmed planets (CP), we detected second-generation debris disks, that is, Kuiper beltlike structures in only a few (i.e., less than 40). The lack of such structures remains an open question. Many hypotheses can be proposed, starting from a possible observational bias or a DDP short lifetime (i.e., fast transition from DDP to CP) to a mechanism that stabilises the planetary system and does not allow for the formation of this second-generation of cold debris disks in most stars (Najita et al. 2022). However, none of these hypotheses have been confirmed or rejected thus far.
Some recent results on the DDP nature show that the presence of debris disks around stars with confirmed planets is independent of the masses of the planets and of its age, as well as of its metallicity (e.g., Montesinos et al. 2016) – this is a result that also applies to DD stars without confirmed planets. We show in Sect. 2 that, in fact, the large majority of these objects are members of the young and metal-rich Galactic thin disk and we hypothesize that this may be the cause of the lack of correlation with metallicity found in previous works, such as that of Maldonado et al. (2012). In fact, many authors have shown that in a metal-rich thin disk, the broad distribution of dust grain sizes, each with a different metallicity dependence, can undermine any possible correlation (see e.g., CH19 and references therein). What is even more interesting is the fact that we have detected three DDP stars belonging to the old and metal-poor Galactic thick disk. One of them, HD 20794, was presumably formed at the maximum stellar formation rate of the thick disk 11 Gyr ago (see Sect. 4.3). This epoch, as proposed by Xiang & Rix (2022), coincides with that of the merger of the Galaxy with the Gaia-Sausage-Enceladus. The other two DDP stars (HD 10700 and HD 40307) would belong to the following quenching of star formation that lasted down to 7–9 Gyr ago. These three stars were not included in the former work by Chen et al. (2014) and the mass of their debris disk was not computed. In this work, we carry out that computation and we show that the detection of DDP stars in the thick disk naturally generates a correlation between the debris disk mass and the metallicity, with the metal-poor, thick-disk stars being the ones that are shown to host debris disks of lower masses (see Sect. 4.1). We note here that although these results were obtained using data for the debris disks from the 70 µm emission – that is, from dust grains with diameters smaller than a mm and extending to distances of several tens of AU from the central star – in CH19, we showed that this debris disk mass-metallicity correlation is maintained when larger than a mm grains are considered. With emissions at 850 µm the gradient can be conserved up to much larger distances on the order of one to ten times the Solar System Kuiper belt radius.
Regarding the debris disk mass of the three thick-disk DDPs, we found that when they are measured at 70 µm, all of them are very small. This result agrees with a plausible correlation between metallicity and the DD mass (see Fig. 4), meaning that very old DD stars that formed during a low-metal regime in the Galactic thick disk would be expected to host low-mass debris disks. These masses are several orders of magnitude lower than the mass of the Kuiper belt (KB) of our Solar System. For the DDP star HD 20794, which is the most primitive one, its debris disk mass is even smaller. It is only the disk of the star Tau Cet that presents an anomaly. Greaves et al. (2004) obtained a mass for this debris disk of ~1.2 Earth masses, measured at 850 µm. The origin of such a massive disk is unclear and whether it is a transient phenomenon or not and how frequent can be these kind of events is still under debate. We assert that it is only a scenario of a transient replenishment of the debris disks that can fit this system within the general picture of debris disks that are slowly decaying in line with their stellar ages.
In our analysis of the CP, DDP, and DD stars, we have found four stars that fall within the regime of the so known as high-alpha high-metallicity (HAHM) stars. The existence of this kind of star has been discussed by Adibekyan et al. (2012), but the authors have not succeeded in establishing a final conclusion with regard to their origin. The problem revolves around the fact that the high α abundances of these stars would indicate they belong to an old population (e.g., the thick disk), but their kinematics suggest they should belong to the thin disk. In this work, the four HAHM stars are young (even with larger uncertainties) and clearly belong to the thin disk when applying the kinematic criteria, but they do show a high [α/Fe] (where we use Ti as a proxy for the α-elements). We speculate that they could have been enriched with alpha elements during their evolution by direct accretion – or, more probably, that they were born in non-well-mixed clouds of low-[Fe/H] gas (van den Hoek & de Jong 1997) or in low-[Fe/H] gas accreted in a recent extragalactic or circumgalactic gas infall (Chiappini et al. 2015). However, this question requires further investigation to reach a firmer conclusion.
In this work, we also consider the main lithium properties of our stars, mainly investigating a few super-metal-rich stars that are highly lithium-depleted. We made an initial approach, using our ages and Galactic kinematical data, and we found indications supporting the scenario proposed by other authors, namely, these stars are migrating from internal metal-rich regions of the Galaxy and depleting their lithium along the journey to their current positions.
Finally, as a complementary result to this research, we found some DD, DDP, and CP stars that could be considered to be the oldest objects of this kind in the thick disk. The final results of this search for primitive stars can be found in Table 3, where we show two DD stars, four CP stars, and three DDP stars with old ages and very small total planetary masses. This is a result that is in agreement with the assumption that these stars were born into a very-low-metal regime. In particular, we note that star HD 20794, thanks to the high precision on its age estimation and to extremely small disk mass, can be considered the most primitive known system containing debris disk and planets in the Galaxy.
Acknowledgements
S.R.F. acknowledges support from a Comunidad de Madrid postdoctoral fellowship under grant number 2017-T2/TIC-5592. His work has been supported by the Madrid Government under the Multiannual Agreement with UCM in the line Program to Stimulate Research for Young Doctors in the context of the VPRICIT under grant number PR65/19-22462. SRF also acknowledges financial support from MINECO under grant number AYA2017-90589-REDT, RTI2018-096188-B-I00, and S2018/NMT-429. F.L.A. and P.C. acknowledge the support from the Faculty of the European Space Astronomy Centre (ESAC), under funding reference number ESA-SCI-SC-LE-059. P.C. acknowledges financial support from the Government of Comunidad Autónoma de Madrid (Spain) via postdoctoral grant ‘Atracción de Talento Investigador’ 2019-T2/TIC-14760. C.C. acknowledges financial support from the Agencia Estatal de Investigación of the Ministerio de Ciencia y Universidades through project AYA2016-79425-C3-1/2/3-P. We sincerely appreciate the constructive comments of an anonymous referee.
Appendix A Calculations of Md
For the calculations to obtain Md, we used the relation (11) in Chen et al. (2014):
 (A.1)
(A.1)
where ρ is the mass density, equal to 3.3 gcm−3, R is the radius or the dust distance from the central star, and <a> is the radius of emitting grains equal to 5/3 a(min) in µm. This last value depends on the spectral type of the star, obtained from the tables presented in Chen et al. (2014). Also, LIR/L*. is the ratio between the luminosity of the dust emitting zone of the disk and the stellar luminosity. We present in Table A.1 the parameters included in the calculation of Md and their references.
Parameters of Md calculation
References
- Adibekyan, V. 2019, Geoscience, 9, 105 [NASA ADS] [CrossRef] [Google Scholar]
- Adibekyan, V.Z., Sousa, S.G., Santos, N.C., et al. 2012, A&A, 545, A32 [CrossRef] [EDP Sciences] [Google Scholar]
- Aguilera-Gómez, C., Ramírez, I., & Chanamé, J. 2018, A&A, 614, A55 [NASA ADS] [CrossRef] [EDP Sciences] [Google Scholar]
- Beichman, C.A., Bryden, G., Stapelfeldt, K.R., et al. 2006, ApJ, 652, 1674 [NASA ADS] [CrossRef] [Google Scholar]
- Bensby, T., & Lind, K. 2018, A&A, 615, A151 [NASA ADS] [CrossRef] [EDP Sciences] [Google Scholar]
- Bensby, T., Feltzing, S., Lundström, I., & Ilyin, I. 2005, A&A, 433, 185 [NASA ADS] [CrossRef] [EDP Sciences] [Google Scholar]
- Bensby, T., Feltzing, S., & Oey, M.S. 2014, A&A, 562, A71 [NASA ADS] [CrossRef] [EDP Sciences] [Google Scholar]
- Berger, T.A., Howard, A.W., & Boesgaard, A.M. 2018, ApJ, 855, 115 [NASA ADS] [CrossRef] [Google Scholar]
- Bonfanti, A., Ortolani, S., & Nascimbeni, V. 2016, A&A, 585, A5 [NASA ADS] [CrossRef] [EDP Sciences] [Google Scholar]
- Brewer, J.M., Fischer, D.A., Valenti, J.A., & Piskunov, N. 2016, ApJS, 225, 32 [NASA ADS] [CrossRef] [Google Scholar]
- Bryden, G., Beichman, C.A., Carpenter, J.M., et al. 2009, ApJ, 705, 1226 [NASA ADS] [CrossRef] [Google Scholar]
- Buchhave, L.A., Bizzarro, M., Latham, D.W., et al. 2014, Nature, 509, 593 [NASA ADS] [CrossRef] [Google Scholar]
- Campante, T.L., Barclay, T., Swift, J.J., et al. 2015, ApJ, 799, 170 [NASA ADS] [CrossRef] [Google Scholar]
- Chambers, J.E. 2001, Icarus, 152, 205 [NASA ADS] [CrossRef] [Google Scholar]
- Chiappini, C., Anders, F., Rodrigues, T.S., et al. 2015, A&A, 576, L12 [NASA ADS] [CrossRef] [EDP Sciences] [Google Scholar]
- Courcol, B., Bouchy, F., & Deleuil, M. 2016, MNRAS, 461, 1841 [Google Scholar]
- Chavero, C., de la Reza, R., Ghezzi, L., et al. 2019, MNRAS, 487, 3162 [Google Scholar]
- Chen, C.H., Mittal, T., Kuchner, M., et al. 2014, ApJS, 211, 25 [NASA ADS] [CrossRef] [Google Scholar]
- Casagrande, L., Schönrich, R., Asplund, M., et al. 2011, A&A, 530, A138 [NASA ADS] [CrossRef] [EDP Sciences] [Google Scholar]
- Dantas, M.L.L., Guiglion, G., Smiljanic, R., et al. 2022, A&A, 668, L7 [NASA ADS] [CrossRef] [EDP Sciences] [Google Scholar]
- Delgado Mena, E., Bertrán de Lis, S., Adibekyan, V.Z., et al. 2015, A&A, 576, A69 [NASA ADS] [CrossRef] [EDP Sciences] [Google Scholar]
- Delgado Mena, E., Tsantaki, M., Adibekyan, V.Z., et al., 2017 A&A, 606, A94 [NASA ADS] [CrossRef] [EDP Sciences] [Google Scholar]
- Delgado Mena, E., Moya, A., Adibekyan, V., et al. 2019, A&A, 624, A78 [NASA ADS] [CrossRef] [EDP Sciences] [Google Scholar]
- Di Ruscio, A., Fienga, A., Bernus, L., et al. 2020, EPSC, 14, EPSC2020-804, https://doi.org/10.5194/epsc2020-804 [Google Scholar]
- Dodson-Robinson, S.E., Beichman, C.A., Carpenter, J.M., & Bryden, G. 2011, AJ, 141, 11 [NASA ADS] [CrossRef] [Google Scholar]
- Drazkowska, J., & Dullemond, C.P. 2018, A&A, 614, A62 [NASA ADS] [CrossRef] [EDP Sciences] [Google Scholar]
- Edvardsson, B., Andersen, J., Gustafsson, B., et al. 1993, A&A, 275, 101 [NASA ADS] [Google Scholar]
- Eggenberger, P., Haemmerlé, L., Meynet, G., & Maeder A. 2012, A&A, 539, A70 [NASA ADS] [CrossRef] [EDP Sciences] [Google Scholar]
- Fischer, D.A., & Valenti, J. 2005, ApJ, 622, 1102 [NASA ADS] [CrossRef] [Google Scholar]
- Gaia Collaboration (Brown, A.G.A., et al.) 2018, A&A, 616, A1 [NASA ADS] [CrossRef] [EDP Sciences] [Google Scholar]
- Gáspár, A., Rieke, G.H., & Ballering, N. 2016, ApJ, 826, 171 [CrossRef] [Google Scholar]
- Ghezzi, L., Cunha, K., Smith, V.V., & de la Reza, R. 2010, ApJ, 724, 154 [NASA ADS] [CrossRef] [Google Scholar]
- Gonzalez, G. 1997, MNRAS, 285, 403 [Google Scholar]
- Greaves, J.S., Wyatt, M.C., Holland, W.S., & Dent, W.R.F. 2004, MNRAS, 351, L54 [NASA ADS] [CrossRef] [Google Scholar]
- Greaves, J.S., Fischer, D.A., & Wyatt, M.C. 2006, MNRAS, 366, 283 [NASA ADS] [CrossRef] [Google Scholar]
- Guiglion, G., Chiappini, C., Romano, D., et al. 2019, A&A, 623, A99 [NASA ADS] [CrossRef] [EDP Sciences] [Google Scholar]
- Hasegawa, Y., & Hirashita, H. 2014, ApJ, 788, 62 [NASA ADS] [CrossRef] [Google Scholar]
- Haywood, M., Di Matteo, P., Lehnert, M.D., Katz, D., & Gómez, A. 2013, A&A, 560, A109 [CrossRef] [EDP Sciences] [Google Scholar]
- Haywood, M., Lehnert, M.D., Di Matteo, P., et al. 2016, A&A, 589, A66 [NASA ADS] [CrossRef] [EDP Sciences] [Google Scholar]
- Hojjatpanah, S., Figueira, P., Santos, N.C., et al. 2019, A&A, 629, A80 [NASA ADS] [CrossRef] [EDP Sciences] [Google Scholar]
- Holmberg, J., Nordström, B., & Andersen, J. 2009, A&A, 501, 941 [NASA ADS] [CrossRef] [EDP Sciences] [Google Scholar]
- Ishigaki, M.N., Chiba, M., & Aoki, W. 2012, ApJ, 753, 64 [NASA ADS] [CrossRef] [Google Scholar]
- Kóspál, Á., Ardila, D.R., Moór, A., & Ábrahám, P. 2009, ApJ, 700, L73 [CrossRef] [Google Scholar]
- Kenyon, S.J., & Bromley, B.C. 2008, ApJS, 179, 451 [NASA ADS] [CrossRef] [Google Scholar]
- Kennedy, G.M., & Wyatt, M.C. 2014, MNRAS, 444, 3164 [NASA ADS] [CrossRef] [Google Scholar]
- Lambert, D.L. 1987, JApA, 8, 103 [NASA ADS] [Google Scholar]
- Lawler, S.M., Di Francesco, J., Kennedy, G.M., et al. 2014, MNRAS, 444, 2665 [NASA ADS] [CrossRef] [Google Scholar]
- Llorente de Andrés, F., Chavero, C., de la Reza, R., Roca-Fàbrega, S., & Cifuentes, C. 2021, A&A, 654, A137 [NASA ADS] [CrossRef] [EDP Sciences] [Google Scholar]
- Luck, R.E. 2017, AJ, 153, 21 [Google Scholar]
- MacGregor, M.A., Lawler, S.M., Wilner, D.J., et al. 2016, ApJ, 828, 113 [NASA ADS] [CrossRef] [Google Scholar]
- McWilliam, A. 1997, ARA&A, 35, 503 [NASA ADS] [CrossRef] [Google Scholar]
- Maldonado, J., Eiroa, C., Villaver, E., Montesinos, B., & Mora, A. 2012, A&A, 541, A40 [NASA ADS] [CrossRef] [EDP Sciences] [Google Scholar]
- Maoz, D., & Graur, O. 2017, ApJ, 848, 25 [Google Scholar]
- Marshall, J.P., Moro-Martín, A., Eiroa, C., et al. 2014, A&A, 565, A15 [NASA ADS] [CrossRef] [EDP Sciences] [Google Scholar]
- Matthews, B.C., Krivov, A.V., Wyatt, M.C., Bryden, G., & Eiroa, C. 2014, prpl.conf, 521 [Google Scholar]
- Montesinos, B., Eiroa, C., Krivov, A.V., et al. 2016, A&A, 593, A51 [NASA ADS] [CrossRef] [EDP Sciences] [Google Scholar]
- Mor, R., Robin, A.C., Figueras, F., Roca-Fàbrega, S., & Luri, X. 2019, A&A, 624, A1 [Google Scholar]
- Najita, J.R., Kenyon, S.J., & Bromley, B.C. 2022, ApJ, 925, 45 [NASA ADS] [CrossRef] [Google Scholar]
- Navarro, J.F., Abadi, M.G., Venn, K.A., Freeman, K.C., & Anguiano, B. 2011, MNRAS, 412, 1203 [Google Scholar]
- Nissen, P.E. 2015, A&A, 579, A52 [NASA ADS] [CrossRef] [EDP Sciences] [Google Scholar]
- Pace, G. 2013, A&A, 551, A8 [Google Scholar]
- Pascucci, I., Testi, L., Herczeg, G.J., et al. 2016, ApJ, 831, 125 [NASA ADS] [CrossRef] [Google Scholar]
- Pitjeva, E.V., & Pitjev, N.P. 2018, AstL, 44, 554 [NASA ADS] [Google Scholar]
- Pollack, J.B., Hubickyj, O., Bodenheimer, P., et al. 1996, Icarus, 124, 62 [Google Scholar]
- Ramírez, I., Fish, J.R., Lambert, D.L., & Allende Prieto, C. 2012, ApJ, 756, 46 [CrossRef] [Google Scholar]
- Ramírez, I., Meléndez, J., & Asplund, M. 2014, A&A, 561, A7 [NASA ADS] [CrossRef] [EDP Sciences] [Google Scholar]
- Rebolo, R., & Beckman, J.E. 1988, A&A, 201, 267 [NASA ADS] [Google Scholar]
- Rebolo, R., Molaro, P., & Beckman, J.E. 1988, A&A, 192, 192 [NASA ADS] [Google Scholar]
- Roca-Fàbrega, S., Llorente de Andrés, F., Chavero, C., Cifuentes, C., & de la Reza, R. 2021, A&A, 656, A64 [NASA ADS] [CrossRef] [EDP Sciences] [Google Scholar]
- Shchekinov, Y.A., Safonova, M., & Murthy, J. 2013, Ap&SS, 346, 31 [NASA ADS] [CrossRef] [Google Scholar]
- Silva Aguirre, V., Davies, G.R., Basu, S., et al. 2015, MNRAS, 452, 2127 [NASA ADS] [CrossRef] [Google Scholar]
- Sheehan, C.K.W., Greaves, J.S., Bryden, G., et al. 2010, MNRAS, 408, L90 [NASA ADS] [CrossRef] [Google Scholar]
- Sibthorpe, B., Kennedy, G.M., Wyatt, M.C., et al. 2018, MNRAS, 475, 3046 [NASA ADS] [CrossRef] [Google Scholar]
- Soubiran, C., & Girard, P. 2005 A&A, 438, 139 [NASA ADS] [CrossRef] [EDP Sciences] [Google Scholar]
- Soubiran, C., Bienaymé, O., & Siebert, A. 2003, A&A, 398, 141 [NASA ADS] [CrossRef] [EDP Sciences] [Google Scholar]
- Soubiran, C., Bienaymé, O., Mishenina, T.V., & Kovtyukh, V.V. 2008, A&A, 480, 91 [NASA ADS] [CrossRef] [EDP Sciences] [Google Scholar]
- Sousa, S.G., Adibekyan, V., Delgado-Mena, E., et al. 2018, A&A, 620, A58 [NASA ADS] [CrossRef] [EDP Sciences] [Google Scholar]
- Sousa, S.G., Adibekyan, V., Santos, N.C., et al. 2019, MNRAS, 485, 3981 [NASA ADS] [CrossRef] [Google Scholar]
- Tautvaisiené, G., Mikolaitis, S., Drazdauskas, A., et al. 2020, ApJS, 248, 19 [NASA ADS] [CrossRef] [Google Scholar]
- Testi, L., Birnstiel, T., Ricci, L., et al. 2014, Protostars and Planets VI, eds. H. Beuther, R.S. Klessen, C.P. Dullemond, & T. Henning (Tucson: University of Arizona Press), 339 [Google Scholar]
- Valenti, J.A., & Fischer, D.A. 2005, ApJS, 159, 141 [NASA ADS] [CrossRef] [Google Scholar]
- van den Hoek, L.B., & de Jong, T. 1997, A&A, 318, 231 [NASA ADS] [Google Scholar]
- Williams, J.P., & Cieza, L.A. 2011, ARA&A, 49, 67 [CrossRef] [Google Scholar]
- Wyatt, M.C. 2005, A&A, 440, 937 [NASA ADS] [CrossRef] [EDP Sciences] [Google Scholar]
- Wyatt, M.C. 2008, ARA&A, 46, 339 [NASA ADS] [CrossRef] [Google Scholar]
- Wyatt, M.C. 2018, Handbook of Exoplanets (Springer International Publishing AG), 146 [Google Scholar]
- Xiang, M., & Rix, H.-W. 2022, Nature, 603, 599 [NASA ADS] [CrossRef] [Google Scholar]
All Tables
All Figures
|
Fig. 1 [α/Fe] versus [Fe/H]. Panel a: distribution of abundances of [Ti/Fe] versus [Fe/H] of stars in Table 1. Symbols indicate the star’s class: DDP (squares), DD (triangles), CP (circles). The black line separates the stars as belonging to the thin (below) or thick (above) disks following the definition presented by Bensby et al. (2014). Colors show stars that fulfil both the chemistry-based and the kinematic criteria to belong to the thin (red) and/or the thick (blue) disk populations (see Sects. 2.1 and 2.3). In yellow we show the stars that are in a “transitory stage” between the two disk populations according to its kinematics. Stars surrounded by a red circle indicate they belong to the HAHM population, as defined by Adibekyan et al. (2012). Finally, the size of the symbols qualitatively indicate the stellar ages, being the smallest the youngest. Panel b: same details as in panel a but considering the average between [O/Fe], [Si/Fe], and [Mg/Fe] as a function of [Fe/H]. The grey dashed line shows the limit between the thin- and thick-disk stars in the [a/Fe] versus [Fe/H] space. |
| In the text | |
|
Fig. 2 Toomre diagram of the stars presented in Table 1. Symbols and colors are the same as in Fig. 1. The Galactic space velocities (U, V, W) are relative to the local standard of rest. Dashed lines represent curves of constant peculiar velocities of 100 and 200 km s–1. |
| In the text | |
|
Fig. 3 Stellar mass of the DDP stars of Table 1 versus [Fe/H]. Blue dots show the observational data and the solid black line shows the best linear regression (y = ax + b), calculated using bootstrapping method weighted by the errors of metallicity, the parameter values are shown in the box below the figure. The shaded blue area shows the 68 per cent confidence band of the bootstrapping fit. |
| In the text | |
|
Fig. 4 In this figure, we show the stellar disk masses of DD stars (in lunar masses) of part of the Chen et al. (2014) catalog, as a function of [Fe/H]. Red points are the values of the masses given in the second disk distance model (Md2) of this catalog. Blue points are the values corresponding to the single distance model (Md). Green triangles are the DDP stars of Table 1 with Md values both from Chen’s catalog and the three computed in the current work (see Sect. 3). The green solid line shows the best linear regression (y = ax + b), calculated using a bootstrapping method weighted by the errors on metallicity for all the DDP stars with known Md – but excluding the HAHM objects that have a different origin than those studied here (see discussion in Sect. 5). The parameter values are shown in the box below the figure. The shaded blue area shows the 68% confidence band of the bootstrapping fit. |
| In the text | |
|
Fig. 5 A(Li) as a function of [Fe/H] for all stars listed in Table 1, shown as two different branches. The top branch, with A(Li) > 1.0, represents the expected Li evolution in the Galactic thin disk. The bottom branch, with very depleted Li values less than 1.0, contains a mixture of thick-disk stars in the low-metallicity domain with [Fe/H] < −0.2 and thin-disk stars with larger metallicities values up to 0.28. Among the thin-disk, Li-depleted stars, with −0.15 < [Fe/H] < 0.01, we include the HAHM stars discussed in Sect. 2.1 The corresponding ages (a) and the U Galactic radial velocities (b) are shown in vertical color scales. |
| In the text | |
Current usage metrics show cumulative count of Article Views (full-text article views including HTML views, PDF and ePub downloads, according to the available data) and Abstracts Views on Vision4Press platform.
Data correspond to usage on the plateform after 2015. The current usage metrics is available 48-96 hours after online publication and is updated daily on week days.
Initial download of the metrics may take a while.