Fig. 1
Download original image
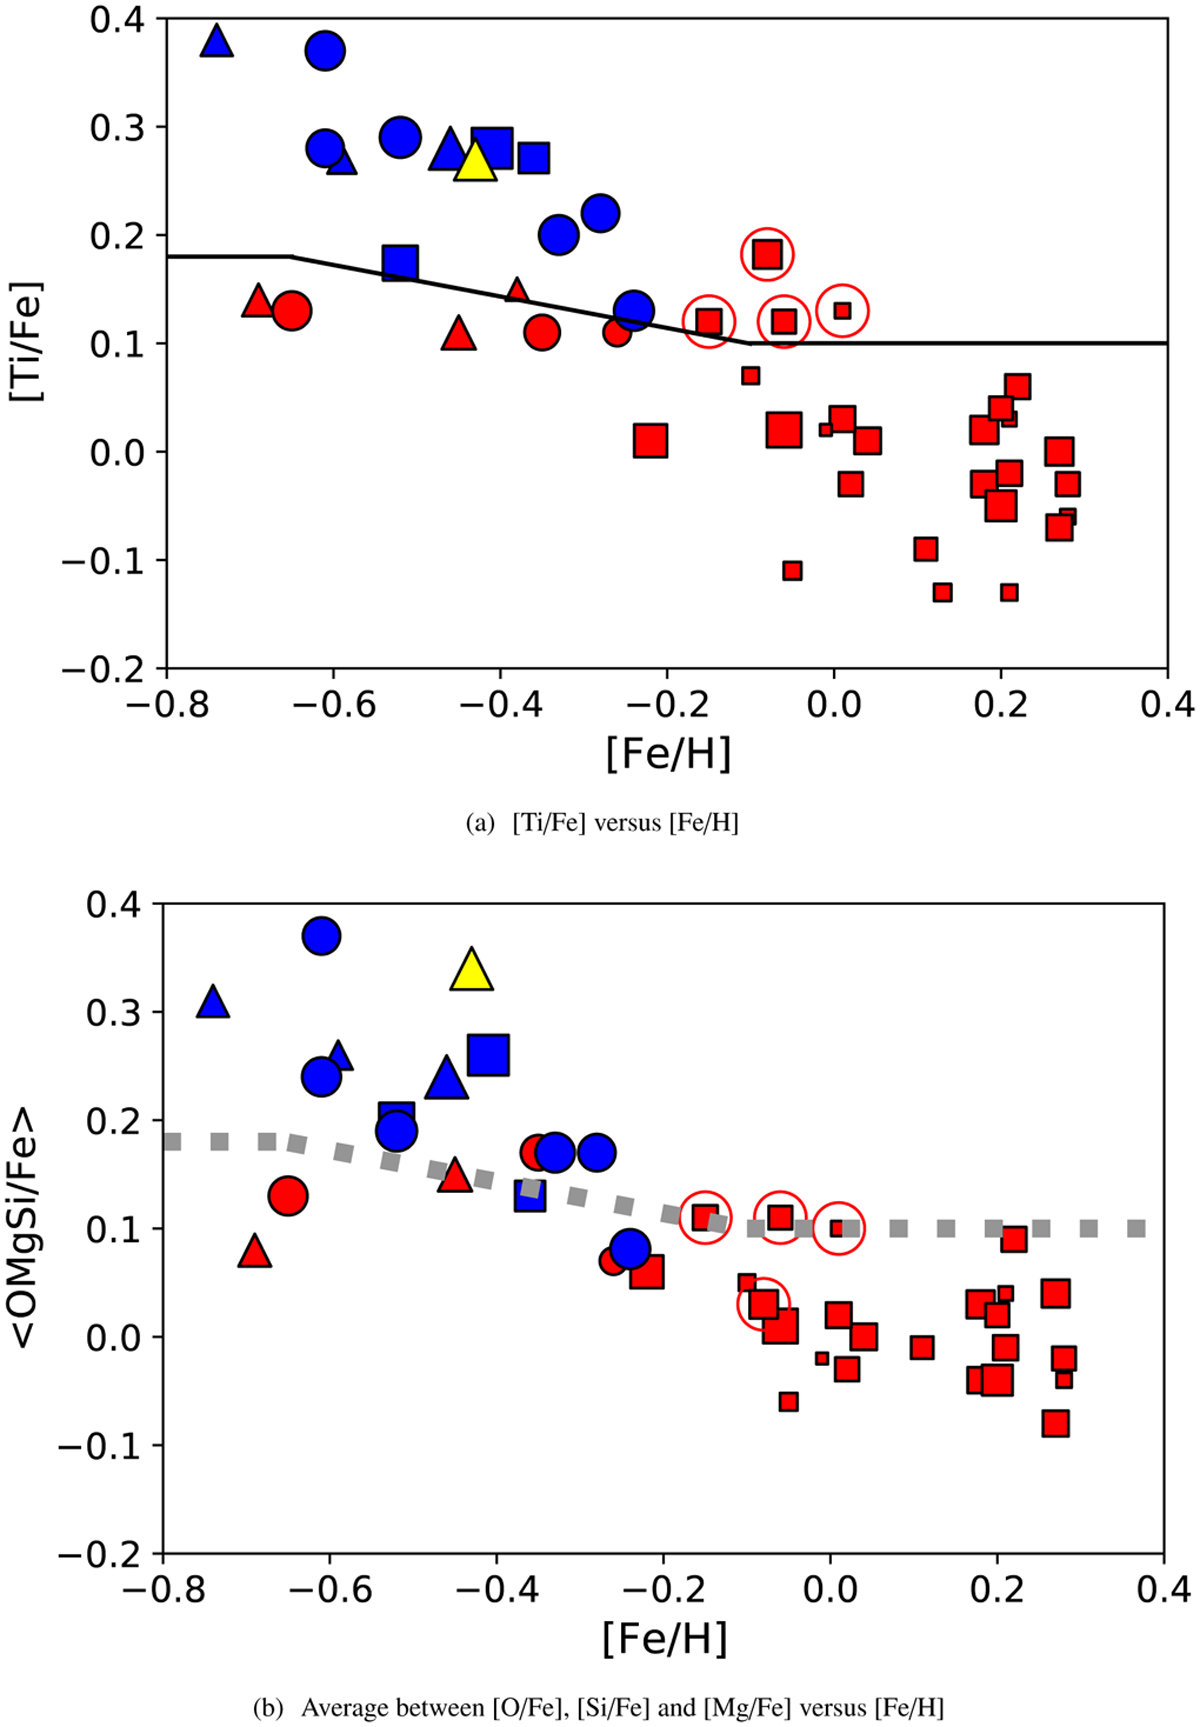
[α/Fe] versus [Fe/H]. Panel a: distribution of abundances of [Ti/Fe] versus [Fe/H] of stars in Table 1. Symbols indicate the star’s class: DDP (squares), DD (triangles), CP (circles). The black line separates the stars as belonging to the thin (below) or thick (above) disks following the definition presented by Bensby et al. (2014). Colors show stars that fulfil both the chemistry-based and the kinematic criteria to belong to the thin (red) and/or the thick (blue) disk populations (see Sects. 2.1 and 2.3). In yellow we show the stars that are in a “transitory stage” between the two disk populations according to its kinematics. Stars surrounded by a red circle indicate they belong to the HAHM population, as defined by Adibekyan et al. (2012). Finally, the size of the symbols qualitatively indicate the stellar ages, being the smallest the youngest. Panel b: same details as in panel a but considering the average between [O/Fe], [Si/Fe], and [Mg/Fe] as a function of [Fe/H]. The grey dashed line shows the limit between the thin- and thick-disk stars in the [a/Fe] versus [Fe/H] space.
Current usage metrics show cumulative count of Article Views (full-text article views including HTML views, PDF and ePub downloads, according to the available data) and Abstracts Views on Vision4Press platform.
Data correspond to usage on the plateform after 2015. The current usage metrics is available 48-96 hours after online publication and is updated daily on week days.
Initial download of the metrics may take a while.