Fig. 3
Download original image
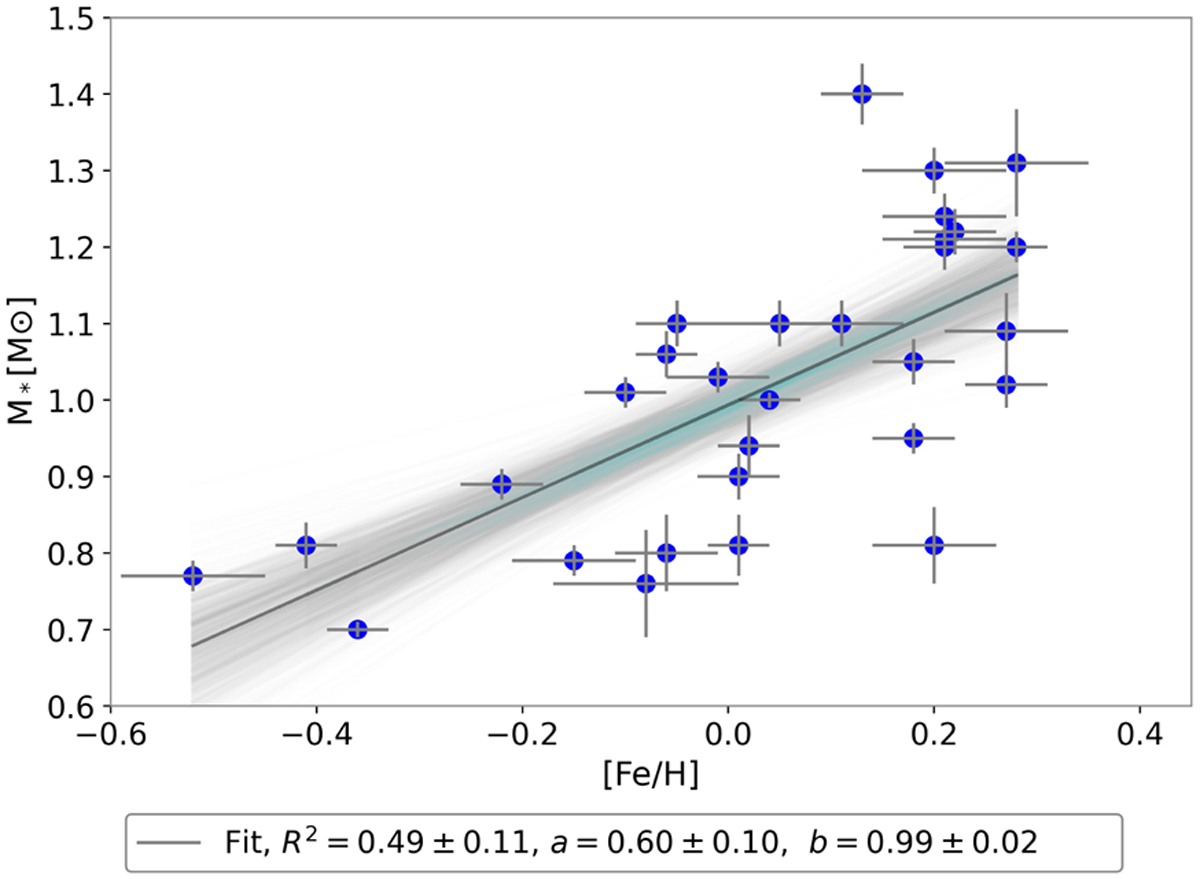
Stellar mass of the DDP stars of Table 1 versus [Fe/H]. Blue dots show the observational data and the solid black line shows the best linear regression (y = ax + b), calculated using bootstrapping method weighted by the errors of metallicity, the parameter values are shown in the box below the figure. The shaded blue area shows the 68 per cent confidence band of the bootstrapping fit.
Current usage metrics show cumulative count of Article Views (full-text article views including HTML views, PDF and ePub downloads, according to the available data) and Abstracts Views on Vision4Press platform.
Data correspond to usage on the plateform after 2015. The current usage metrics is available 48-96 hours after online publication and is updated daily on week days.
Initial download of the metrics may take a while.