Fig. 4
Download original image
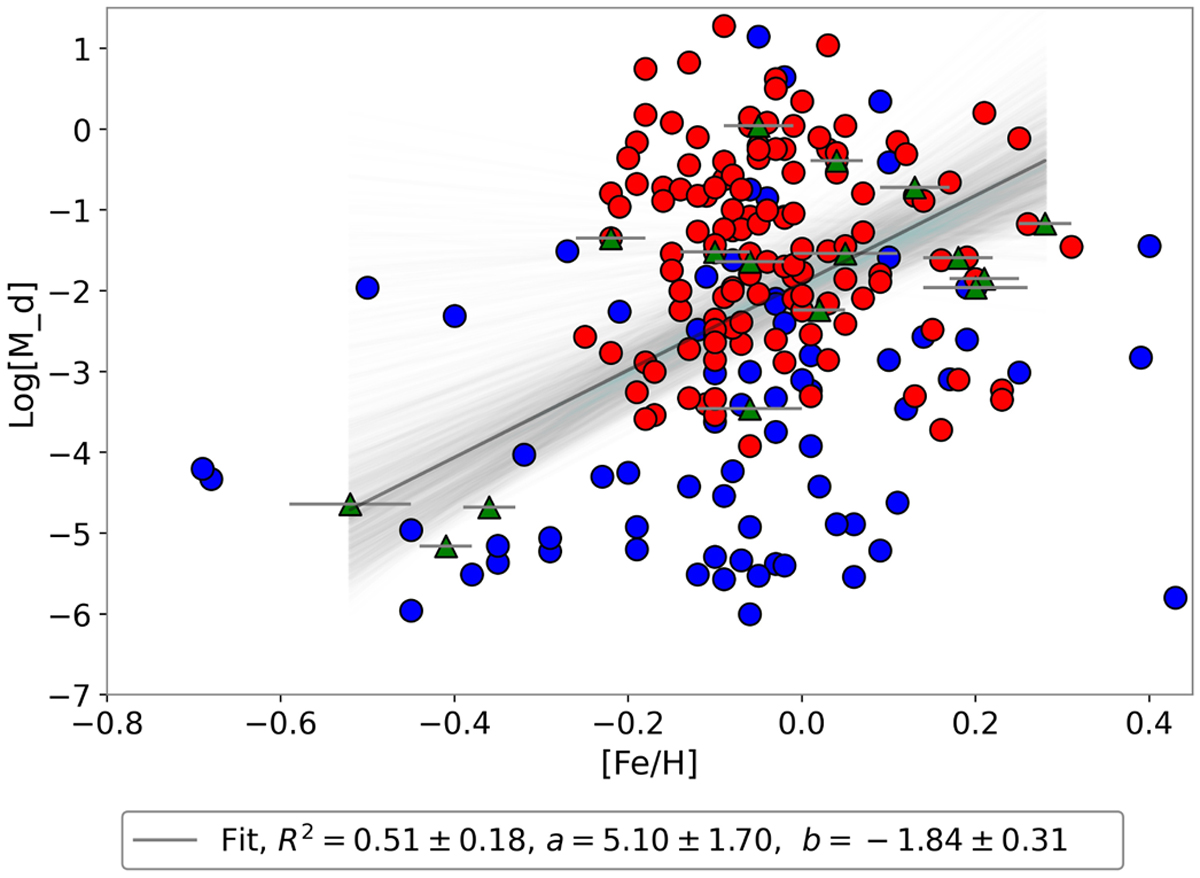
In this figure, we show the stellar disk masses of DD stars (in lunar masses) of part of the Chen et al. (2014) catalog, as a function of [Fe/H]. Red points are the values of the masses given in the second disk distance model (Md2) of this catalog. Blue points are the values corresponding to the single distance model (Md). Green triangles are the DDP stars of Table 1 with Md values both from Chen’s catalog and the three computed in the current work (see Sect. 3). The green solid line shows the best linear regression (y = ax + b), calculated using a bootstrapping method weighted by the errors on metallicity for all the DDP stars with known Md – but excluding the HAHM objects that have a different origin than those studied here (see discussion in Sect. 5). The parameter values are shown in the box below the figure. The shaded blue area shows the 68% confidence band of the bootstrapping fit.
Current usage metrics show cumulative count of Article Views (full-text article views including HTML views, PDF and ePub downloads, according to the available data) and Abstracts Views on Vision4Press platform.
Data correspond to usage on the plateform after 2015. The current usage metrics is available 48-96 hours after online publication and is updated daily on week days.
Initial download of the metrics may take a while.