| Issue |
A&A
Volume 670, February 2023
|
|
|---|---|---|
| Article Number | A175 | |
| Number of page(s) | 15 | |
| Section | Atomic, molecular, and nuclear data | |
| DOI | https://doi.org/10.1051/0004-6361/202245472 | |
| Published online | 23 February 2023 | |
Spectroscopic investigation of interstellar hydrogenated carbon clusters
Infrared and optical spectra of C24Hn populations
1
Laboratoire de Chimie et Physique Quantiques (LCPQ), Fédération FeRMI, CNRS & Université Toulouse [UT3],
31062
Toulouse, France
e-mail: This email address is being protected from spambots. You need JavaScript enabled to view it.
2
Departamento de Química, Universidad Autónoma de Madrid,
Módulo 13,
28049
Madrid, Spain
3
Institut des Sciences Moléculaires d’Orsay (ISMO), CNRS, Université Paris-Saclay,
91405
Orsay, France
Received:
15
November
2022
Accepted:
12
January
2023
Abstract
Context. The assignment of the mid-infrared (mid-IR) emission features and plateaus observed in C-rich and H-rich regions of the interstellar medium (ISM) is still debated. Such mid-IR assignments must also be related to their contribution to the extinction curve in our galaxy and to the ultraviolet (UV) bump.
Aims. The aim of this work is to investigate the influence of hydrogenation rate on the mid-IR spectra of populations of carbon clusters in order to constraint the nH/nC ratios in regions of the ISM where carbon is an important component. Their potential contribution to the extinction curve and in particular to the UV bump is also investigated.
Methods. The absorption IR and optical spectra of tens of thousands of C24Hn (n = 0, 6, 12, 18, 24) isomers classified into structural families – namely flakes, branched, pretzels, and cages – were computed using the density functional based tight binding electronic structure method and its time-dependent version, respectively. Final spectra were obtained by averaging the spectra of many individual isomers.
Results. The shapes and the relative intensities of the bands centered at ~3.25 and 3.40 µm and assigned to the C–H stretch of sp2 and sp3 carbon atoms, respectively, present a clear dependence on the nH/nC ratio. From a comparison with the astronomical spectrum from the Orion bar H2S1, the most interesting emitting candidates would pertain to the flakes population; this is the most energetically favorable family of clusters, possessing a high content of five and six carbon rings and being mostly planar, with no sp1 carbon atoms and with a nH/nC ratio of lower than 0.5. The same conclusion is drawn when comparing the computed IR features in the [4–20 µm] region with the observed plateaus from some C-rich and H-rich planetary nebulae objects of the Small Magellanic Cloud. The contribution of the same family could be considered for the UV bump. When nH/nC increases, only a contribution to the high-energy part of the continuum due to σ → π✶ excitations can reasonably be considered.
Conclusions. These results bring some constraints on the structural features and on the nH/nC ratio of the hydrogenated carbon populations emitting in the mid-IR domain in interstellar objects such as protoplanetary and reflection nebulae. The flakes population, with a low nH/nC ratio, is an interesting candidate for the carbon population emitting in these regions, but not for that absorbing in the diffuse ISM. None of the populations studied in the present work can account for the UV bump, but they would contribute to a broad extinction rise in this domain. The computed features reported in this article could be used to interpret future astronomical data provided by the James Webb Space Telescope.
Key words: astrochemistry / infrared: ISM / ultraviolet: ISM / ISM: general
© The Authors 2023
 Open Access article, published by EDP Sciences, under the terms of the Creative Commons Attribution License (https://creativecommons.org/licenses/by/4.0), which permits unrestricted use, distribution, and reproduction in any medium, provided the original work is properly cited.
This article is published in open access under the Subscribe to Open model. This email address is being protected from spambots. You need JavaScript enabled to view it. to support open access publication.
1 Introduction
Due to its allotropy, a large fraction of interstellar carbon is expected to be included in large molecules or in dust grains with various degrees of organization and aromaticity, including fullerenes, polycyclic aromatic hydrocarbons (PAHs), and amorphous possibly hydrogenated carbon grains (Dartois 2019). PAHs have attracted considerable and sustained interest since the proposal in the mid-1980s, based on their photophysical emission properties, that they are the carriers of the aromatic infrared bands (AIBs), a set of mid-IR emission bands observed at about 3.3, 6.2, 7.7, 8.6, 11.3, and 12.7 µm in many regions of the interstellar medium (ISM; Allamandola et al. 1985; Léger & Puget 1984). However, it is only very recently that specific PAH molecules (two cyano-naphthalene isomers and indene) have been successfully detected (McGuire et al. 2021; Cernicharo et al. 2021). Some years earlier, the detection of C60 and C70 fullerenes in various nebulae was confirmed (Cami et al. 2010; Sellgren et al. 2010). In general, the identification of the specific molecular carriers of the AIBs is challenging, as they are presumably contributed by many unknown species that emit in the same regions of the spectra, therefore leaving many questions still open (Hansen et al. 2022).
Starting in the mid-1980s, the identification of the carriers of the AIBs motivated experimental and theoretical studies of individual molecules. In particular, quantum chemical calculations, mainly based on density functional theory (DFT) calculations, proved to be very powerful in computing the infrared (IR) features of many individual PAHs of different sizes and shapes (Bauschlicher et al. 2009; Ricca et al. 2012), neutral or charged (Banhatti et al. 2021), with varying hydrogenation degree (Mackie et al. 2015; Pla et al. 2020), and incorporating heteroatoms (Hudgins et al. 2005; Oliveira et al. 2020) or complexed to a metal atom (Simon & Joblin 2010). Such calculations were also used to build spectroscopic databases of PAHs (Malloci et al. 2007a; Bauschlicher et al. 2018). However, the AIBs not only include discrete bands but also broad plateaus, which are a collection of broad blended features whose carriers remain elusive (Shannon et al. 2018). For instance, fullerenerich planetary nebulae were observed to exhibit a broad plateau with substructure in the 6–9 µm range (García-Hernández et al. 2010, 2011b,a, 2012; Bernard-Salas et al. 2012). Several types of carriers were proposed, including hydrogenated amorphous carbon (HAC) compounds (Bernard-Salas et al. 2012) and very small grains (Tielens 2008; Buss et al. 1993). Very recently, intensive quantum calculations showed that a so-called cages population of C60 – containing hundreds of thousands of isomers characterized by a low asphericity and a high fraction of sp2 carbon atoms – was a good candidate to carry the 6–9 µm plateau (Dubosq et al. 2019), while the planar polyaromatic population (PPAs, or flakes) was shown to possess features in the 8–10 µm range. However, the so-far unexplained astronomical features of planetary nebulae in the 10–15 µm range could not be reproduced by any of the studied populations of C60, that is, neither the more organized (cages, PPAs or flakes) nor the more amorphous ones (pretzels and branched), addressing the possible contribution of hydrogenated carbon populations.
The 3 µm region of the IR spectra is especially relevant for hydrogenated carbon compounds as it accounts for the C-H stretching features. In many regions of the ISM, the 3.3 µm emission is dominant and associated to aromatic C-H stretching in polyaromatic systems. This feature is often accompanied by weaker emission bands at around 3.4 µm on top of a fainter emission plateau, which was assigned to methylene (−CH2) and methyl (−CH3) aliphatic resonances, but the exact identification of the carriers remains under debate. It was indeed proposed to be due to the emission from highly excited superhydrogenated PAHs (Bernstein et al. 1996; Wagner et al. 2000), which are expected be stable and to form efficiently in the ISM while also having a catalytic role in the formation of H2 (Thrower et al. 2012). Methylated PAHs were also proposed (Wagner et al. 2000). The analysis of the 3.4 µm band with respect to experiments and computations on pure aliphatic carbon molecules (alkanes) revealed that the −CH2/−CH3 fraction depended on the object and that, in dark clouds, −CH3 groups were suppressed while the −CH2 groups remained abundant (Duley et al. 2005). In parallel, a 3.4 µm absorption band with a different profile has been widely observed in the diffuse ISM (Sandford 1991; Godard et al. 2012; Li & Draine 2012). This band was assigned to a hydrogenated amorphous carbon dust component and presents substructures at 3.38, 3.48, 3.42, and 3.50 µm that were assigned to asymmetric and symmetric C–H stretching modes of −CH3 and −CH2 groups, respectively (see Godard et al. 2012 and references therein). A contribution of molecular PAHs with excess hydrogens has also been proposed (Steglich et al. 2013). In the ISM, the stronger the UV radiation field, the lower the 3.4/3.3 µm intensity ratio is, which could be interpreted as a consequence of the photodestruction of the more fragile aliphatic bonds (Pilleri et al. 2015). Interestingly, the effect of cosmic rays on this band was studied experimentally (Godard et al. 2011; Dartois et al. 2017), showing the evolution of the band when the aliphatic C-H bands are destroyed and, through an appropriate modeling, that the destruction of just these grains by cosmic rays cannot account for the disappearance of the 3.4 µm IR feature in denser regions.
Determining the exact nature of the carbon compounds contributing to the ultraviolet (UV) bump (Stecher 1965) has also been of longstanding interest. The UV bump is a broad ultraviolet absorption bump observed on the ISM extinction curves in systems ranging from the Milky Way to high-redshift galaxies, with a position centered at 217.5 nm (5.77 eV or 4.65 µm−1) stable to ~2% with relatively large variations in width (0.75–1.3 µm−1) in different lines of sight (Fitzpatrick & Massa 1986, 2007; Fitzpatrick et al. 2019). Interestingly, the variations in the width and shape of the UV bump have been shown to be related to the presence of defects within the sp2 conjugated carbon network and several theoretical and experimental studies were subsequently carried out to unravel the structural origin of these variations. The contribution of disordered species under the form of HAC (Jones et al. 1990; Gadallah et al. 2011) and soot particles (see Gavilan et al. (2017) and references therein) was proposed. In an attempt to establish correlations between carbon-grain morphology and spectral data, Rotundi et al. (1998) proposed that carbon nanostructures ordered on the micrometer scale could be better candidates to explain the UV bump than graphitic particles. Recent quantum modeling also showed that a population of carbon spherical isomers with a high fraction of conjugated sp2 atoms, the so-called cages population, could contribute to the astronomical UV bump (Dubosq et al. 2020).
In this work, we aim to investigate the contribution of populations of C24Hn (n = 0, 6, 12, 18, 24) encompassing tens of thousands of isomers to emission IR features in the [3–3.5 µm] domain and to the AIB plateaus. Their UV-visible spectral signatures are also investigated to probe their possible contribution to the UV bump. To this end, intensive quantum chemical calculations were performed using an approximate DFT scheme, namely self-consistent charge density functional based tight binding (SCC-DFTB; Elstner et al. 1998), which is a similar approach to that taken by Dubosq et al. (2019, 2020) to study pure carbon clusters Cn (n = 24, 42, 60). Indeed, as mentioned above, some astronomical features could not be accounted for by large pure carbon clusters, revealing the need to consider the role of hydrogenation. Therefore, in this article, we present the computed IR and UV-visible spectra of populations of C24Hn clusters (n = 0, 6, 12, 18, 24) that were determined and characterized in ourprevious work(Pla et al. 2021), as described in Sect. 2.1. The methodology used in this work to determine the individual IR and UV-visible (optical) spectra of hundreds of thousands of isomers is described in Sect. 2.2. The results are presented in Sect. 3 and the astrophysical implications are discussed in Sect. 4.
2 Methodology
2.1 Isomer landscapes of C24Hn populations
In our previous work, the potential energy surfaces of C24Hn (n = 0, 6, 12, 18, 24) clusters (tens of thousands of isomers per stoichiometry; see Table 1) were investigated using a genetic algorithm (Larsen et al. 2017) in combination with the density functional based tight binding (DFTB) potential (Porezag et al. 1995; Seifert et al. 1996; Elstner et al. 1998). Global exploration was achieved using the zeroth-order DFTB (DFTB0) Hamiltonian (Porezag et al. 1995; Seifert et al. 1996) and subsequent local optimization was performed using the second-order (self-consistent charge or SCC-) DFTB with the mio set of parameters (Elstner et al. 1998), and an empirical dispersion correction contribution (Rapacioli et al. 2009). The structural diversity was analyzed using order parameters, in particular the sum of the numbers of five- and six-carbon rings R5/6 and the asphericity parameter β, which we used to classify the populations of isomers into families (see e.g., the 2D map for C24H12 on top of Fig. 1, along with an example of one isomer of each family for C24Hn (n = 6, 12, 18, 24) at the bottom of Fig. 1).
The most abundant and lowest-energy population, which we designated the flakes population, is made up of isomers of various shapes and large R5/6 values (see Table 1). Flakes are characterized by an increasing number of spherical isomers when nH/nC increases (Pla et al. 2021). The second-most-abundant population, designated the branched population, contains the isomers with the smallest R5/6 values and remains the highest-energy population for all nH/nC ratios. The fraction of the pretzels population, which is made up of spherical isomers with smaller R5/6 values, is smaller but increases with nH/nC. Finally, the fraction of the cages population (largest R5/6 values), which was the major fraction and contained the greatest number of stable isomers in the case of C60, remains extremely minor (see Table 1). For all C24Hn (n = 0, 6, 12, 18, 24) clusters, the evolution of the carbon-ring size distribution with energy clearly shows a correlation between stability and the number of six-carbon rings. In addition, a result of astrophysical interest, especially regarding the role of carbon species in the gas ionization, is that the computed average values of the ionization potentials of all populations were found to decrease when nH/nC increases, ranging from 7.9 down to 6.4 eV. This trend was correlated to geometric and electronic factors, in particular to carbon hybridization (Pla et al. 2021).
Total number of structures per family and in total for each C24Hn system taken into account to compute the IR (roman) and optical spectra (italics).
2.2 Infrared and optical spectra of C24Hn populations
In this work, the IR absorption spectra of all independent isomers of C24Hn (n = 0, 6, 12, 18, 24) clusters were computed at the SCC-DFTB level of theory in the double harmonic approximation. The raw vibrational frequencies were scaled to match the best reference data in a two-step procedure: first, the SCC-DFTB frequencies were scaled in order to match DFT results (see Appendix A). Contrary to pure carbon clusters (Dubosq et al. 2019), determining scaling factors for hydrogenated carbon clusters was a challenge because of the resonance of C–H and C–C modes, for which scaling factors are different in the same regions of the spectrum. This leads to some uncertainties in the shape of the presented spectra in the [10–16 µm] region. Second, the DFT frequencies were scaled using the 0.9731 scaling factor previously determined in the [4–30 µm] region (Dubosq et al. 2019). Due to the larger anharmonicity of C–H stretching modes, these were scaled by 0.961 as determined by Bauschlicher et al. (2018) for the same functional and a similar basis set as the ones used in the present work. In the absence of clear information about the underlying thermodynamics, uniform populations were chosen to reconstruct the typical IR spectra of the four structural families from the individual contributions of each member. We are aware that such uniform distributions are an oversimplification of the energetics and this is a limitation of our approach. By summing over thousands of individual topologically distinct isomers, the spectra are necessarily broad and cannot account for sharp bands usually assigned to individual abundant molecules using more traditional methods.
Among these structures, a fraction was selected (see numbers in italics in Table 1) for electronic spectroscopy in order to save computational burden. These configurations were selected based on their values of ß, and R5/6 values lying near the average values of the entire sample for this family and within two standard deviations of the corresponding distribution. When the number of configurations meeting this criterion was considered too large with respect to computational time limitations, some were randomly removed. The time-dependent (TD) DFTB method in its linear response formulation derived by Niehaus et al. (2001) was used to calculate vertical excitation spectra for all minima in our SCC-DFTB sample. This method was carefully benchmarked in our previous article (Dubosq et al. 2020) and no additional benchmark was performed for the present study. The electronic spectrum was computed up to about 15 eV for all stoichiometries, which corresponds to the computation of 600 up to 900 roots for C24 to C24H24. However, as explained in our previous study, high excitations are likely to involve orbitals such as Rydberg orbitals (Malloci et al. 2007b), which are not present in our theoretical method due to the use of a confined minimal basis set. Such orbitals should not be involved in transition below 8 eV, that is to say that the transitions possibly contributing to the UV bump are not expected to be impacted. From the former benchmark by Dubosq et al. (2020), all computed transition energies are scaled by 0.988.
3 Results
3.1 Infrared spectra
In this section, we discuss the evolution of the IR spectra as a function of the hydrogenation rate, focusing on the most abundant and stable population, which encompasses the flakes isomers. The IR spectra for all hydrogenation rates are reported in Fig. 2c, with a zoom in the C–H stretching region in Fig. 2a. For the next-highest energy and less abundant family, that is the branched population, the spectra are reported in Fig. 2b and d. Interestingly, the features for these latter two populations are similar. The IR spectra of the pretzels population are reported in Figs. B.1a and c. The fraction of the pretzels population is small, except in the case of C24H24 where the energy distribution of the isomers is similar to that of the flakes population. Finally, the IR spectra of the cages isomers, which are much less abundant, are reported in Figs. B.1b and d. In order to interpret the IR features and their evolution in terms of structural and electronic characteristics, the ratio of C(spx)Hn (x = 1–3, n = 1–3) patterns with respect to all hydrogenated carbon atoms was determined for all stoichiometries and all families. The results are reported in Fig. 3 for the flakes and branched families, and in Fig. B.2 for the pretzels and cages families, which are expected to be less relevant based on energetic criteria and number of isomers, respectively. The precise assignment of the modes is based on an analysis of a reduced sample of isomers.
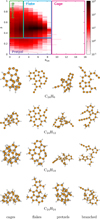 |
Fig. 1 Adapted from Pla et al. (2021). Two-dimensional distribution of the isomer population for C24H12 as a function of R5/6 and ß (top) and examples of isomers of C24Hn for the four families (bottom). |
3.1.1 C–H stretching modes: The [2.9–3.5 µm] region
The C–H stretching features of the flakes population of C24Hn (n = 6, 12, 18, 24) are reported in Fig. 2a. For all hydrogenation states, IR features were found to resonate in three main distinct wavelength (energy) domains: [2.99–3.00 µm], [3.16–3.30 µm], and [3.37–3.56 µm]. These globally correspond to the resonance of C–H stretches involving mainly sp1, sp2, and sp3 carbon atoms, respectively. As can be seen in Fig. 3 for the flakes and branched populations, and in Fig. B.2 for the pretzels and cages populations, the fraction of C(sp2)H moiety is by far the largest among all sp2 carbon atoms. Regarding sp3 carbon atoms, the C(sp3)H2 fraction, which is much smaller than that of C(sp2)H, is the dominant one. The fraction of C(sp1)H moieties remains small (below 20%).
A first weak band assigned to C(sp1)–H stretch is located at 3.00 µm (3331 cm−1) for n = 6 and becomes slightly blueshifted up to 2.99 µm (3384 cm−1) for n = 24 when increasing nH/nC. A weak band is also observed at 3.17 µm (3155 cm−1) except for n = 6 and its intensity increases with nH/nC. This band was assigned to antisymmetric (as) C–H stretching modes of terminal C(sp2)H2 groups. Two broad bands are observed at higher wavelengths. A first one is observed in the [3.22–3.30 µm] range ([3029–3105 cm−1]) for all values of n, with the intensity of this band increasing with nH/nC. The maximum is located at 3.26 µm for n = 6, 12, 18, a blue shoulder appearing for n = 18, whereas two maxima appear at 3.24 (3086 cm−1) and 3.28 µm (3048 cm−1) for n = 24. This band includes (C2)C(sp2)-H stretches but also C(sp3)–H3 as stretches, the fraction of the latter remaining minor with respect to that of the former for all nH/nC ratios and for all families (see Figs. 3 and B.2). Finally, a broad and structured band is observed in the [3.37–3.56 µm] range ([2805–2965 cm−1]) with two maxima at ~3.39 µm (2947 cm−1) and ~3.45 µm (2896 cm−1). This band was assigned, by decreasing order of energy, to (C2)C(sp2)-H stretches, (C2)C(sp3)–H2 as and symmetric (s) stretches, C(sp3)–H3 s stretches, and (C3)C(sp3)–H stretches.
As can be seen in Fig. 2a, the positions of the bands fluctuate when nH/nC increases, but the most striking evolution concerns the relative intensities of the different energy domains, namely [2.99–3.00 µm], [3.16–3.30 µm], and [3.37–3.56 µm], which reflect the fractions of sp1, sp2, and sp3 carbon atoms, respectively. This is quantified by the intensity ratios reported in Fig. 4. For all families, the I2.99–3.00 μm/I2.99–3.56 µm ratio was shown to decrease following an exponential law as a function of nH/nC (see Fig. 4a). On the contrary, the I3.37–3.56 μm/I2.99–3.56 µm ratio was shown to increase with nH/nC following logarithmic (flakes and branched) or linear laws (pretzels). The evolution of I3.16–3.30 μm/I2.99–3.56 μm could not be fitted by a simple function. For the flakes and pretzels families, this ratio decreases as a function of nH/nC whereas its behavior is not as clear for the branched families: it increases up to nH/nC = 3/4 and is smaller when nH/nC = 1. The evolution of the I3.37–3.56 µm/I3.16–3.30 µm ratio was also reported in Fig. 4d. This ratio increases with nH/nC for the three families, the major evolution occurring for the branched family, and the minor evolution occurring for the pretzels family. In between, the data points for the flakes family could be fitted by an exponential function.
These trends can be interpreted based on the evolution of the ratio – with respect to the total number of hydrogenated carbons – of C(spx)Hn moieties (x = 1–3, n = 1–3) as a function of nH/nC (see Figs. 3 and B.2).The C(sp2)H fraction remains the largest one, but it decreases when nH/nC increases (84% down to 44% for the flakes family) while the C(sp2)H2 fraction increases but remains small (2–7% for the flakes family). This is in line with the trend observed for the evolution of the I3.16–3.30 μm/I2.99–3.56 µm ratio. Regarding the sp3 carbon atoms, the major fraction is that of C(sp3)H2, which increases when nH/nC increases (from 5% (nH = 6) to 25% (nH = 24). The C(sp3)H fraction also increases, although remaining smaller (from 3% to 13% for the flakes family), as does the C(sp3)H3 fraction, which remains a relatively minor fraction (0.1% to 5% for the flakes family).
These results are in line with the increase in the I3.37–356 μm/I2.99–3.56 µm ratio and also contribute to explaining the decreases in I2.99–3.00 μm/I2.99–3.56 µm and I3.16–3.30 µm/I2.99–3.56 µm when nH/nC increases. Although the trends are relatively similar for all families, we note some differences. The C(sp1)H fraction remains small for all stoichiometries (between 5% and 7% for the flakes families depending on the stoichiometry), indicating a small number of terminal C–H bonds. However, it is larger for the branched (15% down to 5%) and pretzels families (14% down to 8%) reflecting the larger I2.99–3.00 μm/I2.99–3.56 µm ratio (Fig. 4a). Interestingly, the C(sp3)H fraction is more important in the cages family than in the other families (from 9% to 29%) because of the spherical shape of the clusters. Globally, the increase in the fraction of sp3 carbon atoms to the detriment of sp2 carbon atoms when nH/nC increases is illustrated by the evolution of the I3.37–3056 μm/I3.16–3.30 μm ratio reported in Fig. 4d.
 |
Fig. 2 Infrared spectra for the flakes and branched families and comparison with astronomical spectra. Panels a and b show a zoom into the [2.8–4 µm] region. Panels c and d show the features represented with dashed lines in the [10.2–22.7 µm] region rescaled using the appropriate factors for C–H bend (see main text and Appendix A). The final shifted band in the [10.0–15.3 µm] domain is represented in plain lines. The emission spectra from the Orion bar H2S1(Van Diedenhoven et al. 2004) and from the SMP SMC 16 planetary nebula (García-Hernández et al. 2010) are added for comparison. Error bars are reported in panels a and c for the most intense bands of the IR spectrum of C24H6 flakes only, but can be applied to similar modes for all stoichiometries and families. |
 |
Fig. 3 Evolution of the C(spx)Hn (x = 1–3, n = 1–3) fraction as a function of nH/nC for the flakes (a) and branched (b) families. |
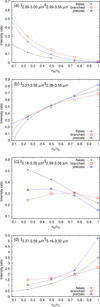 |
Fig. 4 Intensity ratios I2.99–3.00 µm/I2.99–3.56 µm (a), I3.37–3.56 µm/I2.99–3.56 µm (b), I3.16–3.30 µm/I2.99–3.56 µm (c), and I3.37–3.56 µm/I3.16–3.30 µm (d) as a function of the nH/nC fraction for the flakes family (black crosses), branched family (red squares), and pretzels family (blue triangles). The dashed lines either result from the analytical data fitting (when starting below x = 0.25; see Table B1 in Appendix B for the coefficients) or were drawn to guide the eye. |
3.1.2 C–C and C–H modes: The [4–30 µm] region
The IR features of the families of pure Cn carbon clusters (n = 24, 42, 6o) were described previously by Dubosq et al. (2019). Focusing on the flakes population of C24 (Fig. 2), an intense narrow band can be found in the [4.47–5.14 µm] region. This is due to the resonance of the C–C stretch of sp1 carbon atoms. The intensity of this band clearly decreases when nH/nC increases, reflecting the decrease in the fraction of sp1 carbon atoms. For all families except that of the cages, this band remains intense up to nH/nC = 0.5 and nearly disappears for nH/nC = 1, while its intensity decreases for nH/nC = 0.75. The maximum of this band is found at 4.80 µm for C24 (flakes family), at 4.77 µm for C24H6 and C24H18, and at 4.78 µm for C24H12 and C24H24. A wide IR band is observed in the [5.4–12.8 µm] wavelength range for C24 and its shape depends on the family. Globally, the [5.4–10.2 µm] wavelength range features are assigned to the C–C stretches of sp2 carbon atoms and also of sp3 carbon atoms at the longest wavelengths. When decreasing the energy up to ~12.8 µm, softer CCC in-plane bending modes are found. Above 15 µm, more collective deformation modes of the carbon skeleton occur.
As mentioned in Sect. 2, the difficulty in addressing the spectra of hydrogenated carbon clusters is caused by a difference of scaling between the C–H bending modes and some CC stretches and CCC bends that occur in the same energy domains; that is, above ~10 µm. In this region, C–H bending modes are expected to be dominant, especially when nH/nC increases, and therefore we used the scaling law for the C–H bends determined in the Appendix A for the [10.2–22.7 µm] wavelength range (CC scaling), the band in the latter domain being finally shifted to the [10.0–15.3 µm] domain (see Figs. 2 and B.1). In the remainder of this paper, the results are presented using this final wavelength domain.
When nH/nC increases, the relative intensity in the [5.4–10.2 µm] range decreases, whereas that in the [10.0–15.3 µm] region increases for all families. As can be seen in Fig. 5a, the I10.0–15.2 μm/I5.4–10.3 μm ratio globally increases with nH/nC, reaching similar values (between 0.4 and 0.45) for the flakes, branched, and pretzels families when nH/nC = 1. The features in the [5.4–10.2 µm] wavelength range are due to pure C–C stretches at the smaller wavelength but when the wavelength increases, the resonant vibrational modes include combinations of C–C stretches and C–H bends. The resonance of C–H bends appears above 10.0 µm. Regarding the flakes family, the maximum of the band in the [10.0 – 15.2 µm] region is found at 12.4, 12.3, 12.1, and 11.8 µm from nH = 6 to 24. This band appears globally slightly blueshifted, with a blue tail starting at 11.2µm for nH = 6 and at 10.8 µm for the higher hydrogen ratios; its shape is also modified when nH/nC increases: its lower-energy part becomes more intense to the detriment of the higher-energy part, which contains a higher fraction of features due to CC modes. Because of the difference in scaling between C–H and CC modes in this region, the profile of the band has to be considered with caution. However, it is clear that the presence of C–H bonds leads to new features in the [11.0–13 µm] domain with respect to pure carbon clusters. As in the case of pure carbon clusters, less intense and delocalized soft modes occur at higher energies. Interestingly, we notice a slight bump at 14.8 µm for nH/nC = 0.5 and 0.75. From our analysis, this appears to be due to the C–H bend of terminal C(sp1)–H bonds. As could have been expected, this bump is more intense in the case of the branched family for all stoichiometries (see Fig. 2d). In the case of the branched families, hydrogenation also clearly leads to new features in the [10.0–15 µm], range with more intensity in the lower energy domain (maximum at 12.4, 12.1, 11.9 and 11.8 µm for nH from 6 to 24, respectively). The red tail of the band finishes by a small bump at 14.8 µm. Contrary to the flakes family, a small bump is observed at 9.5, 9.3, and 9.3 µm for nH from 12 to 24. The evolution of the spectra for the pretzels families is similar to that of the branched families (see Fig. B.1c) although the features due to the C–H bending modes start at a higher wavelength (above 11.0 µm and the broad band in the [11.0–15 µm] region has a maximum at ~12.5, 12.3, 12.1 and 12.1 µm for nH from 6 to 24). The features for the cages families are reported in Fig. B.1d. However, due to the lack of isomers, these cannot be considered to interpret the astronomical plateaus.
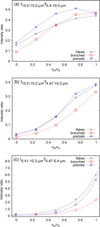 |
Fig. 5 Intensity ratios I10.0–15.2 μm/I5.4–103 μm (a), I10.0–15.2 μm/I4.47–10.3 μm (b), and I5.41–10.3 μm/I4.47–5.4 μm (c) as a function of the nH/nC fraction for the flakes family (black crosses), branched family (red squares), and pretzels family (blue triangles). The dashed lines in plots (a) and (b) were drawn to guide the eye, whereas in plot (c), these lines show the exponential fitting of the data (see Appendix B for the details of the fit). |
3.2 UV-visible spectra
The computed UV-visible spectra for C24Hn (n = 0, 6, 12, 18, 24) are reported in Fig. 6 for the flakes and branched populations, and in Fig. C.1 for the pretzels and cages populations. Regarding the flakes population, all spectra are characterized by a wide plateau starting at ~ 1 eV for C24 and at higher energy, up to ~2 eV, for C24H24 when nH/nC increases. The occurrence of such low-energy transitions is expected for unsaturated carbon clusters such as C24. Cn (n = 24, 42, 60) clusters were indeed shown to have their lowest energy transitions below 1 eV and a high density of low-energy electronic states, all the more as the cluster size increases (Lacinbala et al. 2022). These transitions correspond to the promotion of the higher energy π (delocalized) electrons to the lower energy π✶ orbitals. When nH/nC increases, the fraction of electrons in covalent σ bonds increases to the detriment of π bonds, leading to relatively less intense features in the lower-energy part of the spectrum.
The shape of the plateau depends on the hydrogenation degree. In the case of C24, it presents two bumps centered at ~4.75 eV and ~8.40 eV. Although our method of calculation does not allow us to trust the spectrum above 10 eV, it appears that transitions are still expected at higher energies and that the spectrum resembles a continuum. Interestingly, good agreement is found between this spectrum and that of the C24 population obtained from a set of structures determined using a replica exchange molecular dynamic (REMD) algorithm (Dubosq et al. 2020).
In the case of C24H6, this structured plateau is replaced by one single wide band starting at ~1.7 eV with a maximum at ~6.8 eV. As in the case of C24 but to a lesser extent, transitions are expected at energies higher than 10 eV and the blue tail of the bump slopes gently downwards. For C24H12, the bump starts at the same energy as for C24H6 with a redshift of the maximum down to ~6 eV. This could be expected, as the maximum in the average spectrum of 40 PAHs (below 10 eV) is found at ~6 eV (Malloci et al. 2007b). Its shape is more symmetric than in the case of C24H6, with a steeper blue tail. Regarding the overhydrogenated molecules C24H18 and C24H24, their UV-visible spectra are very similar and present a bump shifted towards higher energies with a maximum of ~7.4 eV for both clusters.
The electronic transitions below 9 eV involve π→π✶ transitions, mixed with σ→π✶ transitions when the energy increases (see some examples in Fig. C.2). The blueshift of the maximum for C24H18 and C24H24 with respect to C24H12 is consistent with the more important fraction of sp3 C atoms leading to σ→π✶ transitions. Transitions to σ✶ orbitals are found at higher energies (above 9 eV). Interestingly, for the flakes population, when integrating the spectra between 2 and 9 eV, a clear decrease in the oscillator strength can be seen in this region when increasing nH/nC (see Fig. 7, black crosses).
Regarding the branched families, all spectra are also characterized by a wide plateau that, as in the case of the flakes family, appears at ~1 eV for C24 and at higher energies up to ~2 eV for C24H24 when nH/nC increases. The difference in the shapes of the plateaus with nH/nC is less obvious than in the case of the flakes. As in the case of the flakes family, the 2–9 eV oscillator strength decreases when nH/nC increases. The oscillator strength in the higher-energy part of the spectrum (6–9 eV) increases, whereas that in the 2–6 eV domain decreases when nH/nC increases, with a maximum at approximately 8.2 eV up to nH/nC = 0.5, and 7.8 and 7.5 eV for nH/nC = 0.75 and 1, respectively.
Regarding the pretzels family, the trends are similar (see Figs. C.1a and 7). The maximum of the plateau is at approximately 8.3 eV for C24, 7.6 eV for C24H6 and C24H12, and at a lower energy for C24H18 and C24H24. The evolution of the UV-visible spectra of the cages (see Fig. C.1b) is not discussed as they cannot be considered as a population due to the small number of isomers.
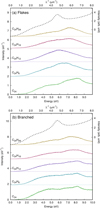 |
Fig. 6 TD-DFTB optical spectra of C24Hn (n = 0, 6, 12, 18, 24) for the flakes (a) and branched (b) families. The average Galactic extinction curve adapted from Fitzpatrick & Massa (2007) is reported in dashed lines. |
 |
Fig. 7 Oscillator strength ratio in the [2–9 eV] region between C24Hn (n = 6, 12, 18, 24) and C24 for the flakes (black crosses), branched (red squares), and pretzels (blue triangles) families. The data points were fitted by a linear law (see Appendix B). |
4 Astrophysical implications
The astronomical IR spectra reported in the present work are emission spectra and the computed spectra are absorption spectra. Simulating a full radiative emission cascade approach for comparison is out of the scope of this article. To first order, for the relatively large systems studied here, the emitted spectral positions should in any case remain within the error bars of the scaling of our absorption spectra.
Regarding the C-H stretching region, the error bars on the scaling factors may amount to 0.1 μm due to the high concentration of data on a small wavelength range. However, the relative intensities in the three different wavelength regions assigned to spn (n = 1–3) carbon atoms could be a good indicator of the structural characteristics and of the nH/nC ratio of the IR band carriers in the C–H region in the ISM (see Fig. 4). For instance, comparing the spectra computed in this work with the astronomical spectrum of the Orion bar (a so-called class A in the AIBs astronomical spectral classification; i.e., the more aromatic AIBs class), it appears that isomers with the characteristics of the flakes family (large number of five- and six-carbon cycles and mostly planar) with a nH/nC ratio smaller than 0.5 with no sp1 carbon atom, are the most interesting candidates.
In the view of interpreting future astronomical observations, the I3.37–3.56 μm/I3.16–3.30 μm intensity ratio reported in Fig. 4d could be used to bring constraints on the nH/nC fraction in regions where hydrogenated carbons are expected. From the dependence of the C(spx)Hn (x = 1–3, n = 1–3) fraction on nH/nC reported in Fig. 3, we derived the C(sp3)H3/C(sp3)H2 fraction as a function of nH/nC for the flakes, branched, and pretzels families (see Fig. 8a). As can be seen in Fig. 8a, this fraction remains small for all families (lower than 0.3) but increases with nH/nC. Interestingly, the shape of the [3.3–3.6 μm] band for the flakes and a nH/nC ratio of 0.5 is very similar to the astronomical features recorded for the protoplanetary nebula CRL 618 (Chiar et al. 1998). Chiar et al. (1998) deduced from their analysis that the 3.4 μm band was due to the presence of relatively short chains of aliphatic hydrocarbons, with a CH3/CH2 fraction estimated at between 0.4 and 0.5, which is larger than our estimation for low nH/nC fractions. In the diffuse ISM, the C(sp3)H3/C(sp3)H2 fraction was estimated to be in the range of 2–2.5 (Matrajt et al. 2005; Sandford et al. 1991; Pendleton et al. 1994), and therefore the populations considered in this work are not good candidates for the HAC in these regions. On the contrary, the C(sp3)Hı/C(sp3)H2 ratio is larger and remains above 0.4 (see Fig. 8b). For the lower values of nH/nC, the smallest C(sp3)Hı/C(sp3)H2 ratio is obtained for the flakes populations.
Regarding the IR features above 4 μm, the sharp band at ~4.77 μm due to C≡C stretch is not observed in astronomical spectra. For instance, similarly to the 3.00 μm C(sp1 -H) stretching band, the 4.77 μm band is not observed in the astronomical emission spectrum of Orion bar H2S1. Therefore, among all the isomers considered here, those possessing C≡C bonds are not observed in astronomical emission spectra. If they are formed in the ISM, then their lifetime is expected to be insufficient to be detected. The reason that can be invoked is that C≡C bonds are expected to be more reactive than C=C bonds. Consequently, the isomers possessing sp1 carbon atoms are expected to isomerize under the action of either photons or collisions, leading to most stable isomers possessing a majority of sp2 atoms. The isomers containing sp1 carbon atoms could also be reactive intermediates in the growth of larger carbon clusters considering a bottom-up process. A shortcoming of the present work is that all isomers were taken into account without any energetic consideration, and we show that the higher the fraction of sp1 atoms, the less stable the isomers are (see Fig. 10 in the article by Pla et al. 2021). The intensity ratios reported in Fig. 5 could be used to estimate the nH/nC ratio in regions of the ISM where the presence of hydrogenated carbon clusters can be expected. It is clear that I10.0–15.2 µm/I5.4–10.3 µm (Fig. 5a) and I10.0–15.2 µm/I4.47–10.3 µm (Fig. 5b) increase with nH/nC for all families, leading to similar values of nH/nC = 1 – namely 0.40–0.45 for the former and 0.3–0.4 for the latter – for all families. However, these evolutions could not be fitted by a simple law. The I5.41–10.3 µm/I4.47–5.41 µm ratio increase as a function of nH/nC could be fitted by an exponential law (see the coefficients in Appendix B) and could also be used to constrain the hydrogen rate and to a lesser extent the structural features of astrophysical candidates. Interestingly, the I5.41–10.3 µm/I4.47–5.41 µm ratio increase for the pretzels families is less pronounced than the same increase for the branched and flakes families, which appear similar.
As the computed spectra are absorption spectra, and the profile of the band in the [10.0–15 µm] range remains uncertain due to the difference of scaling factors for C–C and C–H modes, only trends can be compared to astronomical data. However, we compared the computed IR features to the astronomical emission spectrum recorded in a C-rich and H-rich planetary nebula of the Small Magellanic Cloud (SMC), where both fullerenes and PAHs have been detected (García-Hernández et al. 2010). Interestingly, it appears that the plateaus observed in the [6–10] and [10–15 µm] ranges could be accounted for by the resonance of the C-C stretches and C-H bends, respectively. The best agreement in terms of the shape of the bands and their intensity ratio qualitatively corresponds to the flakes family populations, which possess a nH/nC rate below 0.5. This conclusion is similar to the one drawn after the analysis of the C–H stretching features in the Orion bar H2S1. However, we are aware that the relative intensities of these regions should be in favor of the lower energy range in astronomical emission spectra.
This study, based on the analysis of the relative intensities of the IR features in different domains, brings some constraints on the chemical nature of hydrogenated carbon clusters (structural organization and hybridization of carbon atoms) and on the nH/nC ratio of these clusters in the regions of the ISM where they are detected. Our results are clearly in favor of the flakes population cleared from sp1 atoms with low nH/nC ratio. It is interesting to compare these trends with the experimental results obtained by Dartois et al. (2020). In this study, interstellar-relevant dust particles were produced by high-energy mechanochemical synthesis from carbon-based solids (graphene flakes, fullerenes, nanotubes) under hydrogen atmosphere. From the experimental measurement of the nH/nC ratio and from the comparison of the IR-measured intensities of the produced grains and the AIB features of the so-called class C-D spectral family, which contains aromatic and aliphatic moieties, these latter authors concluded that the nH/nC ratio within polyaromatic-emitting structures should be very low, between 3% and 7%, which is one order of magnitude lower than the estimations provided in the present work. However, the size of the produced species in these experiments is much larger than that of the carbonaceous systems studied in this work. Regarding pure carbon clusters, quantum chemical calculations show that when size increases, the cages population becomes energetically more favorable than the flakes population (Dubosq et al. 2019). However, interestingly, a recent theoretical study by Perez-Mellor et al. (2022) shows that both entropy and addition of a moderate amount of hydrogen favors planar structures analogous to the flakes populations studied in this work. Typically, regarding the hydrogenated isomers of C60, the flakes population was determined as the most favorable for C60Hn with 12 ≤ n ≤ 60 stoichiometries for T between 0 and 3500 K. Therefore, we may reasonably assume that the IR features for larger clusters such as C60Hn with 12 ≤ n ≤ 60 are similar to the ones obtained for C24H6. However, for a hydrogen fraction lower than 0.20, the most stable population for C60Hn is roughly that of the cage, which is also the most stable but encompasses fewer isomers for carbon clusters with less than 30 atoms. It is therefore hazardous to extrapolate our results to clusters of a larger size with a larger number of carbon atoms and a lower nH/nC ratio than the one considered in the present study.
When comparing the computed UV-visible spectra of the flakes families (this work) to the average interstellar medium extinction curve (Fitzpatrick & Massa 2007), it appears that the C24H12 family is the one contributing the most to the UV bump, and C24H6 is that contributing the least, its maximum being blueshifted with respect to the astronomical data. Furthermore, larger pure carbon clusters pertaining to the cages – and to a lesser extent the flakes – family were shown to be good candidates (Dubosq et al. 2020). When increasing the hydrogenation degree, only a contribution to the high-energy part of the absorption continuum can be considered. As for the spectrum of C24, it could also contribute to the continuum considering carbon-rich regions, but not to the UV bump, and this is also the case for the branched and pretzels populations.
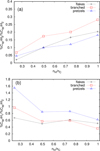 |
Fig. 8 Evolution of the C(sp3)H3/C(sp3)H2 (a) and C(sp3)H1/C(sp3)H2 (b) fraction as a function of nH/nC for the flakes, branched, and pretzels families. |
5 Conclusions
In this work, we report the IR and optical absorption spectra of populations of C24Hn (n = 0, 6, 12, 18, 24) clusters containing up to several tens of thousands of isomers. These were obtained by summing individual DFTB (IR) and TD-DFTB (optical) spectra of individual isomers. We also present correlations between spectral features and the nH/nC ratio for different structural families.
Regarding the IR features, the computed bands in the [2.99–3.00 µm], [3.16–3.30 µm], and [3.37–3.56 µm] domains are assigned to C(spx)–H stretches with x = 1, 2, and 3, respectively. The intensity ratios within these three domains could be an indicator of the nH/nC fractions in the regions of the ISM where the presence of carbon species is expected. The comparison of the computed spectra with the Orion bar H2S1 spectrum suggests that the flakes population, which is deprived of sp1 atoms with an nH/nC lower than 0.5, could be at the origin of these IR features. However, error bars due to the limited wavelength range where scaling factors were determined are expected on the absolute positions of the C–H stretching modes. Hydrogenation of carbon clusters also leads to a plateau in the [10–15 µm] region – which is more intense as nH/nC increases –, where no feature is observed for pure carbon clusters. We clearly show that the ratio between the intensities in the [10.0–15.2 µm] domain with respect to the [5.41–10.3 µm] increases with nH/nC. This could also be used to analyse future astronomical IR data to provide a constraint on the nH/nC fraction. The comparison between the computed IR features in the [10–15 µm] and [6–9 µm] regions and the observational data of a C-rich and H-rich planetary nebula indicates that hydrogenated flakes with a low nH/nC ratio (lower than 0.5) are good candidates to be the carriers of these plateaus.
However, an intense narrow band resonating at ~4.8µm and due to C≡C stretch is observed in all calculated spectra, with its relative intensity decreasing when nH/nC increases. To our knowledge, such a feature has not been observed in the astronomical IR spectra of the ISM in C-rich and H-rich regions. However, in emission spectra, the intensity of this band is expected to be considerably decreased. As discussed in this article, sp1 carbon atoms are expected to be more reactive than sp2 carbon atoms and are expected not to be stable over time. A question that will be addressed in the future is the evolution of the spectra of populations with a low nH/nC ratio when only the most stable isomers – which also possess the fewest sp1 carbon atoms – are taken into account in order to improve the agreement with astronomical features. In the present work, neither energetic constraints nor reaction processes were taken into account. The results reported here could be of interest for the interpretation of new JWST data, in particular in the framework of the PDRs4All program.
Regarding the optical features, a wide band in the case of the flakes and pretzels families, and a sort of continuum in the case of the branched family, are observed in the [1–9 eV] range. These were assigned to π, σ → π✶ transitions. The total intensity decreases when nH/nC increases. Comparison with the astronomical spectrum suggests that the most stable C24H12 flakes family (and to a lesser extent the C24H6 flakes family) could contribute to the UV bump. When nH/nC increases, more higher-energy features are observed with an increasing contribution of σ → π✶ transitions and these could contribute to the high-energy part of the continuum of the extinction curve.
Acknowledgements
The authors gratefully acknowledge financial support by the Agence Nationale de la Recherche (ANR) Grant Nos. ANR-16-CE29-0025 and the Spanish MICINN (PID2019-110091GB-I00). They also thank the computing mesocenter CALMIP (“CALcul en MIdi Pyrénées”, UMS CNRS 3667) for generous allocation of computer resources (p0059 project).
Appendix A IR spectra benchmark
Benchmarking was performed against well-known DFT harmonic spectra presented in the literature. This was done for a set of 15 isomers of C24H1, 13 isomers of C24H2, and 15 isomers of C24H12. All of these geometries were relaxed at the B3LYP/pc-1 level with the Gaussian 09 software suite. Corresponding IR spectra are computed at the corresponding level of theory. To this set of structures, we added the results of a previous benchmark performed over a set of 50 C24 isomers (Dubosq et al. 2019). The benchmarking was performed as follows. For a given isomer, for each nondegenerate C-H vibrational mode and most remarkable C-C vibrational modes at the B3LYP/pc-1 level, we identify the same modes at the SCC-DFTB level. Doing this, we can correlate the vibrational energy computed at B3LYP/pc-1 level with the corresponding SCC-DFTB value (see Fig. A.1).
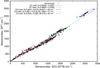 |
Fig. A.1 Correlation graph between SCC-DFTB and B3LYP/pc-1 wavenumbers. The black dotted line corresponds to a perfect correspondence between SCC-DFTB and B3LYP/pc-1 vibrational energy. |
For soft and collective C-C vibrational modes ( cm−1), we determined a scaling factor of 0.9046 ± 0.0021, while for harder C-C stretching modes (
 cm−1), the scaling factor was found to be 0.9983 ± 0.0020. A distinction between soft and hard C-C vibrational modes occurs around 1750 cm−1 with an overlap of ~ 100 cm−1 around this value. To allow a smooth transition between these two trends, we proposed the following equation to express the scaling factor depending of the vibrational energy:

where constant A and B are determined by asymptotic limit. The α value is defined to have a 75% scaling factor of the soft C-C vibrational mode at 1700 cm−1 and a 75% scaling factor of the hard C-C vibrational mode at 1800 cm−1. Values of these three parameters are given below:

Concerning the C-H vibrational modes, three energy regions corresponding to three different types of vibrational modes were distinguished and fitted with affine functions a × x + b. The first range of C-H vibrational modes (500-850 cm−1) corresponds to out-of-plane C-H vibration (affine law: 0.594 ± 0.063 × x + 376 ± 45 cm−1). The second range of C-H vibrational modes [2440 - 2990 cm−1] is associated to C-H stretching modes of -CH2 type. For such modes, the 0.581 ± 0.016 × x + 1346 ± 47 cm−1 affine law was determined. These modes were mostlyobserved in our set for the C24H12. The last vibration modes correspond to C-H stretching modes for C-H sp2 and sp1 atoms ( cm−1) and the 0.843 ± 0.016 × x + 627 ± 48 cm−1 was obtained. Due to the difficulty in distinguishing C-H out-of-plane vibrational modes from C-C soft modes of vibration from a pure energetic point of view, we do not take into account the affine law determined for the C-H out-of-plane vibrational mode at first to plot the spectra, but the law is applied to the [450-1000 cm−1] region afterwards, without proposing a smooth transition between the two regions, as this seemed beyond our capabilities within the scope of this work, where a tremendous number of isomers and modes are involved.
However, due to the clear distinction we have for the highest-energy C-C and C-H vibrational modes, we were able to propose a smooth transition of the scaling between the two types of C-H stretching modes, and we propose the following form:

with

We define the parameter as for the smooth transition of the two different C-C modes of vibration and we find that

Appendix B IR features
Appendix B.1 Infrared spectra for pretzels and cages families
Appendix B.2 Coefficients of the fits for the intensity ratios of Fig. 4, Fig. 5, and Fig. 7
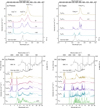 |
Fig. B.1 Infrared spectra for the pretzels and cages families. (a), (b) Zoom into the [2.8 - 4 µm] region. The intensities were multiplied by 4 for C24H6 and by 2 for C24H12 to make the structures of the bands visible. (c), (d) The features represented with dashed lines in the [10.2 - 22.7 µm] region were rescaled using the appropriate factors for C-H bend (see main text and Appendix A). The final shifted band in the [10.0 - 15.3 µm] domain is represented in plain lines. The emission spectra from the Orion bar H2S1(Van Diedenhoven et al. 2004) and from the SMP SMC 16 planetary nebula (García-Hernández et al. 2010) are added for comparison. |
Coefficients of the analytical fitting equations for the intensity ratios as a function of nH/nC for
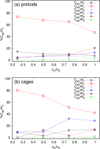 |
Fig. B.2 Evolution of the C(spx)Hn (x=1-3, n=1-3) ratio as a function of nH/nC for the pretzels (a) and cages (b) families. |
Appendix C Ultraviolet-visible spectra for pretzels and cages families
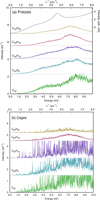 |
Fig. C.1 TD-DFTB optical spectra of C24Hn (n=0, 6,12,18,24) for the pretzels (a) and cages (b) families. The average Galactic extinction curve adapted from Fitzpatrick & Massa (2007) is reported in dashed lines. |
 |
Fig. C.2 Representation of some relevant transitions for some isomers of the flakes families of C24Hn (n=6,12,18,24). |
References
- Allamandola, L. J., Tielens, A. G. G. M., & Barker, J. R. 1985, ApJ, 290, L25 [Google Scholar]
- Banhatti, S., Palotás, J., Jusko, P., et al. 2021, A&Amp;A, 648, A61 [NASA ADS] [CrossRef] [EDP Sciences] [Google Scholar]
- Bauschlicher, Charles W.J., Peeters, E., & Allamandola, L.J. 2009, ApJ, 697, 311 [NASA ADS] [CrossRef] [Google Scholar]
- Bauschlicher, C. W., Ricca, A., Boersma, C., & Allamandola, L. J. 2018, ApJS, 234, 32 [NASA ADS] [CrossRef] [Google Scholar]
- Bernard-Salas, J., Cami, J., Peeters, E., et al. 2012, ApJ, 757, 41 [NASA ADS] [CrossRef] [Google Scholar]
- Bernstein, M. P., Sandford, S. A., & Allamandola, L. J. 1996, ApJ, 472, L127 [NASA ADS] [CrossRef] [Google Scholar]
- Buss, R. H.J., Tielens, A.G.G.M., Cohen, M., et al. 1993, ApJ, 415, 250 [NASA ADS] [CrossRef] [Google Scholar]
- Cami, J., Bernard-Salas, J., Peeters, E., & Malek, S. E. 2010, Science, 329, 1180 [NASA ADS] [CrossRef] [Google Scholar]
- Cernicharo, J., Agúndez, M., Cabezas, C., et al. 2021, A&Amp;A, 649, L15 [NASA ADS] [CrossRef] [EDP Sciences] [Google Scholar]
- Chiar, J. E., Pendleton, Y. J., Geballe, T. R., & Tielens, A. G. G. M. 1998, ApJ, 507, 281 [NASA ADS] [CrossRef] [Google Scholar]
- Dartois, E. 2019, J. Carb. Res., 5 [Google Scholar]
- Dartois, E., Chabot, M., Pino, T., et al. 2017, A&Amp;A, 599, A130 [NASA ADS] [CrossRef] [EDP Sciences] [Google Scholar]
- Dartois, E., Charon, E., Engrand, C., Pino, T., & Sandt, C. 2020, A&Amp;A, 637, A82 [NASA ADS] [CrossRef] [EDP Sciences] [Google Scholar]
- Dubosq, C., Falvo, C., Calvo, F., et al. 2019, A&Amp;A, 625, A11 [Google Scholar]
- Dubosq, C., Calvo, F., Rapacioli, M., et al. 2020, A&Amp;A, 634, A62 [NASA ADS] [CrossRef] [EDP Sciences] [Google Scholar]
- Duley, W. W., Grishko, V. I., Kenel, J., Lee-Dadswell, G., & Scott, A. 2005, ApJ, 626, 933 [NASA ADS] [CrossRef] [Google Scholar]
- Elstner, M., Porezag, D., Jungnickel, G., et al. 1998, Phys. Rev. B, 58, 7260 [CrossRef] [Google Scholar]
- Fitzpatrick, E. L., & Massa, D. 1986, ApJ, 307, 286 [NASA ADS] [CrossRef] [Google Scholar]
- Fitzpatrick, E. L., & Massa, D. 2007, ApJ, 663, 320 [Google Scholar]
- Fitzpatrick, E. L., Massa, D., Gordon, K. D., Bohlin, R., & Clayton, G. C. 2019, ApJ, 886, 108 [Google Scholar]
- Gadallah, K., Mutschke, H., & Jäger, C. 2011, A&Amp;A, 528, A56 [NASA ADS] [CrossRef] [EDP Sciences] [Google Scholar]
- García-Hernández, D. A., Manchado, A., García-Lario, P., et al. 2010, ApJ, 724, L39 [CrossRef] [Google Scholar]
- García-Hernández, D. A., Iglesias-Groth, S., Acosta-Pulido, J. A., et al. 2011a, ApJ, 737, L30 [CrossRef] [Google Scholar]
- García-Hernández, D. A., Kameswara Rao, N., & Lambert, D. L. 2011b, ApJ, 729, 126 [CrossRef] [Google Scholar]
- García-Hernández, D. A., Villaver, E., García-Lario, P., et al. 2012, ApJ, 760, 107 [CrossRef] [Google Scholar]
- Gavilan, L., Le, K. C., Pino, T., et al. 2017, A&Amp;A, 607, A73 [NASA ADS] [CrossRef] [EDP Sciences] [Google Scholar]
- Godard, M., Féraud, G., Chabot, M., et al. 2011, A&Amp;A, 529, A146 [NASA ADS] [CrossRef] [EDP Sciences] [Google Scholar]
- Godard, M., Geballe, T. R., Dartois, E., & Muñoz Caro, G. M. 2012, A&Amp;A, 537, A27 [NASA ADS] [CrossRef] [EDP Sciences] [Google Scholar]
- Hansen, C. S., Peeters, E., Cami, J., & Schmidt, T. W. 2022, Commun. Chem., 5, 94 [CrossRef] [Google Scholar]
- Hudgins, D. M., Charles W. Bauschlicher, J., & Allamandola, L.J. 2005, ApJ, 632, 316 [NASA ADS] [CrossRef] [Google Scholar]
- Jones, A., Duley, W., & Williams, D. 1990, Quart. J. Roy. Astron. Soc., 31, 567 [NASA ADS] [Google Scholar]
- Lacinbala, O., Calvo, F., Dubosq, C., et al. 2022, J. Chem. Phys., 156, 144305 [NASA ADS] [CrossRef] [Google Scholar]
- Larsen, A. H., Jørgen Mortensen, J., Blomqvist, J., et al. 2017, J. Phys. Cond. Mater., 29, 273002 [NASA ADS] [CrossRef] [Google Scholar]
- Léger, A., & Puget, J. L. 1984, A&Amp;A, 137, L5 [Google Scholar]
- Li, A., & Draine, B. T. 2012, ApJ, 760, L35 [NASA ADS] [CrossRef] [Google Scholar]
- Mackie, C. J., Peeters, E.C.W.B.Jr., & Cami, J. 2015, ApJ, 799, 131 [NASA ADS] [CrossRef] [Google Scholar]
- Malloci, G., Joblin, C., & Mulas, G. 2007a, Chem. Phys., 332, 353 [Google Scholar]
- Malloci, G., Joblin, C., & Mulas, G. 2007b, A&Amp;A, 462, 627 [NASA ADS] [CrossRef] [EDP Sciences] [Google Scholar]
- Matrajt, G., Muñoz Caro, G. M., Dartois, E., et al. 2005, A&Amp;A, 433, 979 [NASA ADS] [CrossRef] [EDP Sciences] [Google Scholar]
- McGuire, B. A., Loomis, R. A., Burkhardt, A. M., et al. 2021, Science, 371, 1265 [Google Scholar]
- Niehaus, T. A., Suhai, S., Della Sala, F., et al. 2001, Phys. Rev. B, 63, 085108 [NASA ADS] [CrossRef] [Google Scholar]
- Oliveira, R. R., Molpeceres, G., Fantuzzi, F., et al. 2020, MNRAS, 500, 2564 [NASA ADS] [CrossRef] [Google Scholar]
- Pendleton, Y. J., Sandford, S. A., Allamandola, L. J., Tielens, A. G. G. M., & Sellgren, K. 1994, ApJ, 437, 683 [NASA ADS] [CrossRef] [Google Scholar]
- Perez-Mellor, A. F., Parneix, P., Calvo, F., & Falvo, C. 2022, J. Chem. Phys., 157, 171102 [NASA ADS] [CrossRef] [Google Scholar]
- Pilleri, P., Joblin, C., Boulanger, F., & Onaka, T. 2015, A&Amp;A, 577, A16 [NASA ADS] [CrossRef] [EDP Sciences] [Google Scholar]
- Pla, P., Wang, Y., Martín, F., & Alcamí, M. 2020, ApJ, 899, 18 [NASA ADS] [CrossRef] [Google Scholar]
- Pla, P., Dubosq, C., Rapacioli, M., et al. 2021, J. Phys. Chem. A, 125, 5273 [NASA ADS] [CrossRef] [Google Scholar]
- Porezag, D., Frauenheim, T., Köhler, T., Seifert, G., & Kaschner, R. 1995, Phys. Rev. B, 51, 12947 [NASA ADS] [CrossRef] [Google Scholar]
- Rapacioli, M., Spiegelman, F., Talbi, D., et al. 2009, J. Chem. Phys., 130, 244304 [NASA ADS] [CrossRef] [Google Scholar]
- Ricca, A., Bauschlicher, C. W., Boersma, C., Tielens, A. G. G. M., & Allamandola, L. J. 2012, ApJ, 754, 75 [NASA ADS] [CrossRef] [Google Scholar]
- Rotundi, A., Rietmeijer, F., Colangeli, L., et al. 1998, A&Amp;A, 329, 1087 [NASA ADS] [Google Scholar]
- Sandford, S. A. 1991, ApJ, 376, 599 [NASA ADS] [CrossRef] [Google Scholar]
- Sandford, S. A., Allamandola, L. J., Tielens, A. G. G. M., et al. 1991, ApJ, 371, 607 [NASA ADS] [CrossRef] [Google Scholar]
- Seifert, G., Porezag, D., & Frauenheim, T. 1996, Int. J. Quant. Chem., 58, 185 [CrossRef] [Google Scholar]
- Sellgren, K., Werner, M. W., Ingalls, J. G., et al. 2010, ApJ, 722, L54 [NASA ADS] [CrossRef] [Google Scholar]
- Shannon, M. J., Peeters, E., Cami, J., & Blommaert, J. A. D. L. 2018, ApJ, 855, 32 [NASA ADS] [CrossRef] [Google Scholar]
- Simon, A., & Joblin, C. 2010, ApJ, 712, 69 [CrossRef] [Google Scholar]
- Stecher, T. P. 1965, ApJ, 142, 1683 [NASA ADS] [CrossRef] [Google Scholar]
- Steglich, M., Jäger, C., Huisken, F., et al. 2013, ApJS, 208, 26 [NASA ADS] [CrossRef] [Google Scholar]
- Thrower, J. D., Jørgensen, B., Friis, E. E., et al. 2012, ApJ, 752, 3 [NASA ADS] [CrossRef] [Google Scholar]
- Tielens, A. 2008, Annu. Rev. Astron. Astrophys., 46, 289 [CrossRef] [Google Scholar]
- Van Diedenhoven, B., Peeters, E., Van Kerckhoven, C., et al. 2004, ApJ, 611, 928 [NASA ADS] [CrossRef] [Google Scholar]
- Wagner, D. R., Kim, H., & Saykally, R. J. 2000, ApJ, 545, 854 [CrossRef] [Google Scholar]
All Tables
Total number of structures per family and in total for each C24Hn system taken into account to compute the IR (roman) and optical spectra (italics).
Coefficients of the analytical fitting equations for the intensity ratios as a function of nH/nC for
All Figures
|
Fig. 1 Adapted from Pla et al. (2021). Two-dimensional distribution of the isomer population for C24H12 as a function of R5/6 and ß (top) and examples of isomers of C24Hn for the four families (bottom). |
| In the text | |
|
Fig. 2 Infrared spectra for the flakes and branched families and comparison with astronomical spectra. Panels a and b show a zoom into the [2.8–4 µm] region. Panels c and d show the features represented with dashed lines in the [10.2–22.7 µm] region rescaled using the appropriate factors for C–H bend (see main text and Appendix A). The final shifted band in the [10.0–15.3 µm] domain is represented in plain lines. The emission spectra from the Orion bar H2S1(Van Diedenhoven et al. 2004) and from the SMP SMC 16 planetary nebula (García-Hernández et al. 2010) are added for comparison. Error bars are reported in panels a and c for the most intense bands of the IR spectrum of C24H6 flakes only, but can be applied to similar modes for all stoichiometries and families. |
| In the text | |
|
Fig. 3 Evolution of the C(spx)Hn (x = 1–3, n = 1–3) fraction as a function of nH/nC for the flakes (a) and branched (b) families. |
| In the text | |
|
Fig. 4 Intensity ratios I2.99–3.00 µm/I2.99–3.56 µm (a), I3.37–3.56 µm/I2.99–3.56 µm (b), I3.16–3.30 µm/I2.99–3.56 µm (c), and I3.37–3.56 µm/I3.16–3.30 µm (d) as a function of the nH/nC fraction for the flakes family (black crosses), branched family (red squares), and pretzels family (blue triangles). The dashed lines either result from the analytical data fitting (when starting below x = 0.25; see Table B1 in Appendix B for the coefficients) or were drawn to guide the eye. |
| In the text | |
|
Fig. 5 Intensity ratios I10.0–15.2 μm/I5.4–103 μm (a), I10.0–15.2 μm/I4.47–10.3 μm (b), and I5.41–10.3 μm/I4.47–5.4 μm (c) as a function of the nH/nC fraction for the flakes family (black crosses), branched family (red squares), and pretzels family (blue triangles). The dashed lines in plots (a) and (b) were drawn to guide the eye, whereas in plot (c), these lines show the exponential fitting of the data (see Appendix B for the details of the fit). |
| In the text | |
|
Fig. 6 TD-DFTB optical spectra of C24Hn (n = 0, 6, 12, 18, 24) for the flakes (a) and branched (b) families. The average Galactic extinction curve adapted from Fitzpatrick & Massa (2007) is reported in dashed lines. |
| In the text | |
|
Fig. 7 Oscillator strength ratio in the [2–9 eV] region between C24Hn (n = 6, 12, 18, 24) and C24 for the flakes (black crosses), branched (red squares), and pretzels (blue triangles) families. The data points were fitted by a linear law (see Appendix B). |
| In the text | |
|
Fig. 8 Evolution of the C(sp3)H3/C(sp3)H2 (a) and C(sp3)H1/C(sp3)H2 (b) fraction as a function of nH/nC for the flakes, branched, and pretzels families. |
| In the text | |
|
Fig. A.1 Correlation graph between SCC-DFTB and B3LYP/pc-1 wavenumbers. The black dotted line corresponds to a perfect correspondence between SCC-DFTB and B3LYP/pc-1 vibrational energy. |
| In the text | |
|
Fig. B.1 Infrared spectra for the pretzels and cages families. (a), (b) Zoom into the [2.8 - 4 µm] region. The intensities were multiplied by 4 for C24H6 and by 2 for C24H12 to make the structures of the bands visible. (c), (d) The features represented with dashed lines in the [10.2 - 22.7 µm] region were rescaled using the appropriate factors for C-H bend (see main text and Appendix A). The final shifted band in the [10.0 - 15.3 µm] domain is represented in plain lines. The emission spectra from the Orion bar H2S1(Van Diedenhoven et al. 2004) and from the SMP SMC 16 planetary nebula (García-Hernández et al. 2010) are added for comparison. |
| In the text | |
|
Fig. B.2 Evolution of the C(spx)Hn (x=1-3, n=1-3) ratio as a function of nH/nC for the pretzels (a) and cages (b) families. |
| In the text | |
|
Fig. C.1 TD-DFTB optical spectra of C24Hn (n=0, 6,12,18,24) for the pretzels (a) and cages (b) families. The average Galactic extinction curve adapted from Fitzpatrick & Massa (2007) is reported in dashed lines. |
| In the text | |
|
Fig. C.2 Representation of some relevant transitions for some isomers of the flakes families of C24Hn (n=6,12,18,24). |
| In the text | |
Current usage metrics show cumulative count of Article Views (full-text article views including HTML views, PDF and ePub downloads, according to the available data) and Abstracts Views on Vision4Press platform.
Data correspond to usage on the plateform after 2015. The current usage metrics is available 48-96 hours after online publication and is updated daily on week days.
Initial download of the metrics may take a while.